MTF Multi Indicator Table by JAB76TABLE for trading with EMA and ICHIMOKU , HELPS IN ANALYSIS OF TREND
Indicatori di ampiezza

TuxAlgo Plus a SMC and Trap Toolkit V0.98r1 by McTogaThe “TuxAlgo Plus” script is a powerful, standalone, conceptual open-source project and self-sufficient “smart money toolkit” with automatic trap detection (SMT), liquidity grabs, FVG confluence, and complete bot setup signals for TV charts in the “H1 to H6” time frame and daily charts.
The script is used to improve SMC/trap analyses, i.e., the structure and visualization logic for TradingView charts have been expanded in the “TuxAlgo++” project in line with Smart Money Concepts (SMC) and Smart Money Traps (SMT).
The SMT block (“Smart Money Traps”) supplements classic smart money concepts with:
1. Detection of bull traps (short setups) and bear traps (long setups)
2. Display of trap boxes in the chart (liquidity grab areas)
3. A bot setup box (table) with ready-made entry/SL/TP levels:
as well as age in bars & days and “Valid until ~X d” (remaining term)
SMT / bot setup only run on the following timeframes:
- H1, H2, H3, H4, H6 This means that traps, labels, and the bot setup box are only displayed on these timeframes
Trap definition “Bull Trap (Short Setup)”:
- Valid swing high
- Swing trend bullish
- High (Wick) pierces above the swing high (Liquidity Grab)
- Close falls back below the swing high (false breakout)
-> Result: Short setup (bull trap), marked in orange
Trap definition “Bear Trap (long setup)”:
- Valid swing low
- Swing trend bearish
- Low (wick) pierces below the swing low (liquidity grab)
- Close rises above the swing low again (false breakout)
-> Result: Long setup (bear trap), marked in blue
Entry / SL / TP calculation
A price range is taken for each trap:
Bull trap (short):
- Range =
- Entry = point within this range:
Entry = hiBT - (hiBT - loBT) * TrapEntryRatio (0..1)
-> 0.0 = at the Wick extreme, 0.5 = middle, 1.0 = at the Swing level
- SL = Wick extreme (upper edge of the trap)
- Risk = |Entry - SL|
- TP1 = Entry - R1 * Risk
- TP2 = Entry - R2 * Risk
Bear Trap (Long):
- Range =
- Entry analogous within the range according to TrapEntryRatio
- SL = wick bottom (lower edge of the trap)
- Risk = |Entry - SL|
- TP1 = Entry + R1 * Risk
- TP2 = Entry + R2 * Risk
R1 / R2 correspond to the inputs:
- botRR1Input = TP1 Risk/Reward (e.g., 1.5R)
- botRR2Input = TP2 Risk/Reward (e.g., 3.0R)
Age & Validity
Each trap stores:
- lastTrapBarIndex -> last bar of the trap
- Age in bars -> bar_index - lastTrapBarIndex
- Age in days (~d) -> AgeBars * BarDurationInDays (depending on TF)
Input: trapMaxAgeBars determines how long a trap is valid.
The bot setup box is only displayed if:
- a trap is present,
- AgeBars <= trapMaxAgeBars,
- SMT + Box + SMC timeframe are active.
Color logic (color blind friendly):
- Blue (accentBlue) = fresh traps (Age <= 1/3 MaxAge)
- Orange (accentOrange) = medium age
- Violet (accentPurple) = old, but still within MaxAge
- Gray (accentGray) = expired (> MaxAge)
The box also shows “Valid until ~X d” as the remaining term.
Day/Night Mode & Colors
- chart.bg_color is used to detect dark or light mode.
- Text/background colors adjust (light/dark).
- Accent colors (blue/orange/purple/gray) are suitable for red/green color blindness.
- Trap labels in the chart:
- Bull trap label = orange (short setup)
- Bear trap label = blue (long setup)
- Text color depends on chart mode (dark/light)
Typical workflow (example):
1. Select a suitable symbol & SMC timeframe (e.g., H4 or H6).
2. Wait for a bull trap (short) or bear trap (long).
3. Read in the bot setup box:
- Direction (long/short)
- Entry, SL, TP1, TP2
- Age & “Valid until ~X d”
4. These values can be used as a template for manual trading or external bot/order systems.
5. Position size & leverage must always be calculated separately in your own risk management
(e.g., 2% rule). This script does not calculate position sizes.

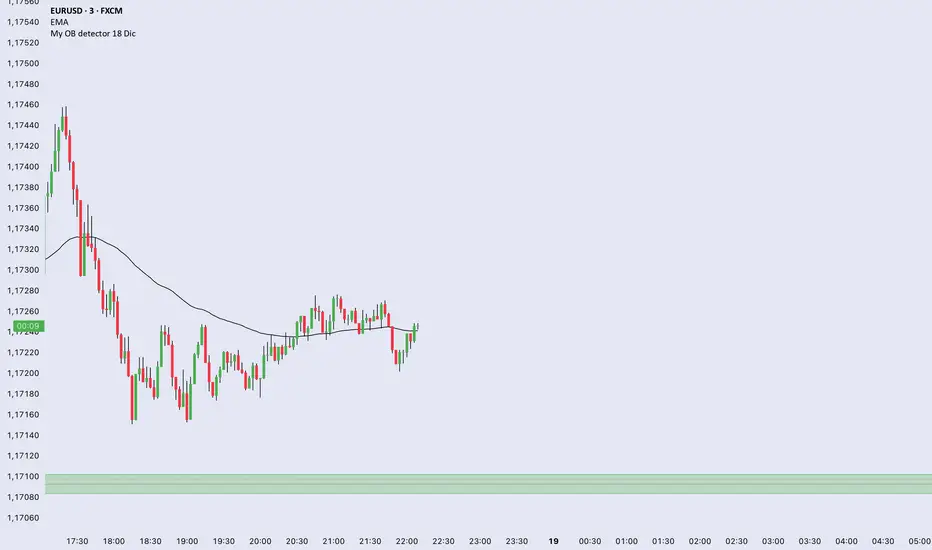
My OB detector 18 DicProfessional Order Block indicator optimized for M3 timeframe. It features automatic 50% entry detection, a strict 1:1 risk-to-reward ratio, and a 10-pip minimum profit filter. Strictly follows the Madrid session hours for Euro and US sessions.
Bull/Bear vs Base vs Index (% Change Spread)Visualizes the performance gap ("Beta Decay") between 3x Leveraged ETFs (SOXL/SOXS) and their underlying sector (SOXX), relative to the S&P 500 (SPY).
This indicator is designed for traders who trade leveraged products (like SOXL/SOXS, TQQQ/SQQQ) and need to see true relative strength beyond simple price action.
It calculates the percentage change over a user-defined lookback period for four instruments:
Base (1x): The sector benchmark (Default: SOXX).
Bull (3x): The leveraged long ETF (Default: SOXL).
Bear (-3x): The leveraged inverse ETF (Default: SOXS).
Index: The broad market zero-line (Default: SPY).
It then plots the Spread to reveal the health of the trend:
Bull Spread (Green Line): Bull % - Base %
Bear Spread (Red Line): Bear % - Base %
Base vs Index (Filled Area): Base % - SPY %
🧠 The Logic: Why Use Spreads?
In a perfectly efficient trending market, a 3x Bull ETF should move exactly 300% of the underlying asset. However, in choppy or volatile markets, volatility decay (beta slippage) causes leveraged ETFs to underperform mathematically.
Positive Spread: The leveraged ETF is successfully capturing momentum (The "Sweet Spot").
Negative Spread: The leveraged ETF is suffering from drag or the underlying asset is chopping.
📈 Recommended Trading Plan
Note: This indicator works best as a filter for entry conditions, not a standalone signal. Always use proper risk management.
Strategy A: The "Clean Trend" (Momentum)
Goal: Enter a 3x position only when volatility drag is minimal.
1. Bull Signal:
Condition 1: The Base vs Index (Area) is Green (Sector is outperforming SPY).
Condition 2: The Bull Spread (Green Line) is Positive (> 0).
Why: This confirms the sector is strong AND the 3x ETF is amplifying that move efficiently without decay eating the profits.
2. Bear Signal:
Condition 1: The Base vs Index (Area) is Red (Sector is lagging SPY).
Condition 2: The Bear Spread (Red Line) is Positive (> 0).
Why: This confirms the sector is crashing and the Bear ETF is successfully capturing the downside momentum.
Strategy B: The "Decay Avoidance" (Cash is King)
Goal: Avoid leveraged funds during chop.
Condition: If BOTH the Bull Spread and Bear Spread are Negative (< 0) (below the zero line).
Action: Stay in Cash or trade the 1x underlying (SOXX) only.
Why: When both spreads are negative, it mathematically proves that the market is too choppy for leverage. Both the Long and Short leveraged funds are losing value relative to the underlying asset.
Features:
Pine Script® v6: Updated for the latest engine performance and visuals.
Dashboard Table: Real-time percentage spreads displayed directly on the chart (customizable position).
Fully Customizable: Works on any sector (e.g., set inputs to QQQ/TQQQ/SQQQ for Tech).
Disclaimer:
Trading leveraged ETFs involves significant risk. This script is for educational purposes only.

S_Sigma HTF Candles (UTC Draw / NY Labels)🕯️ S_Sigma HTF Candles (UTC Draw / NY Labels)
Multi-Timeframe Overlay with Session Labels & Imbalances
S_Sigma HTF Candles is a powerful, non-repainting overlay indicator that allows you to visualize up to 6 different Higher Timeframes (HTF) directly on your current chart.
Designed specifically for traders who need context without switching tabs, this tool draws accurate HTF candles using UTC time (standard for Crypto) while labeling them with New York Timezone data (standard for Stocks/Forex). It also detects Fair Value Gaps (FVG) and Volume Imbalances automatically.
🌟 Key Features
📊 6 Independent HTF Slots
Configure up to 6 different timeframes simultaneously (e.g., 15m, 1H, 4H, 1D, 1W). Each slot is customizable and can be toggled on/off independently.
🌍 UTC Drawing + NY Labels (The "Sigma" Edge)
Drawing: Candles are calculated strictly using UTC time to ensure wicks and bodies match exchange data (perfect for BTC/ETH).
Labels: Day of the Week (Mon/Tue/Wed) and Time labels are converted to America/New_York time. Never get confused by candle closes again.
#HTF Countdown Timer**
See exactly how much time is left until the Higher Timeframe candle closes. Essential for timing entries at the "Candle Close."
📈 Smart Imbalance Detection
FVG (Fair Value Gaps): Automatically highlights 3-candle reversal gaps.
VI (Volume Imbalance): Highlights wicks that pierce previous bodies.
🏗️ Custom Session Starts
Don't like the standard Daily candle? Force the Daily candle to open at 08:30 NY or 09:30 NY (Market Open) instead of Midnight UTC.
⚙️ Customization Options
Visuals: Full control over Bull/Bear colors, borders, wicks, and opacity.
Layout: Adjust padding, width, and spacing between timeframes to prevent overlap.
Trace Lines: Optional lines tracing the Open, High, Low, and Close of the forming HTF candle.
Labels: Toggle HTF names, Timers, and Day-of-Week labels on/off.
💡 How to Use
Add to Chart: The indicator draws candles to the right of the current price (offset) to keep your chart clean.
Check Alignment: Ensure the "Daily Name" matches your expected market session (NY Time).
Spot Entries: Look for price entering an FVG (Gray box) or hitting a HTF Support/Resistance level (Wick of the HTF candle).
Time Entries: Wait for the Timer to hit 00:00 for a confirmed candle close.
Perfect for: Smart Money Concepts (SMC), ICT, Wyckoff, and Multi-Timeframe Analysis.

MACD Divergences + RSI/ADXMACD Divergences + RSI/ADX Indicator
This indicator combines the classic MACD divergence detection with real-time RSI and ADX monitoring in fixed corner labels.
🔹 MAIN FEATURES:
- Automatic MACD divergence detection (Classic & Hidden)
- Visual RSI and ADX labels fixed in the right corner
- Color-coded trend direction (Green: DI+ > DI- | Red: DI- > DI+)
- Customizable MACD settings (Fast/Slow Length, Signal Smoothing)
- Configurable RSI and ADX periods
- Built-in alerts for all divergence types
🔹 DIVERGENCE TYPES:
- Classic Bullish: Price makes lower lows, MACD makes higher lows (Reversal signal)
- Classic Bearish: Price makes higher highs, MACD makes lower highs (Reversal signal)
- Hidden Bullish: Price makes higher lows, MACD makes lower lows (Continuation signal)
- Hidden Bearish: Price makes lower highs, MACD makes higher highs (Continuation signal)
🔹 RSI & ADX DISPLAY:
- Fixed labels in top-right (RSI) and bottom-right (ADX) corners
- Real-time values updated on every bar
- Background color changes based on directional movement (DI+ vs DI-)
- Large, easy-to-read format
🔹 HOW TO USE:
1. Watch for divergence patterns on MACD histogram
2. Monitor RSI for overbought/oversold conditions
3. Check ADX for trend strength (>25 = strong trend)
4. Green labels = Bullish momentum (DI+ > DI-)
5. Red labels = Bearish momentum (DI- > DI+)
🔹 BEST FOR:
- Swing trading on 4H and Daily timeframes
- Trend-following strategies with mo

Power Law of Diminishing Returns for BTC:USDTThis is a script to see if the Law of Diminshining Returns is applicable to BTC/USD

Test此指標為測試階段
最近手法改變,高點出現率後移,
此指標為爆量後跌破12ema才放空,
由於操盤手還是可以騙線,故時間設定為10:00之後成功率比較大
This indicator is in the testing phase.
Recently, the method has changed, and the occurrence rate of high points has shifted later.
This indicator only calls for shorting after a surge in volume followed by a drop below the 12-day moving average (EMA).
Because traders can still create false signals, setting the time after 10:00 AM increases the success rate.
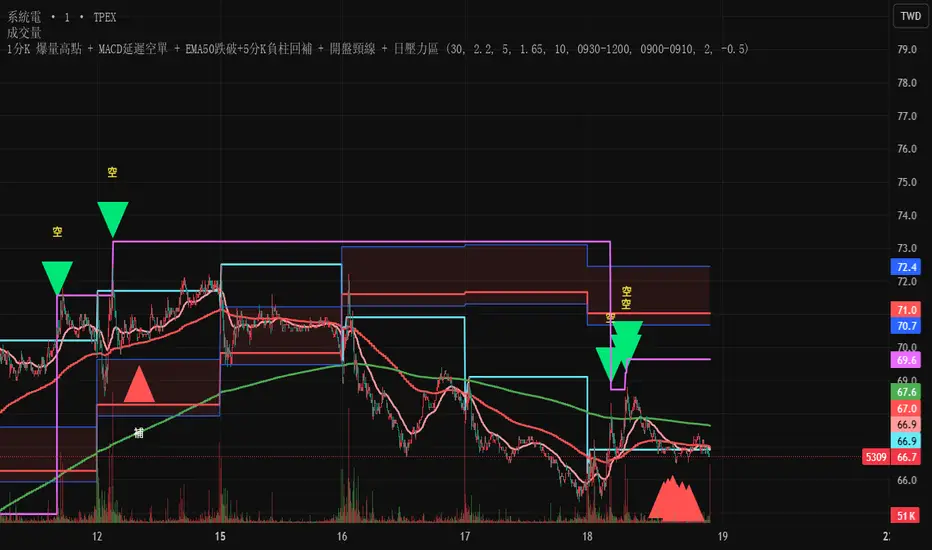
EMA12/50 如果放空後趨勢由背景紅轉綠可以考慮常抱
抱到背景再次翻紅而比較不被雜訊洗掉
現階段指標合併在一起會出BUG
If the trend changes from red to green after shorting, consider holding for a longer period.
Hold until the background turns red again to avoid being washed out by noise.
Currently, merging them together will cause bugs.

MRX_M7 777//@version=5
indicator("MRX_M7 777 MTF ALERT (jgar)", overlay=true)
// === SOZLAMALAR ===
tfInput = input.timeframe("15", "Qaysi TF")
showZone = input.bool(true, "Zonani ko‘rsat / o‘chirish")
zoneColor = color.new(color.lime, 75)
// === MTF DATA (BITTA QATORDA!) ===
= request.security(syminfo.tickerid, tfInput, )
// === ENGULF ===
engulf = mtfHigh > mtfHigh and mtfLow < mtfLow
// === ZONA ===
zoneHigh = mtfHigh
zoneLow = mtfLow
// === CHARTGA CHIZISH ===
if engulf and showZone
box.new(bar_index - 1, zoneHigh, bar_index, zoneLow, bgcolor = zoneColor, border_color = color.lime)
label.new(bar_index, zoneHigh, "ENGULF " + tfInput, style = label.style_label_down, textcolor = color.white, bgcolor = color.lime)
// === ALERT ===
alertcondition(engulf, title="MTF ENGULF", message="ENGULF " + tfInput + " timeframe da sodir bo‘ldi")

EMAs ChimuTraderPublicoscrip de emas 200 y 50 periodos para anlizar todo BINANCE:SOLUSDT y muchas monedas mas

Blaster FX ICTBlaster FX ICT
A professional ICT (Inner Circle Trader) based indicator designed to highlight institutional timing, key trading sessions, and the first Fair Value Gap during the New York session.
Features:
Kill Zones (New York Time):
Asia Kill Zone (20:00 – 00:00)
London Kill Zone (02:00 – 05:00)
New York Kill Zone (08:30 – 11:00)
Zones reset daily based on the ICT trading day (6:00 PM NY)
Key Levels:
Previous Day High (PDH)
Previous Day Low (PDL)
Important Opens:
8:30 AM New York Open
00:00 Midnight Open
Fair Value Gap (FVG):
Plots only the first FVG formed during the New York session after 9:30
Clear distinction between bullish and bearish FVGs
Purpose:
Improve entry timing during the New York session
Focus on the first institutional opportunity of the day
Reduce chart clutter and enhance price clarity
Disclaimer:
This indicator is for educational and analytical purposes only and does not constitute financial advice.

ICT Killzones & Sessions Pro |MC|ICT Killzones & Sessions Pro |MC|
Credits go to LuxAlgo for the great work 👍
This indicator has been further developed and enhanced with additional features.
This indicator highlights key market sessions and killzones directly on your chart, helping traders identify high-probability trading periods.
💎 Key features include 💎
🔸Display of major market sessions such as Asia, London, and New York (AM/PM) with customizable times and colors.
🔸Transparent session highlighting for visual clarity without cluttering the chart.
🔸Configurable vertical border lines with adjustable style, width, and color.
🔸Timeframe-based display limits to hide killzones on higher timeframes.
🔸Fully adjustable label size for easy identification of sessions.
🔸Customizable UTC offset to align sessions with your preferred timezone.
Designed for day traders and scalpers, it visually separates market sessions for better trade planning and timing.
Happy Trading!

Opening Price Lines Pro |MC|Opening Price Lines Pro |MC|
Credits go to tradeforopp for the great work 👍
This indicator has been further developed and enhanced with additional features.
💎 Features 💎
This indicator plots key opening prices, session times, and previous day high/low levels directly on the chart. It allows users to:
🔸Display multiple horizontal lines for daily and session open prices with customizable colors, styles, and label sizes.
🔸Show previous day high (PDH), low (PDL), and midline (50% level) for quick reference.
🔸Add vertical timestamp lines for major market sessions or custom times.
🔸Set cutoff times to limit line extensions and control the number of drawn lines on the chart.
🔸Adjust timezone offsets for accurate session and open price visualization.
🔸Fully customize label positions, offsets, colors, and line styles.
🔸Limit visibility based on timeframe and number of days for cleaner charts.
It’s designed to help traders quickly identify key levels and market sessions while maintaining a clean and organized chart layout.
Happy Trading!

ICT CBDR Range |MC|This indicator plots the CBDR Range on the Chart (Credits go to TFlab)
💎 What Is the Central Bank Dealers Range (CBDR)? 💎
In the Inner Circle Trader (ICT) Strategy, the CBDR identifies the projected high and low of a trading day. This range is calculated between 2:00 PM and 8:00 PM New York time. By observing specific deviations from the average price within this window, traders estimate potential price movements for the next session.
The range is derived from average price action.
Deviation levels above and below this average help forecast price behavior.
These deviations indicate how far prices may extend from the central range.
💎 Ideal Range Parameters for CBDR 💎
To optimize CBDR effectiveness, traders should consider the following:
Range Height: Determined by measuring the highest and lowest price within the CBDR window. It is preferable to use candlestick bodies, although wicks can be considered when body size is minimal.
Optimal Range: The most reliable CBDR measurements occur within a range of 10 to 20 pips, ideally remaining under 40 pips.
Large Ranges: When the range exceeds 40 pips, short-term trades tend to perform more favorably.
💎 Benefits of Implementing CBDR 💎
Using the Central Bank Dealers Range offers multiple advantages:
Improved Price Forecasting: Enhances accuracy in predicting price movements.
Risk Minimization: Enables traders to avoid unfavorable trade conditions.
Higher Success Probability: Identifies high-probability trade setups.
Versatility: Applicable to various assets and timeframes.
💎 How to Apply CBDR in Daily Trading 💎
Each trading day, the market tends to move price 1–2 times the CBDR range against the prevailing trend to gather liquidity. Following this, a directional move in line with the trend often occurs, typically equivalent to four times the CBDR range.
💎 Bearish Market Scenario 💎
On bearish days:
Price may exceed the upper CBDR boundary by a maximum of two units.
A typical move is one unit above the range to collect stop orders.
The projected daily low is often three units below the CBDR, usually forming at the end of the London session.
💎 Bullish Market Scenario 💎
On bullish days:
Price generally drops no more than two units below the CBDR.
A downward movement of one unit is common to gather liquidity.
The projected high of the day appears three units above the CBDR, typically near the London session close.
💎 Best Timeframes for CBDR Strategy 💎
CBDR is most effective on the following intraday timeframes:
15-Minute Chart: Offers precise insight into short-term price fluctuations.
30-Minute Chart: Provides a broader perspective for swing trading and market planning.
💎 Most Suitable Markets and Pairs for CBDR 💎
Originally developed for NASDAQ and S&P 500, the CBDR approach has since been adapted for other financial instruments.
Recommended Currency Pairs:
GBP/USD
EUR/USD
Precious Metals:
XAU/USD
XAG/USD
These markets demonstrate favorable price behavior around the CBDR, making them ideal for this strategy.
Happy Trading!


GBPUSD Institutional Signals - LIVE (Full Suite FIXED)This script is design to show market direction clearer
This script will also help with when the market may be finishing corseting itself and
will show when the continuation is resuming.

Custom Intraday Indicator with FII and Operator Activity//@version=5
indicator("Custom Intraday Indicator with FII and Operator Activity", overlay=true)
// Moving Averages for Entry/Exit Signals
shortMA = ta.sma(close, 9)
longMA = ta.sma(close, 21)
entrySignal = ta.crossover(shortMA, longMA)
exitSignal = ta.crossunder(shortMA, longMA)
// Open Interest and OI Change
oi = request.security(syminfo.ticker + ":OI", timeframe.period, close)
oiChange = oi - ta.valuewhen(oi != na, oi, 1)
// FII and Operator Activity (Assuming data is available from a custom source)
fiiBuying = request.security("FII_BUYING_DATA", timeframe.period, close)
fiiSelling = request.security("FII_SELLING_DATA", timeframe.period, close)
operatorBuying = request.security("OPERATOR_BUYING_DATA", timeframe.period, close)
operatorSelling = request.security("OPERATOR_SELLING_DATA", timeframe.period, close)
// Support and Resistance Levels
pivotHigh = ta.highest(high, 10)
pivotLow = ta.lowest(low, 10)
// Plotting
plot(shortMA, color=color.blue, title="Short MA")
plot(longMA, color=color.red, title="Long MA")
plotshape(entrySignal, style=shape.triangleup, location=location.belowbar, color=color.green, title="Entry Signal")
plotshape(exitSignal, style=shape.triangledown, location=location.abovebar, color=color.red, title="Exit Signal")
plot(pivotHigh, color=color.orange, style=plot.style_line, title="Pivot High")
plot(pivotLow, color=color.purple, style=plot.style_line, title="Pivot Low")
// Display OI and OI Change
plot(oi, color=color.blue, title="Open Interest")
plot(oiChange, color=color.fuchsia, title="OI Change")
// Display FII and Operator Activity
plot(fiiBuying, color=color.green, title="FII Buying")
plot(fiiSelling, color=color.red, title="FII Selling")
plot(operatorBuying, color=color.blue, title="Operator Buying")
plot(operatorSelling, color=color.purple, title="Operator Selling")

Bear Momentum Engine (RSI Regime)Title: Bear Momentum Engine (RSI Regime)
Bear Momentum Engine is a professional-grade analytical tool designed specifically for crypto markets during bearish cycles. Unlike traditional RSI indicators that look for "oversold" levels, this engine focuses on momentum structure and regime expansion phases.
The Philosophy
Most traders lose money by buying "oversold" RSI during a crash. This tool is built on Andrew Cardwell’s range shift theory: in a true bear regime, RSI struggles to break above 60, and its real power is found in how it expands away from its moving average.
Key Features:
Bear Regime Detection: Automatically identifies the bearish market phase. The background turns red only when the structural momentum confirms a downside bias.
Momentum Expansion: A proprietary algorithm tracks the "detachment" of RSI from its MA. When the distance increases, it signals a high-probability bearish thrust.
Iron Exit: A disciplined profit-taking system. It triggers an exit signal as soon as the momentum starts to fade, allowing you to lock in gains before the bounce.
No-Trade Zones: Filters out "market noise." The gray background indicates a sideways market where the risk-to-reward ratio is unfavorable.
Best Use Cases:
Strategy: Short-selling, Futures, and Perpetuals.
Goal: Trading with the trend and avoiding "bull traps."
Recommended Timeframes: 1H, 4H, Daily.

Americana Crypto Retail FOMO IndexRetail FOMO Index
Overview
The Retail FOMO Index is a sentiment indicator designed to help identify when retail investors are piling into the crypto market — often a sign that the market may be approaching overheated conditions. Historically, periods of extreme retail enthusiasm have coincided with local and macro tops, making this a useful tool for gauging market temperature.
What It Measures
This indicator combines two real-time data sources to create a composite "FOMO score" scaled from 0 to 100:
Coinbase Premium (50% weight)
This measures the price difference between Bitcoin on Coinbase (USD) and Binance (USDT). When US retail investors are aggressively buying, Coinbase often trades at a premium to other exchanges. A rising premium suggests increased retail demand, while a negative premium can indicate selling pressure or reduced interest.
Coinbase Stock Volume (50% weight)
This tracks the trading volume of COIN (Coinbase's stock on NASDAQ) relative to its recent average. When retail interest in crypto surges, Coinbase stock volume tends to spike as both crypto traders and traditional investors react to market momentum. The indicator calculates a Z-score to identify when volume is unusually high or low compared to its norm.
Settings
The indicator includes adjustable parameters:
Weights: Adjust the balance between Coinbase Premium and COIN Volume if you find one component more relevant
Lookback Period: Controls how much historical data is used for normalization (default: 50 periods)
Smoothing: Reduces noise in the final output (default: 7 periods)
Threshold Levels: Customize the boundaries for each zone
Display Options: Toggle component lines and background fills on/off
Important Notes
The COIN volume data begins in April 2021 (Coinbase IPO), so the indicator does not have data prior to that date
The Coinbase Premium is calculated using BTC regardless of what asset chart you apply it to — BTC tends to be the leading indicator for broad retail sentiment
This indicator works best on daily, weekly, and monthly timeframes
This is a sentiment tool, not a trade signal — use it alongside your existing analysis to add context

Order Flow Pro - CVD - Alphaomega18═══════════════════════════════════════════════════════════════════════════════
ORDER FLOW CVD SIMPLE - TRADINGVIEW PUBLICATION
Created by Alphaomega18
═══════════════════════════════════════════════════════════════════════════════
📝 COMPLETE DESCRIPTION
═══════════════════════════════════════════════════════════════════════════════
🎯 FOLLOW INSTITUTIONAL TREND AT A GLANCE
Order Flow CVD is an ultra-simple and ultra-effective indicator that displays CVD (Cumulative Volume Delta) with a colored fill zone to instantly identify order flow trend.
No complexity, no clutter: just 2 lines and 1 colored zone to know if you should HOLD or EXIT your trade.
🔥 THE GOLDEN RULE OF TRADING
The secret of professional traders:
→ "Let your winners run, cut your losses"
But how do you know WHEN to hold and WHEN to exit?
**The answer: CVD (Cumulative Volume Delta)**
As long as institutional flow goes your way, HOLD the trade.
As soon as flow changes, EXIT.
This is exactly what this indicator does: it shows you the flow in real-time with ultra-clear visualization.
📊 HOW IT WORKS
🔷 **2 SIMPLE LINES**
**WHITE Line** = CVD (Cumulative Volume Delta)
→ Cumulative sum of volume delta
→ Rises when buying > selling
→ Falls when selling > buying
**YELLOW Line** = CVD Moving Average (20 periods default)
→ Smooths CVD to see trend
→ Filters noise
→ Reference for trend
🔷 **COLORED FILL ZONE**
🟢 **GREEN ZONE** = White CVD ABOVE yellow CVD
→ BULLISH trend
→ Institutions are BUYING
→ HOLD your LONG trades
→ Avoid SHORT
🔴 **RED ZONE** = White CVD BELOW yellow CVD
→ BEARISH trend
→ Institutions are SELLING
→ HOLD your SHORT trades
→ Avoid LONG
⚡ **CROSSOVER** = Zone changes color
→ Trend change
→ Exit or reverse position
→ Clear and sharp signal
🎯 USAGE RULES
📌 **RULE #1: HOLD A LONG TRADE**
You're in a LONG:
→ ✅ As long as ZONE IS GREEN → HOLD
→ ❌ As soon as ZONE TURNS RED → EXIT
Real example:
```
LONG entry: 16,500
Zone stays green for 2 hours
Price climbs to 16,650 (+150 points)
Zone turns red → EXIT
You pocket +150 points instead of giving back 50 points!
```
📌 **RULE #2: HOLD A SHORT TRADE**
You're in a SHORT:
→ ✅ As long as ZONE IS RED → HOLD
→ ❌ As soon as ZONE TURNS GREEN → EXIT
Real example:
```
SHORT entry: 16,500
Zone stays red for 1 hour
Price drops to 16,350 (-150 points)
Zone turns green → EXIT
You pocket +150 points!
```
📌 **RULE #3: DON'T ENTER COUNTER-TREND**
Green zone visible:
→ ❌ Do NOT enter SHORT
→ ✅ Look for LONG setups only
Red zone visible:
→ ❌ Do NOT enter LONG
→ ✅ Look for SHORT setups only
📌 **RULE #4: CROSSOVERS = CHANGE**
White CVD crosses yellow CVD:
→ Zone changes color
→ Institutional flow reverses
→ Exit or reverse position
💡 REAL USE CASES
📊 **CASE 1: MNQ Scalping 5min**
Setup:
→ Price breaks resistance
→ CVD zone is GREEN
→ You enter LONG
Management:
→ Price rises, pulls back, rises again
→ Zone STAYS GREEN → You hold
→ +30 points, +40 points, +50 points...
→ Zone turns RED → You exit at +52 points
Without CVD:
→ You would have exited at +15 points out of fear
→ You lose 37 points of gain!
📊 **CASE 2: ES Day Trading 15min**
Setup:
→ Price in range
→ CVD zone RED for 1 hour
→ Price touches top of range
→ You enter SHORT
Management:
→ Zone STAYS RED during decline
→ Price makes -20 points, -30 points, -40 points
→ Zone turns GREEN → You exit at +42 points
Without CVD:
→ You would have exited at +20 points (fear)
→ Or held too long and gave back gains
📊 **CASE 3: Avoid Losing Trade**
Perfect technical setup:
→ Triangle breakout
→ Supportive VWAP
→ FVG below
BUT... CVD zone is RED!
Decision:
→ You DON'T ENTER LONG
→ Price rises 10 points then collapses -30 points
→ Losing trade avoided thanks to CVD!
⚙️ CUSTOMIZABLE PARAMETERS
🔧 **CVD Moving Average Length** (default: 20)
→ Yellow moving average length
→ Shorter (10-15) = More reactive, more signals
→ Longer (30-50) = Smoother, fewer false signals
Recommendations by style:
• Scalping (1-5min): 10-15
• Day Trading (15min-1H): 20 (default)
• Swing Trading (4H-Daily): 30-50
🎨 **Show Fill Between CVD and MA** (On/Off)
→ Show/hide colored zone
→ OFF = Just 2 lines
→ ON = Lines + green/red zone
🎨 **Bullish Fill Color** (Customizable)
→ Bullish zone color
→ Default: Transparent green (80%)
→ Change to blue, cyan, or other
🎨 **Bearish Fill Color** (Customizable)
→ Bearish zone color
→ Default: Transparent red (80%)
→ Change to orange, pink, or other
💡 **Transparency Tip:**
→ 90% transparent = Very subtle
→ 80% transparent = Balanced (recommended)
→ 60% transparent = Well visible
→ 40% transparent = Very visible
📊 RECOMMENDED CONFIGURATIONS
**Scalping (1-5min) - Reactive**
```
CVD MA Length: 10
Show Fill: ✅ ON
Bullish Color: Green 70% transparent
Bearish Color: Red 70% transparent
```
**Day Trading (15min-1H) - Balanced** ⭐
```
CVD MA Length: 20
Show Fill: ✅ ON
Bullish Color: Green 80% transparent
Bearish Color: Red 80% transparent
```
**Swing Trading (4H-Daily) - Smooth**
```
CVD MA Length: 30
Show Fill: ✅ ON
Bullish Color: Green 85% transparent
Bearish Color: Red 85% transparent
```
**Minimalist - Lines only**
```
CVD MA Length: 20
Show Fill: ❌ OFF
(Just white and yellow, no zone)
```
💡 MARKETS AND TIMEFRAMES
✅ **ALL markets compatible:**
• Futures (ES, NQ, YM, RTY, MNQ, MES, etc.)
• Forex (EUR/USD, GBP/USD, USD/JPY, etc.)
• Crypto (BTC, ETH, altcoins)
• Stocks (Tesla, Apple, Nvidia, etc.)
• Indices (S&P 500, Nasdaq, Dow Jones)
✅ **All timeframes:**
• Scalping: 1min, 5min
• Day Trading: 15min, 30min, 1H ⭐ (optimal!)
• Swing Trading: 4H, Daily
Note: More reliable with real volume data
→ TradingView Premium recommended
🏆 UNIQUE ADVANTAGES
✅ **Ultimate simplicity**: 2 lines, 1 zone, 1 rule
✅ **Instant vision**: Green = hold LONG, Red = hold SHORT
✅ **Hold trades longer**: Maximize your gains
✅ **Avoid counter-trend**: Don't trade against flow
✅ **Customizable**: Colors and transparency of choice
✅ **Ultra-light**: Optimized code, no lag
✅ **No repaint**: Reliable signals
✅ **Works everywhere**: All markets, all TF
🎓 QUICK INTERPRETATION
**When zone is GREEN:**
→ Institutions buying
→ Bullish momentum
→ Hold LONG, avoid SHORT
→ Look for buy setups
**When zone is RED:**
→ Institutions selling
→ Bearish momentum
→ Hold SHORT, avoid LONG
→ Look for sell setups
**When zone CHANGES color:**
→ Institutional flow reverses
→ Trend changes
→ EXIT position
→ Or reverse if new setup
**White line volatile:**
→ White CVD zigzags a lot
→ Market indecisive or range
→ Wait for clear zone before trade
💪 TRADER PSYCHOLOGY
What THIS indicator solves:
❌ "I'm afraid, I exit too early" → Green/red zone says WHEN to exit
❌ "I hold my losses too long" → Zone changes = EXIT
❌ "I trade counter-trend" → Zone tells which direction to trade
❌ "I don't know if trend continues" → Green/red zone = answer
Result:
✅ You hold your gains longer
✅ You exit at right time
✅ You avoid counter-trend trades
✅ You trade with institutions
🔗 PERFECT COMPLEMENT
Use with:
• **Order Flow Signals** → Precise signals (💎▲🚀)
• **VWAP** → Institutional price levels
• **Fair Value Gaps** → Inefficiency zones
• **Market Profile** → POC/VPOC
**CVD Simple** tells you WHEN to hold/exit
**Technical analysis** tells you WHERE to enter
⚠️ DISCLAIMER
Technical indicators are decision support tools. No indicator guarantees profits. Always use:
• Appropriate risk management
• Stop loss on every trade
• Proper position sizing
• Demo account testing first
Order Flow CVD improves your trade management but doesn't replace a complete strategy.
🚀 INSTALLATION
1. Copy the Pine Script code
2. Open Pine Editor in TradingView
3. Paste the code
4. Click "Add to Chart"
5. Indicator displays in separate pane (below)
6. Configure colors to your preferences
7. Apply golden rule: Green = LONG, Red = SHORT!
💡 PRO TIP
**CVD Discipline:**
Create this mental rule:
→ "I NEVER exit a position until zone changes color"
This simple discipline will:
✅ Multiply your gains (you hold longer)
✅ Reduce your losses (you exit when flow changes)
✅ Eliminate emotional exits
✅ Align you with institutions
📞 CONTACT AND SUPPORT
Created by Alphaomega18
For questions, bugs or suggestions:
Find my other indicators:
• Order Flow Signals (precise signals on chart)
• Order Flow Dashboard (CVD oscillator + pressures)
• VWAP Multi-Timeframe Pro
• Fair Value Gap Detector

BK AK-Momentum Pivot Wolf🐺⚔️ BK AK–Momentum Pivot Wolf — The Court of Price. ⚔️🐺
Not prophecy. Procedure. Not prediction. Judgment.
Most indicators sell you a feeling: “it’s going up.”
Pivot Wolf is built to do the opposite: make the market prove it—under rules.
Price lies. Not maliciously—mechanically.
It prints motion whether there’s intent behind it or not. That’s why traders get slaughtered: they treat movement like truth.
Pivot Wolf treats movement like a defendant.
⚖️ The Law of the Tool (What It Refuses to Do)
This script does not exist to “call tops and bottoms.”
It exists to remove the sin that ruins traders:
answering before hearing.
If you trade before testimony, you’re not trading—you’re volunteering.
So Pivot Wolf is designed to withhold permission until three things line up:
Pivots = Boundary Stones
Where price must answer. Where excuses die. Where decisions become visible.
Momentum = Witness
Not what price did—what it carried. Force behind the move, not the costume of the candle.
Acceleration = Confession
The moment intent leaks. The early tell that strength is arriving—or that strength is bleeding out.
You’re not hunting “signals.”
You’re watching a case get built.
🪨 Solomon’s Hidden Layer (Why This Is a Wisdom Tool)
Solomon’s world wasn’t obsessed with forecasting. It was obsessed with right judgment.
He didn’t ask, “What do I want to happen?”
He asked, “What’s true—and what is counterfeit?”
That’s why his writing keeps returning to the same themes:
Weights & measures (standardization over vibes)
Witnesses (confirmation over impulse)
Gates & boundaries (permissioned action over chaos)
Silence (restraint as intelligence)
Pivot Wolf is built in that spirit: it’s a weights-and-witness engine disguised as an indicator.
It’s trying to keep you from trading counterfeit strength at the edge of a boundary.
🐺 How to Use It Like You Actually Respect Capital
1) Campaign Mode (Trend):
Boundaries tell you where business is allowed. Momentum/acceleration tell you whether business is justified. You press when testimony is clean—not when price is exciting.
2) Verdict Mode (Turns):
Reversals aren’t vibes. They’re a collapse of testimony: momentum fails at the boundary, acceleration flips, and the move confesses exhaustion.
3) Stand-Down Mode (The Feature Tourists Hate):
When the script goes quiet, it’s not “missing trades.”
It’s telling you: the court is not in session.
That’s the part that keeps your P&L alive.
🏷️ BK / AK
BK is the mark I’m building.
AK is honor—my mentor’s standard: clarity, patience, no shortcuts.
Above that: gratitude to Gd, the true source of wisdom, restraint, and endurance.
📜 King Solomon Lens
“Solomon didn’t predict. He judged. He built tests that made truth show itself. Pivot Wolf is that: pivots as boundary stones, momentum as witness, acceleration as the confession. No hammer in the Temple — rules are cut before entry. When it’s quiet, it’s saving you. When it speaks, it’s a ruling.”
This is not financial advice. This is structure.
If you wanted a fortune teller, you’ll hate this script.
If you wanted a system that makes the market prove itself before you strike—welcome to the Wolf.

Breakout PRO (B:Pro)Breakout PRO (B:Pro) is an invite-only, multi-filter breakout and trend suite for discretionary trading on any symbol and timeframe. It combines a custom EMA cloud, volatility and momentum filters, higher-timeframe bias, and signal quality scoring into a single framework, so there is no need to stack multiple separate indicators.
Core concept
The script builds a three-layer EMA cloud around price. The relative position of fast, mid, and slow EMAs, plus an ATR-based outer padding, defines:
Bull regime: EMAs bullishly stacked, cloud acting as dynamic support
Bear regime: EMAs bearishly stacked, cloud acting as dynamic resistance
Neutral regime: mixed or crossing EMAs, cloud fades to a neutral color
The cloud defines both the primary trend context and the breakout zones (cloud upper / cloud lower).
A higher-timeframe 200 EMA (user-defined timeframe) adds a long-term directional bias on top.
Support, resistance and structure
Last confirmed swing high and swing low are detected via pivot logic and drawn as dotted support / resistance lines.
These levels are invalidated with a small ATR buffer once price clearly breaks through.
Optional long-term EMA targets (T1 and T2, default 233 and 377) are plotted as future target lines, which can act as potential mean-reversion or trend-continuation objectives.
Filters used in entries
Long and short breakout signals are only shown when multiple, independent conditions align. Each filter can be turned on or off:
Volume: current volume vs volume SMA
MACD: line direction and histogram momentum
RSI: classic OB/OS behavior with sentiment-adjusted thresholds
Stoch RSI: K vs D direction inside valid zones
Bollinger Bands + Keltner Channels: squeeze state and BB breakouts
VWAP: price relative to intraday VWAP
ADX: minimum trend strength threshold
OBV & Ichimoku: optional extra trend confirmation layers
A dedicated Market Sentiment input (Standard, Bullish, Bearish, Consolidation) shifts RSI bands, ADX threshold, and volume requirements so the same logic adapts to different market conditions.
Signals and exits
Entry logic
Long signal: bullish EMA stack, breakout above the last pivot resistance and above the upper cloud, with all enabled long filters confirming.
Short signal: mirrored conditions below the last support pivot and below the lower cloud, with all enabled short filters confirming.
The script internally tracks trade state:
Sets an ATR-based stop level at entry, with mode-dependent ATR multipliers (Short / Mid / Long).
Applies an optional maximum trade duration (different per trade mode).
Plots exit markers when:
the ATR stop is hit
the cloud / EMA structure flips against the trade
MACD or RSI move against the position
or the time limit for the trade is exceeded
Additional icons highlight:
Strong breakouts / breakdowns with large ATR range and high volume
Squeeze releases after low-volatility phases
EMA cross events
Continuation and potential reversal zones around the cloud
Optional RSI divergence arrows based on a separate, mode-tuned RSI.
Quality and safety scoring
Every entry is evaluated on two simple scales (1–3):
Safety score (1–3): driven mainly by volume confirmation, ADX trend strength, distance from the cloud / structure, and overall trend alignment.
Quality score (1–3): reflects BB and MACD confirmation, RSI position, rough reward-to-risk context, and alignment with the selected Market Sentiment.
You can:
Show compact S/Q labels directly next to entry and exit signals.
Use the fixed signal history panel in the bottom-left corner to see the last 5 trade events (opens, closes, crosses, continuation) with their safety and quality scores.
Inputs and layout options
Key configurable inputs include:
Trade Mode: Short (e.g., 30m), Mid (e.g., 4h), Long (e.g., 1D+). This adjusts all core lengths (EMAs, ATR, divergence RSI).
Market Sentiment: Standard, Bullish, Bearish, Consolidation (dynamically retunes filters).
Per-filter toggles for Volume, MACD, RSI, Stoch RSI, BB, Ichimoku, ADX, OBV, VWAP, and HTF levels.
Panel size: Desktop, Phone, or None for the signal history panel.
Side labels: Desktop (full text labels on the price scale) or Phone (compact labels) for better chart space on smaller screens.
Usage notes
Breakout PRO is a technical analysis tool, not an automated trading system or financial advice.
Signals are calculated on closed data without intentional repainting, but values on the current bar can still evolve until the bar closes. Use this indicator as a structured way to read trend, breakout, and confluence – and combine it with your own trade plan, risk management, and testing.
