Bitcoin Stock To Flow Rainbow IndicatorHello everyone,
I have finished to create the Bitcoin stock to flow indicator, rainbow version.
It's a Bitcoin price prediction model.
What is Stock To Flow ?
Stock is the size of the existing stockpiles or reserves and flow is the yearly production.
The formula is : Stock divided by flow ( Stock_to_flow = STOCK / FLOW )
The supply of bitcoins is fixed in the source code.
What we know :
Blocks are created every 10 minutes ( average )
In 2009, 50 Bitcoins was created every 10 minutes , so 300 Bitcoins per hour, 7200 per day, 2628000 per year
The Halving happened each 210000 blocks , the average time between halving is around 1300-1400 days.
The mathematical formula that I used for the rainbow line is : exp(-1,84) * (Stock_to_flow ^ 3,36)
And the mathematical formula that I used for the " top price line " is : 1.2 * (Stock_to_flow ^ 3)
The rainbow line IS the prediction model .
We can observe that :
The price follow the rainbow line
After each halving, the price grow and touch few month after the rainbow line
When the price is between the rainbow line and the " top price line ", habitually, it's followed by a drop of the price below the rainbow line.
Special thanks to PlanB.
Btc!

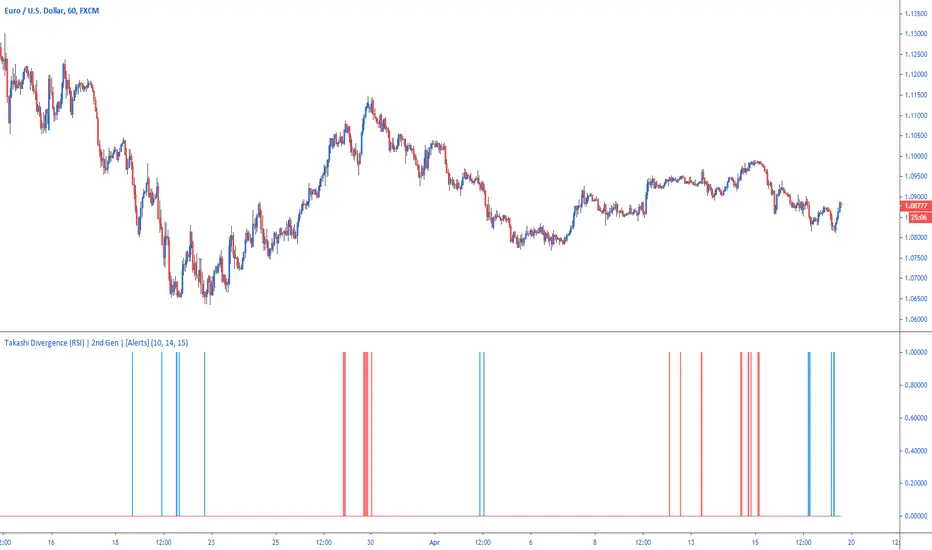
Takashi Divergence (RSI) | 2nd Gen | [Alerts]Easily highlight positive or negative divergence between price movement and RSI with Takashi-powered Divergence analysis.
Divergence strategy signals a potential reversal point because directional momentum does not confirm price. A bullish divergence occurs when the underlying market makes a lower low and RSI forms a higher low: RSI does not confirm the lower low and this shows strengthening momentum. A bearish divergence forms when the market records a higher high and RSI forms a lower high: RSI does not confirm the new high and this shows weakening momentum.
Inputs
Divergence Sensitivity
Float input. Sets a threshold after when the RSI divergence is triggered.
RSI Length
Integer input. The default setting used by most traders for the RSI is 14. That means that the indicator will go back 14 periods or time frames based on the chart being used (14 days on a Daily chart , 14 hours on an hourly chart and so forth) and make its calculation based on that.
Cross Distance
Integer input. Value from RSI that above or below 50 that classifies bullish or bearish levels. By default 15, that means the script will be checking for positive divergence when RSI is below 35 (50-15) and negative divergence when RSI is above 75 (50+15).
Use High & Low
Bool input. If true uses high and low values as RSI source.
To get access to this and other scripts check links below.
Takashi Triangular Arbitrage | 2nd Gen | [Alerts]Spot discrepancies between three currencies: these opportunities are rare and usually benefit to traders using advanced programs. You can now set up alerts and discover those for yourself.
This indicator signals opportunities for executing triangular arbitrage. Triangular arbitrage is the result of a discrepancy between three different currencies that occurs when the currency's exchange rates do not exactly match up. These opportunities are more frequent at cryptocurrency markets. The trader would exchange an amount at one rate (Currency_B/Currency_A), convert it again (Currency_C/Currency_B) and then convert it finally back to the original (Currency_C/Currency_A), and assuming low transaction costs, net a profit.
Example:
As per standard inputs, the trader would use US dollars to buy BTC (BITFINEX:BTCUSD), use BTC to buy NEO (BITFINEX:NEOBTC), use NEO to buy US dollars back (BITFINEX:NEOUSD). Whenever the quantity of US dollars bought back is higher than 1% from the initial amount, the indicator will send an alert signaling an arbitrage possibility.
Disclaimer: triangular arbitrage requires advanced automation tools and is only possible if there is enough liquidity to quickly execute all 3 trades at prices used on the indicator.
Inputs
Symbol 1
Symbol input. First step currency to initiate triangular arbitrage. (Currency_B/Currency_A)
Symbol 2
Symbol input. Second step currency to continue triangular arbitrage. (Currency_C/Currency_B)
Symbol 3
Symbol input. Final step currency to finalize triangular arbitrage. (Currency_C/Currency_A)
Discrepancy %
Float input. Amount in percent of profit return after triangular arbitrage is finished. Transaction fees not included.
To get access to this and other scripts check links below.

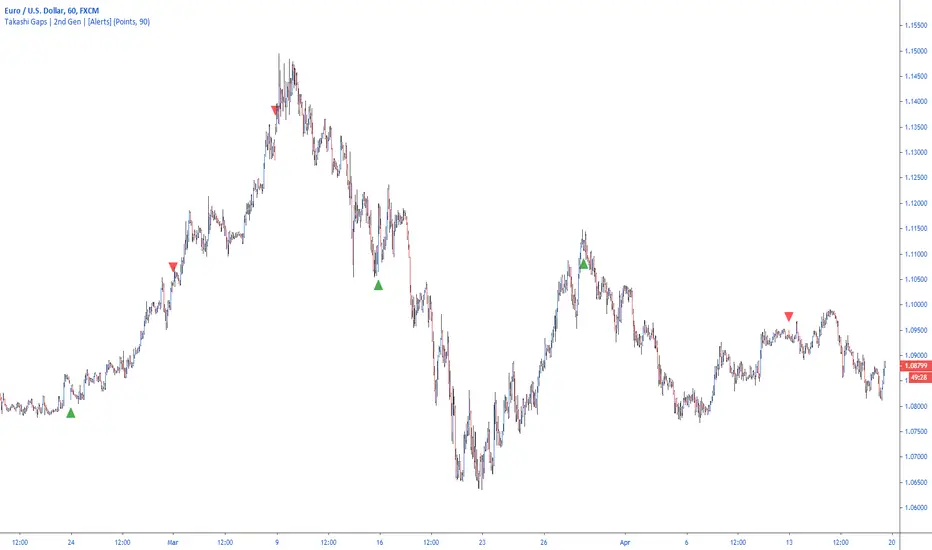
Takashi Gaps | 2nd Gen | [Alerts]Spot gaps between bars and benefit from the correction of the market as the price restores its position.
Inputs
Value In
Options input. Defines if the gap between bars will be checked by Points or Percent.
Gap Size
Float input. Value to trigger a signal if the gap between bars is bigger than.
To get access to this and other scripts check links below.
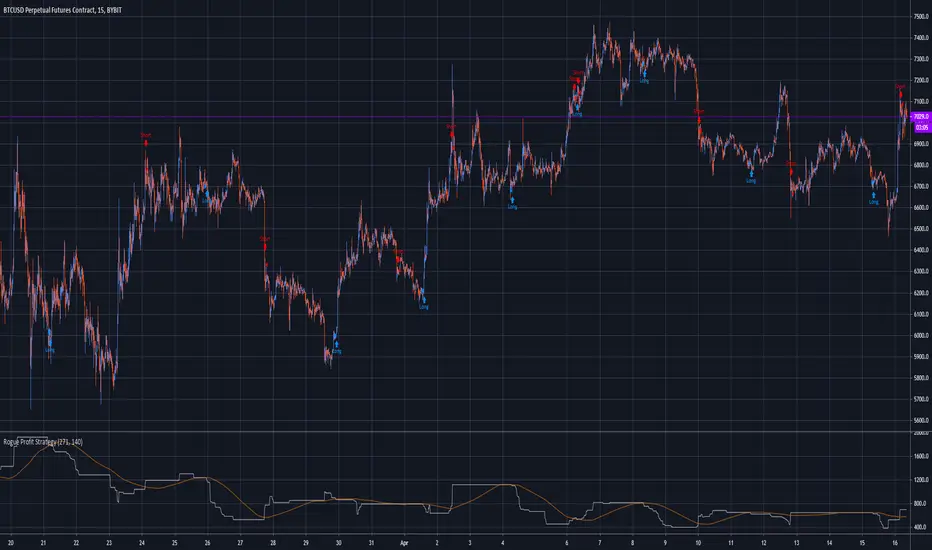
Rogue Profit Alert IndicatorThis is a complex script developed to measure specific volatility parameters and enter trades based on predetermined rules which are proprietary and will not be released, so don't ask for specific indicator settings.
This indicator accompanies the "Rogue Profit Strategy" and can be used for creating alerts based on the strategy's performance. Please read the more in depth description on the "Rogue Profit Strategy" page. Make sure the input parameters are the same for both the Strategy and Indicator to insure accurate signals.
This is a very powerful and profitable script that will simplify your trading and has been in development and tested for three years. Message for details on how to obtain access. Please allow up to 24 hours for a response.

Rogue Profit StrategyThis is a complex script developed to measure specific volatility parameters and enter trades based on predetermined rules which are proprietary and will not be released, so don't ask for specific strategy settings.
The strategy keeps you in the market at all times either long or short. Parameters can be changed to better suit the asset your are trading, time frame and your particular trading style but the overall volatility rules for entering and exiting remain the same. It can be used to trade any asset but be aware the parameters you use for one asset, lets say Bitcoin, will not work with another asset like Forex. If the asset is on TradingView, you can use this indicator to trade it.
It is meant to trade pure price action candlesticks so do not use anything but a typical candlestick chart. You are going to have to put in some work and play around with the input parameters to make this strategy the most profitable for your trading style. Trading is hard but hopefully this strategy will help flatten the learning curve. This strategy is accompanied by an indicator study named "Rogue Profit Alert Indicator" that will work with setting alerts for manual or automated trading.
This strategy does NOT repaint.
This is a very powerful and profitable script that will simplify your trading and has been in development and tested for three years. Message for details on how to obtain access. Please allow up to 24 hours for a response.
eha Moving Averages StrategyMoving Average based strategies are very popular ones among both long-term investors and short-term traders as they can be tailored to any time frame. One of the main moving average strategies are crossovers. The very simple type is a price crossover , which is when the price crosses above or below a moving average to signal a potential change in trend.
Another strategy is to apply two moving averages to a chart: one longer (or slow) and one shorter (or fast). When the shorter-term MA crosses above the longer-term MA, it's a buy signal, as it indicates that the trend is shifting up (also known as “ Golden Cross ”). Meanwhile, when the shorter-term MA crosses below the longer-term MA, it's a sell signal, as it indicates that the trend is shifting down (which is also known as “ Dead/Death Cross ”).
This is a study to find a suitable trading strategy for 4-6 hour time frames. As you can see the performance is currently very poor. It has just generated almost 90 trades in a very long period from January 2017 to the time of publishing the study for the first time.
Moving averages work quite well in strong trending conditions but poorly in choppy or ranging conditions. Adjusting the time frame can correct this problem temporarily, although, at some point, these issues are likely to occur regardless of the time frame chosen for the moving average(s).
I am working on this basic strategy to make its performance better and I will update the post in the future. So keep in touch by following the post.
Why have I republished my study?
It sounds like TradingView stores and indexes scripts based on the title of the post rather than the actual title of the scripts and if one chose general terms as the title of the post, the TradingView script search engine may be unable to find it. So I decided to repost the strategy with a more searchable and unique prefix of " eha ".
Please provide me with your precious feedback.

Gekko DEMA StrategyThis script is based upon the Gekko trading strategy.
This strategy uses Exponential Moving Average crossovers to determine the current trend the market is in. Using this information it will suggest to ride the trend. Note that this is not MACD because it just checks whether the longEMA and shortEMA are % removed from each other.
* short is the short EMA that moves closer to the real market (including noise)
* long is the long EMA that lags behind the market more but is also more resistant to noise.
* the down threshold and the up threshold tell Gekko how big the difference in the lines needs to be for it to be considered a trend. If you set these to 0 each line cross would trigger new advice.
The base strategy has had money management logic added and has been tested for best results. Once you have access, you can modify these settings to find what works best for you.
Access to this strategy is FREE! Message me for more information on how to get access.

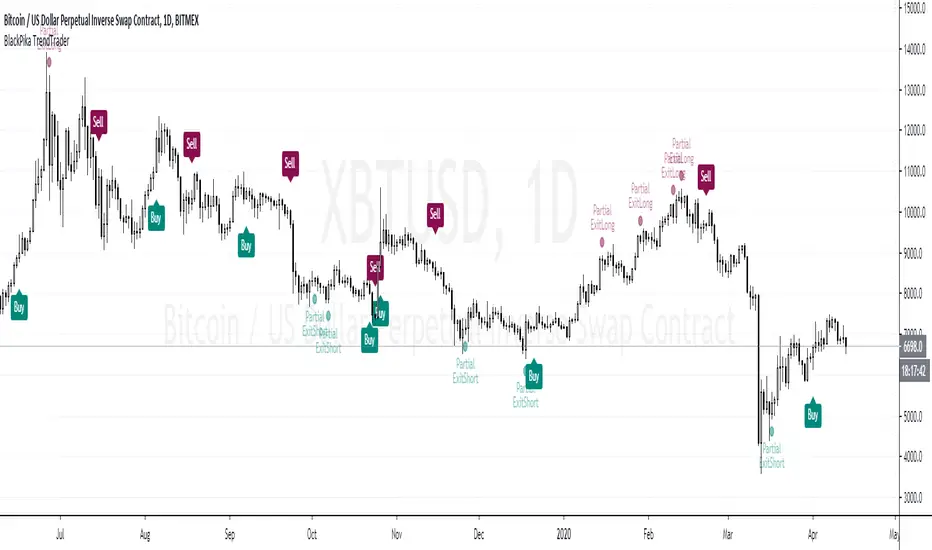
BlackPika TrendTraderIntroducing BlackPika TrendTrader (TT)
This indicator use moving averages and RSI (Default settings) for Entry Signals and Partial Exits.
It is recommended to use this for Spot market trading for swing trades, ideally on higher timeframes (4H to D)
It can be used to gauge the trend of underlying asset on Daily timeframe.
Trailing signals are also available such as Trailing take profits and Trailing stop losses.
There are two modes available for entry signals
- Normal mode (default)
- Sensitive mode (which can give better entries but also can lead to higher noise)
Hope you find this indicator useful.
Do comment if you have any questions.
Good luck in your trading.
BlackPika TrendTrader StrategyIntroducing the Trend Trader
This strategy uses moving averages as its base and it can be effective for trading ALT/BTC pairs on higher timeframes (4H to D)
It is intended to give you a direction of the trend of the market. I personally use it to gauge the trend and trade major pairs.
The backtester has 0.1% commision set and a slippage of 1 tick.
Some more custom options are available as following
Fixed TP
Fixed SL
Trailing TP
Trailing SL
Nothing above constitutes as a financial advise. If you have any question, please feel free to ask !
Good luck in your trading.

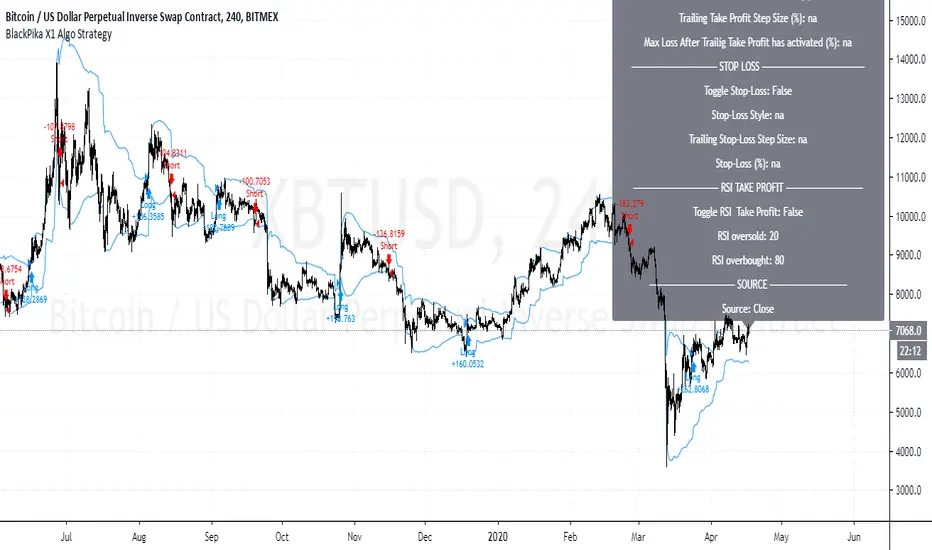
BlackPika X1 Algo StrategyBlackPika X1 Algo is a successor to the original BlackPika Algo.
It uses the following main elements:
RSI
ATR
ADX
Volume
Chopiness Filter
Trailing Profit
Fixed Profit
Trailing Stop loss
Fixed Stop Loss
Donchian channels and some more...
The backtest you see includes a commision of 1% and slippage of 1 tick. and the start date is from 2015
All the above mentioned settings are customisable, and can be adapted to your liking, timeframe and Asset.
Hit me up if you have any questions. This is only a backtest version.
All the best in your trading.
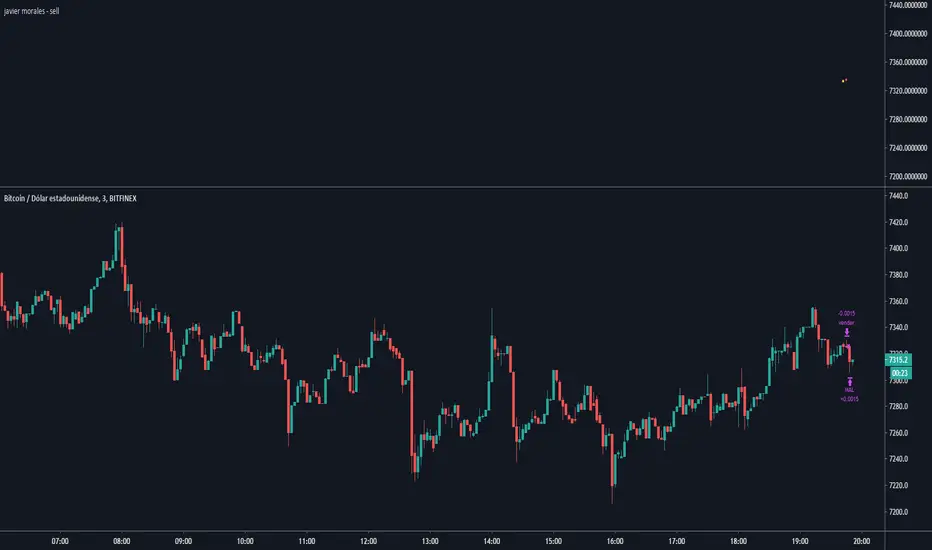
Javier Morales - sellEste script, creado por mi, opera sobre la gráfica BTC/USDT aunque puede ser utilizado en cualquier otra gráfica. Trabaja a la baja, en corto, aplicando una de las técnicas mas simples del trading, siempre que el precio de apertura de la vela anterior sea mayor que el precio de apertura de la vela posterior invierte una cantidad X, al final de la vela actual tanto si el precio ha subido como bajado cerrará la posición, pero si ha subido duplicará la inversión hasta que o bien se acabe el capital inicial o bien obtenga ganancias mayores que cero.
This script, created by me, operates on the BTC / USDT chart although it can be used on any other chart. Work downwards, in short, applying one of the simplest trading techniques, provided that the opening price of the previous candle is greater than the opening price of the subsequent candle invests an amount X, at the end of the current candle both if the price has risen or fallen, it will close the position, but if it has risen, it will double the investment until either the initial capital runs out or it makes profits greater than zero.
Javier Morales.
Level KingShows key historical support & resistance (S/R) levels on multiple timeframes
Shows two nearest levels below and above current close price on 2 selected time frames
Option to select timeframes (daily, weekly, monthly, current)
Option to display moving average S/R levels as well (daily and weekly)
Option to display levels for current bar only, or to show all historic S/R levels as they occurred
Strategies include:
Enter or add to long positions on "support" (when price touches a green/blue line)
Enter or add to short positions on "resistance" (when price touches a red/purple line)
Take profit from a long position when a "resistance" level is touched for the first time
Take profit from a short position when a "support" level is touched for the first time

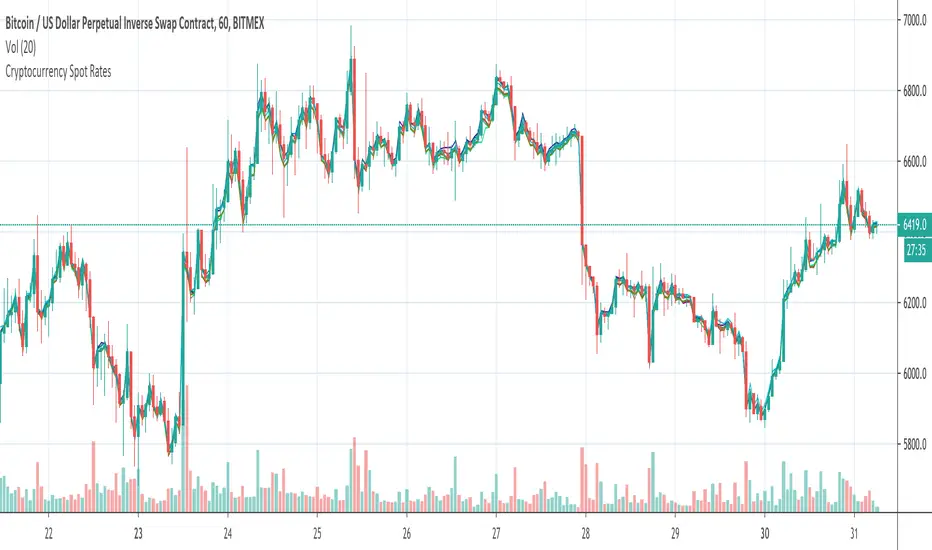
Cryptocurrency Spot RatesThis is an overlay indicator on the chart that will plot cryptocurrency spot prices of the following exchanges:
- Coinbase
- Poloniex
- OKCOIN
- Binance
- Huobi
- Bittrex
- HitBTC
- Kraken
- Bitfinex
Additionally it plots the price average of all those exchanges.
This overlay is intended to be used on charts with derivatives/futures such as BitMEX/Deribit/...
It works with all USD and Tether pairs on the main chart (for example BTCUSD, ETHUSD, BCHUSD,...)
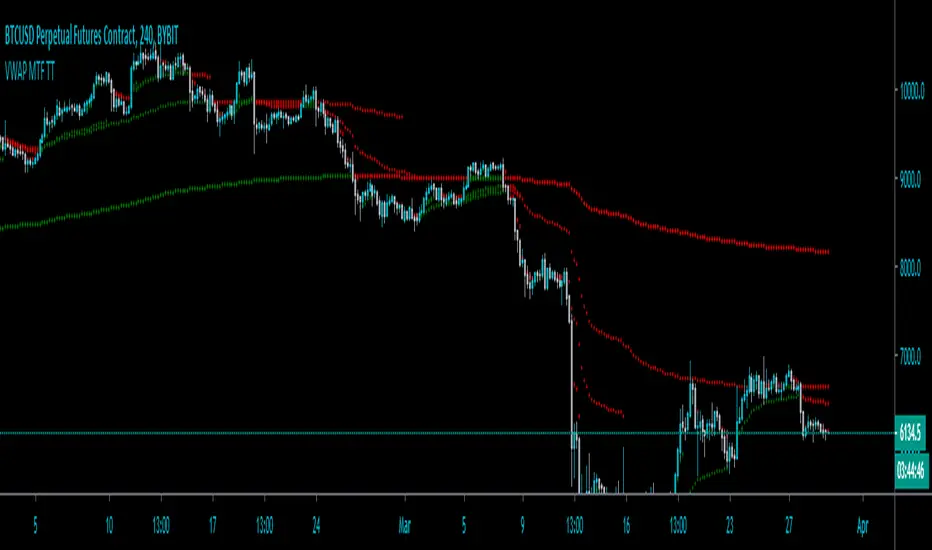
VWAP MTF TT by Chill00rThis is an "Volume-weighted Average Price" Indicator for Multi Timeframe.
VWAP color is trend-based
Different settings are available (some are off by default):
"Show Daily VWAP"
"Show Weekly VWAP"
"Show Monthly VWAP"
"Show Quarterly VWAP"
"Show Yearly VWAP"
"Show previous VWAP close"
Hit the Like Button
XBT % ContangoSimilar to my other indicators, but measures XBTUSD Contango in terms of percent.
Also, built it so you could change the values that give the red and green signals. Default values are 0% or less (backwardation) indicates green. However, i found that a 0.5% setting worked will finding local bottoms for current contract of XBTH20 (March 2020). The upper value default is at 5%, and signals red when the next contract reaches over 5%.
My assumption is as BTC increases in value over time, measuring contango in terms of percent will be a better measure of the XBT futures curve.

Ichimoku Clouds Strong Bullish/Bearish signals and alertsIchimoku Clouds Strong Bullish/Bearish signals with allerts
The Ichimoku cloud was developed by Goichi Hosoda, a Japanese journalist, and published in the late 1960s. It provides more data points than the standard candlestick chart. While it seems complicated at first glance, those familiar with how to read the charts often find it easy to understand with well-defined trading signals.
We provide you easy-to-use script which helps to decrypt meaning of lines in the indicator. The script takes Ichimoku clouds indicator formulas to calculate Tenkan, Kijun, SenkouA, SenkouB values and examines them in order to produce buy ( Bullish ) and sell ( Bearish ) signals which are displayed at the chart
The most appropriate time frame is 30m
Custom alerts are added to send you a notice with a webhook when bullish or bearish signal arrives.
You can easily add weak and neutral signals alerts by removing "//" in a specified place
Feel free to copy and use this script for your ideas and trading. You can modify the script by adding Parabolic SAR in order to increase accuracy of positions closure

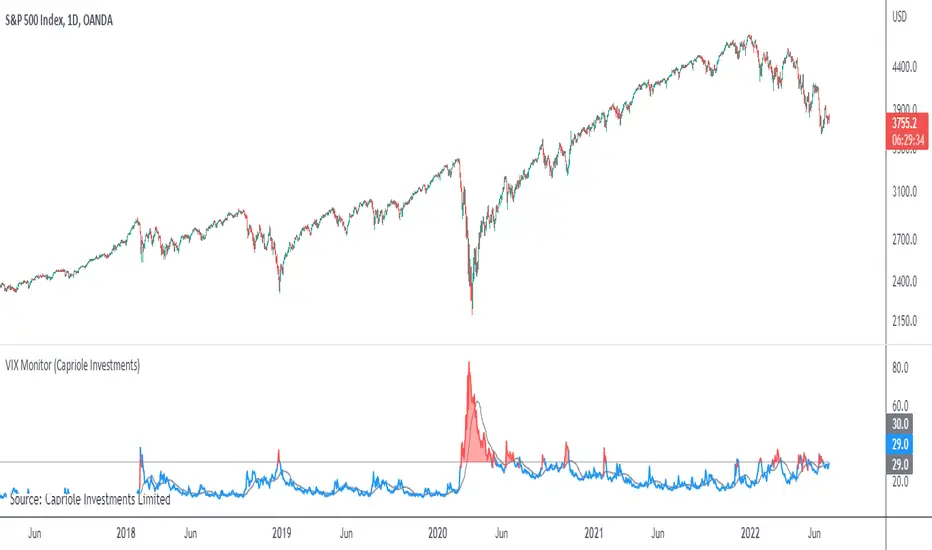
VIX MonitorSimple VIX Monitor to track spikes.
Spikes in VIX are often followed by big moves up in stocks.
Useful when paired with "Correlation & Beta" Indicator.
For Bitcoin Traders: when Bitcoin is highly correlated to Stocks (such as now) it could be a good opportunity for a short-term long trade.
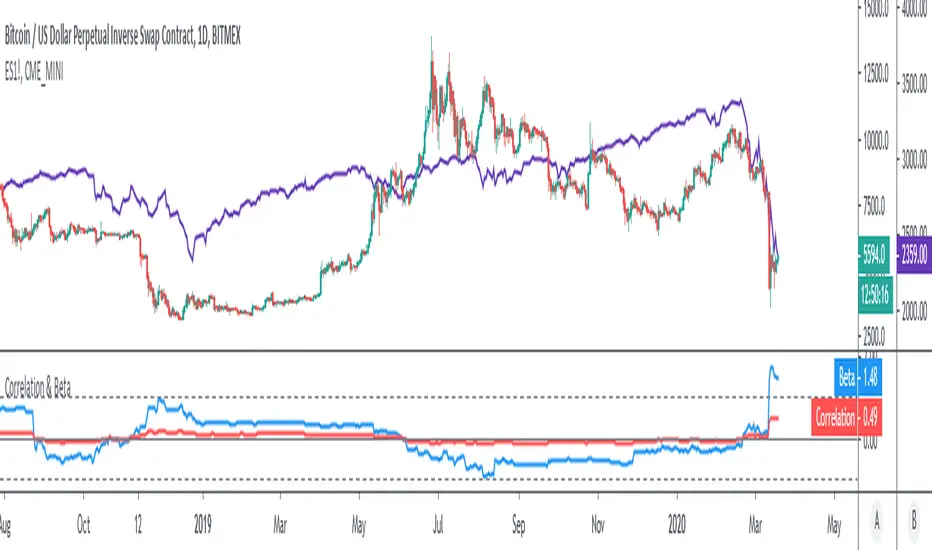
Correlation & BetaDisplay the correlation coefficient and/or Beta of an asset to a specified market.
Options to:
- Specify market (S&P500 futures by default)
- Display one or other metrics
- Modify assessment period (200 bars by default)
- Calculate on price, returns or log-returns
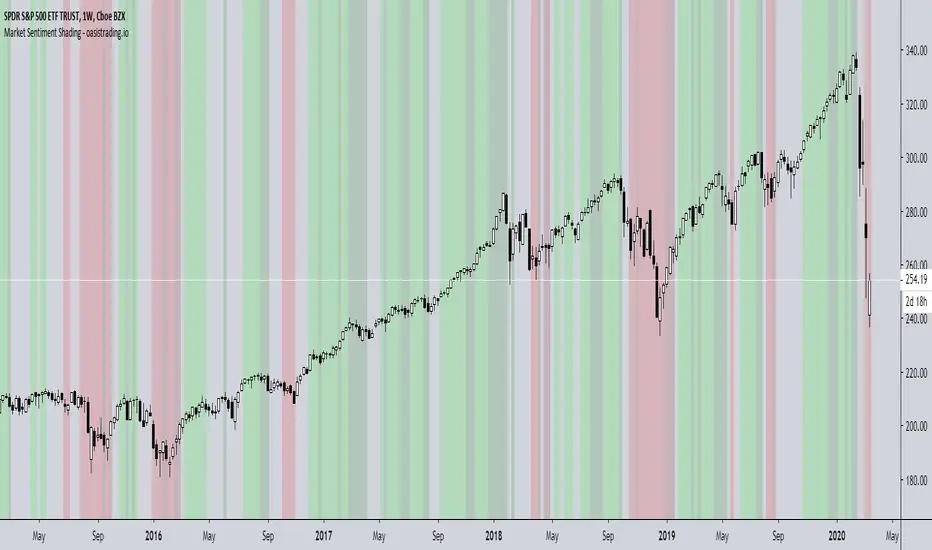
Market Sentiment ShadingThe Market Sentiment Shading Indicator shades the background of the asset based on signals from the DBT MoMo and Oasis Trading Suite. This indicator was designed to make it very obvious which direction the trend is moving and to keep the trader focused on following trend.
There are four different shades:
Dark Green = Bull
Light Green = Strong Bull
Dark Red = Bear
Light Red = Strong Bear
This is a free add-on indicator to traders with access to the DBT MoMo and Oasis Trading Suite and Bundle Package.
For Access or Questions: Private message us. Thank you.
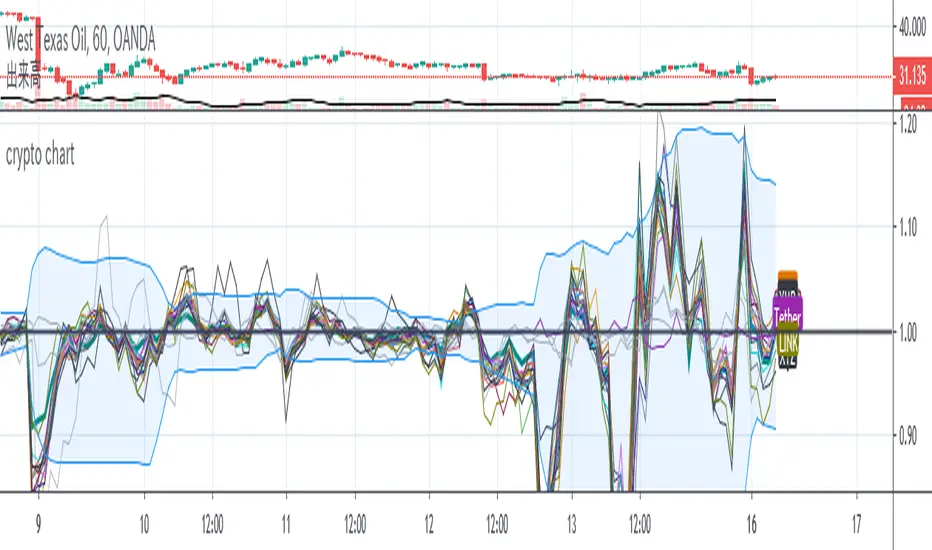
crypto chart BTC is often moved by other brands
This indicator to detect the precedence and enter BTC
Cuban's BTCUSD Spot Buying GuideI have been using a few different spreads to track market sentiment for $BTCUSD over the last 12 months, and has worked out very favourably.
Although it's a low sample size, I feel as the market has become more efficient, these signals have become more accurate. Obviously, alpha decay will slowly arb these out but I thought I would share this rough guide.
There are many ways you can use these buy opportunities. I recommend buying after waiting for the candle to flip white (from green), this will be accompanied by the text, 'SPOT'. However, aggressive entries can be taken by slowly averaging in while the candle colouring is green.
I have left out any take profit strategy, as I will leave this to the user.
Enjoy!

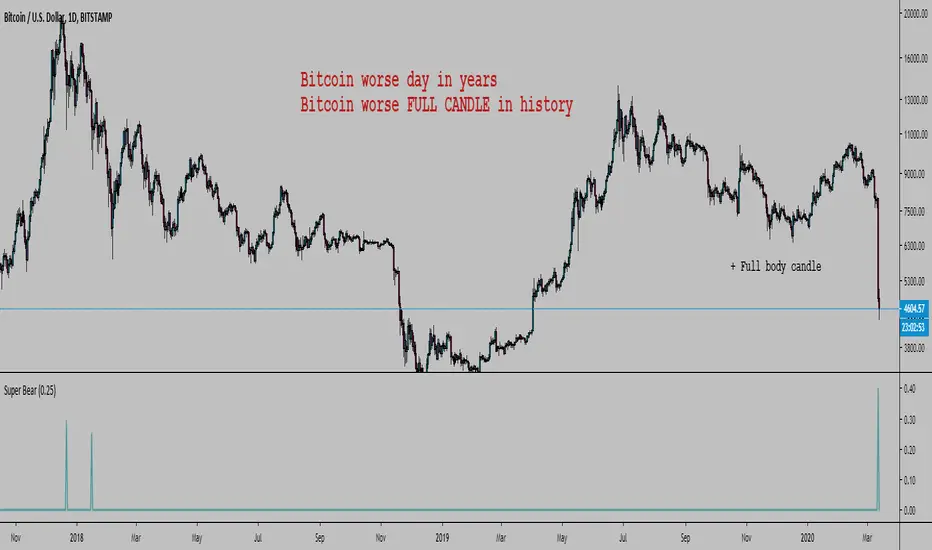
Bitcoin Worse DaysHello, here is a simple script to scan for BTC worse days.
In input you tell the script what are the minimum percent drops to look for.
By default it is 0.3, here I set it at 0.25 or it would not show anything except the 12 March (which is 40.07%).
The indicator has a precision of 1% I think.
It does not look at how low the body closed, it will show all days that closed below where they opened looking at how far below the high of the day the low was.
It can also work on any timeframe.
Here were the previous worse days from the late 2017 crash start of the bear market:
You could modify the script and look for the worse bodies with open - close instead of high - low
You could also add a filter to only look at days where the body is > 90% the whole candle (in this case it's got to be about 99%)
We can look back at BTC past a bit
Every bear market started with a large drop so we can expect...
As you can see we can look at the weekly chart too:
I won't lie, I am pretty happy. Russia, China bat eating community, and Greta were a big help. Thanks guys.