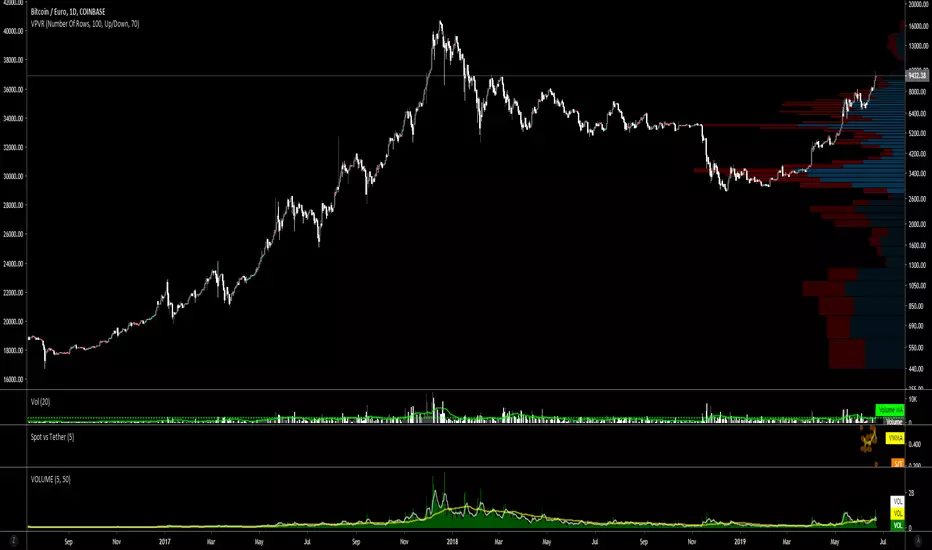
BTC Spot vs Tether Volumespot_volume / tether_volume
spot = Coinbase + bitFlyer + Kraken + Bitstamp
tether = Bitfinex + binance + Huobi + HitBTC
Btc!

Crypto Indicators #u9tusA set of low timeframe (LTF), medium timeframe (MTF), and high timeframe (HTF) indicators for use in crypto currencies / bitcoin.
Traditionally the 10, 20, 50, 100, and 200 SMAs are used in TA. With cryptos, I've found that the 8 EMA, 21, 55, and 128 SMAs backtest better, while no change in length was necessary for the 200. I wanted to combine all these into one indicator to easily add them to a chart layout, hence this script.
You can customize the length of each MA to your liking in the settings, or accept the defaults.
LTF Indicators:
8 EMA in blue hues, medium line stroke.
MTF Indicators:
21, 55 SMA in purple hues, medium line stroke.
HTF Indicators:
128, 200 SMA in yellow hues, thick line stroke.
Defaults are for daily timeframes and lower; suggest changing up the intervals for weekly and monthly to:
21 -> 30
55 -> 50
128 -> 100
$BTC, $ETH, #ALTS
twitter.com
(c) @jhaurawachsman 20190515


BTC Average Volume (Multi Exchange)Multi-Exchange BTC Volume: Bitfinex, Bitmex, Bitstamp, Binance, and Coinbase are included for now.

Bitcoin Number of TransactionsThe Bitcoin Number of Transactions plots the amount of transactions registered on-chain on a daily basis.

Bitcoin On-Chain VolumeThe Bitcoin On-Chain Volume is a reflection of the transactional volume registered in the blockchain.
The indicator can show the value either in BTC or USD.

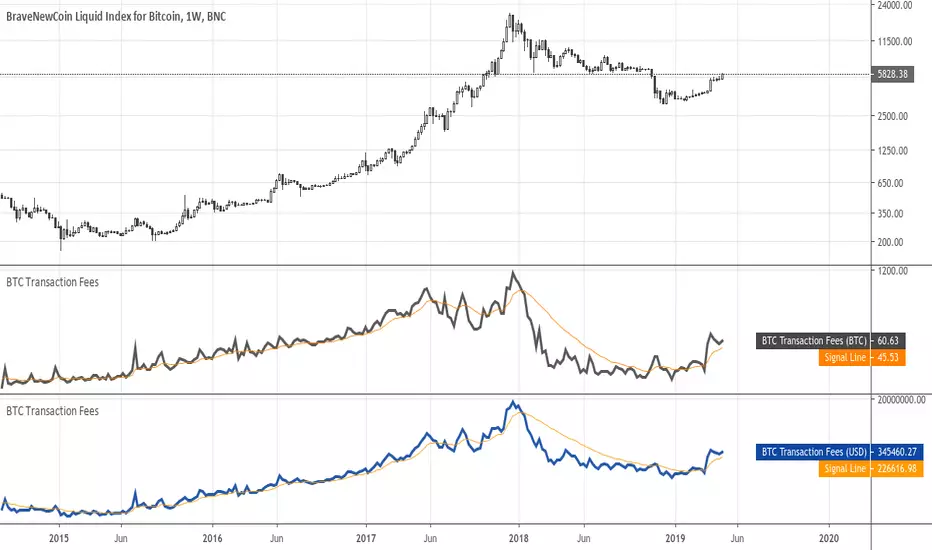
Bitcoin Transaction FeesThe Bitcoin Transaction Fees is the fee value that miners earn on a daily basis.
The indicator can show the value either in BTC or USD.
Bitcoin Cost of Transaction (%)The Bitcoin Relative Cost of Transaction shows the miners' revenue as a percentage of the transaction volume registered in the block.

Bitcoin Cost per Transaction (USD)The Bitcoin Cost per Transaction (USD) is the result of dividing the miners' revenue (Block Reward + Transaction Fees) between the number of transactions per block.
Here is an example with made up numbers:
Block reward is 12.5 BTC + 0.5 BTC in transaction fees.
There are 2700 transactions in the block.
Current exchange rate is 5700 USD/BTC.
(12.5 BTC + 0.5 BTC) / 2700 transactions = 0.00481481 BTC per transaction
5700 USD/BTC * 0.00481481 BTC per transaction = $27.44 per transaction
Hope that helps!

Bitcoin Number of Coins'Bitcoin Number of Coins' is the total number of Bitcoins which have been mined. This is the number of coins (technically) in circulation.
Additionally, the indicator shows the number of Bitcoin pending to be mined, considering a max cap of 21 million coins.


Bitcoin Block SizeThe Average Bitcoin Block Size refers to the size (in MB) of a container of bitcoin transactions.
Approximately every 10 minutes a new Bitcoin block is added to the chain.

Bitcoin Network DifficultyThe Bitcoin Network Difficulty is a measure of how difficult it is to find the next block, compared to the difficulty of finding the easiest possible one.
The easiest possible block has a proof-of-work difficulty of 1.

Bitcoin Hash RateThe Hash Rate is the amount of computing power securing the Bitcoin Network.
The value is expressed in TH/s. Therefore a read of 1,000,000 (one million) would equate to 1 EH/s.
Here's a cheatsheet to convert this value into other units:
1 kH/s is 1,000 (one thousand) hashes per second
1 MH/s is 1,000,000 (one million) hashes per second.
1 GH/s is 1,000,000,000 (one billion) hashes per second.
1 TH/s is 1,000,000,000,000 (one trillion) hashes per second.
1 PH/s is 1,000,000,000,000,000 (one quadrillion) hashes per second.
1 EH/s is 1,000,000,000,000,000,000 (one quintillion) hashes per second.
1 ZH/s is 1,000,000,000,000,000,000,000 (one sextillion) hashes per second.
Hope that helps!

RatTrend Multiple RSI Divergence MA Cross OscillatorThis Indicator based on RSI Divergence with Overbought and oversold signals.
All tops and bottoms calculated with Moving Average Crosses and combines with RSI signals.
Best working Timeframe is H4 on current settings, you can modify values to find best for you.
Current settings best for BTC trading.
At the beginning it can confuse you to understand but you will understand signal patterns.
Have fun.

2019- BITCOIN - BTFD -BANDS-60minAs long as BTC is in this uptrend,
We have identified the BTFD bands.
They are on the chart and part of this indicator.
When the Dip happens, turn on this indicator,
Use it on the hourly chart.
BTFD will appear when price is rejected by our BTFD Band.
This strategy indicator has worked since the beginning of BTC bullish turn in February
This indicator is set to expire in December 2019
ONCE BTC closes below our Green line on the hourly, this strategy can be deemed DEAD!
Thanks, BTFD Safely
Like this indicator?
Join our Discord, link in my Bio!

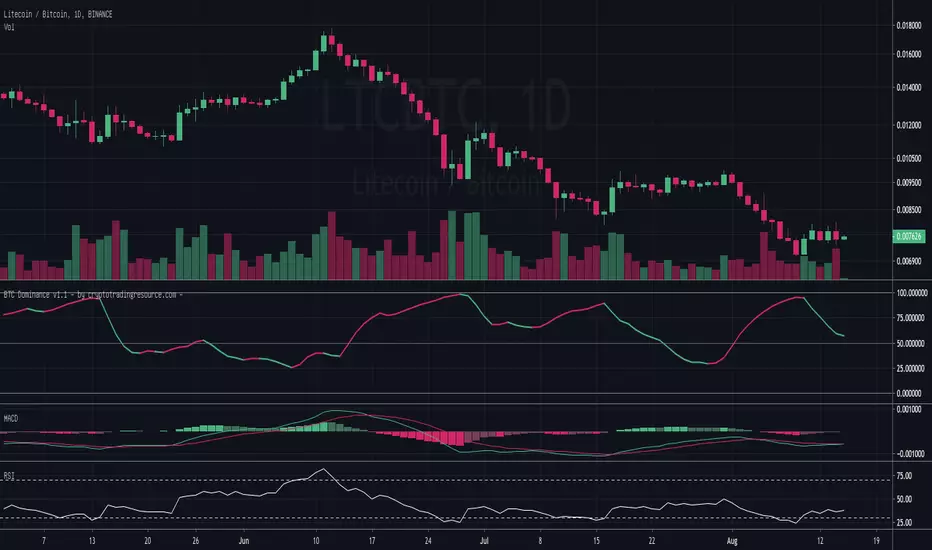
BTC Dominance - by @cryptomrdavis -Simple tool for your trading assets. Check the dominance from BTC agains other Alts and trade safe.
You can find a short description on the chart above.
Website coming soon: cryptotradingresource.com
Happy trading
+++ use this tool on your own risk. i'm not responsible for your loses. DYOR +++
____________________________________________________________________________
BTC: 1GVRDK3HHr9CKM5SF2CGpCNXFuavB3L4j9
ETH: 0x7b825fa752b9926D3E8397cDb1d9E5473D074646
XLM: GAXUQJSW55C7MAC4GI26NZUGIKSHFDVFRFKZCXPLMPY4HCADSDT55XK6
BCH: qz57n04ud6mn42u00aymqkku8tfh0lk4jv9c28mjvv
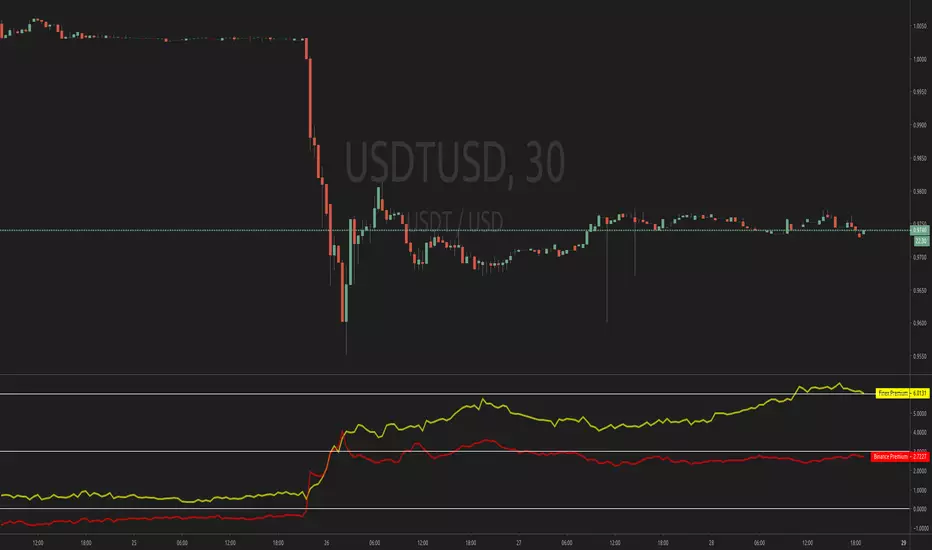
Finex PremiumThis is a simple script for the Bitfinex premium against Bitstamp
Easy to modify values
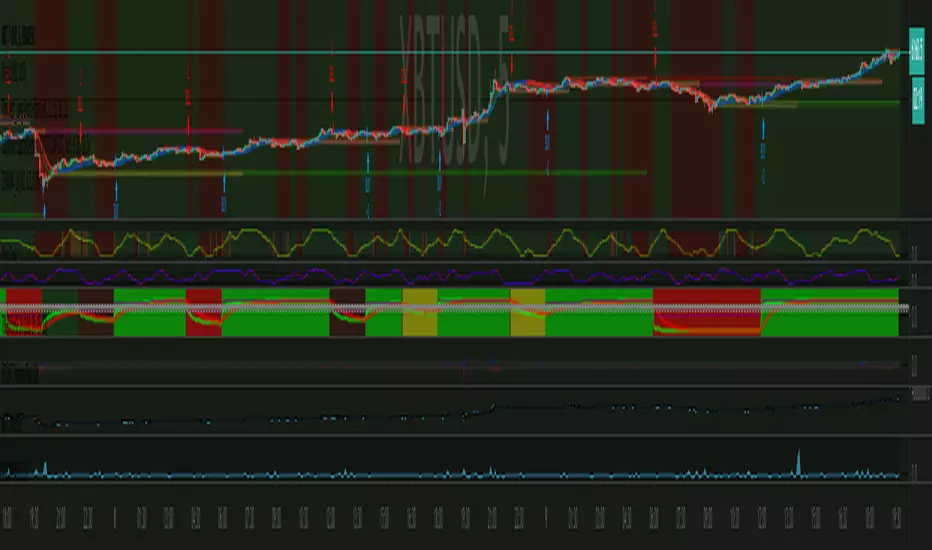
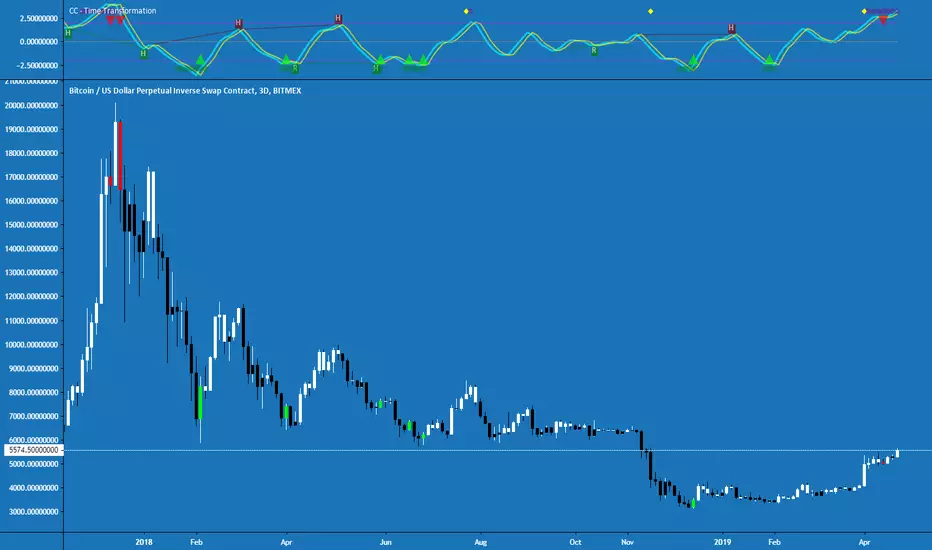
Cracking Cryptocurrency - Time TransformationTime Transformation is the creation of the Cracking Cryptocurrency Premium Trading Group . It's purpose is to provide volume , momentum, trend, and divergence at a glance. This limits the restrictions of a trader dramatically, by providing them with a powerful tool applicable on any asset, any time frame.
Momentum:
Time Transformation accurately interprets precise entry and exit positions in a ranging market via overbought and oversold conditions. When an asset is trending, these levels also indicate short-term exhaustion, and ideal profit taking levels.
These levels are completely customization, by adjusting the Cycle Length, and the boundaries of overbought and oversold itself. Also, with an advanced algorithm that calculates advanced price action, you can adjust this measurement for optimum results. One can even look at the momentum on a different time frame.
Trend:
Utilizing the power of Heikin Ashi to identify the dominant trend, this allows a trader to filter out the noise of Japanese candlesticks while still looking at their more accurate OHLC price information. Bars are colored pursuant to the dominant Heikin Ashi trend. One can also look at the Heikin Ashi trend of a higher or lower time frame to adjust the noise filtration.
Volume:
All traders know that we need volume for profitable movements. This indicator succinctly points out periods of unnatural volume , alerting a trader that a potential reversal or breakout may be occurring.
Divergence:
This Indicator understands fractal patterns of price action and oscillator movement. This allows for both Regular and Hidden divergence to be detected and displayed on the screen in real-time. One of the most powerful features of this indicator.
This Indicator boasts Multi-Time Frame features for both it's Momentum Oscillator and Trend Pattern Function, as well as fully adjustable settings for every function. Alerts are coded for every possible occurrence a trader could want.
Begin your journey towards market domination today. Allow this Indicator to Transform your Trading as it Transforms Time.
For access to this and all other Cracking Cryptocurrency Proprietary Indicators and Strategies, visit Cracking Cryptocurrency Premium Trading Group
Update Log:
-Adjusted default aesthetics to make Signal and Trigger Line more visible on a variety of backgrounds.
-Adjusted default aesthetics of zero line, overbought, oversold.
-Updated entire script to Pine Script Version 3.
-Updated Heikin Ashi Bar Recoloring Script - Will not re-paint, monitors the open and closing price and switches colors faster.
-Updated Input Setings for Multi-Time Frame feature. Much easier and more intuitive to select Time Frames from the drop-down menu.
-Simplified Input Settings, making them more intuitive.
-Updated Alert Messages to ease language barrier difficulties.
By Request: Added Alert Function for regular crosses.
Upcross = Fisher Crossing Over Signal Line.
Downcross = Fisher Crossing Under Signal Line.
Note that these are not buy/sell signals as per the Time Transformation strategy, as those crosses must occur in either overbought or oversold territory. :)
Anytime Plot 100EMA/1h for Bitcoin [akubi] Ver.2 常時1時間足100EMAを表示常時1時間足100EMAを表示してくれるインジケーターです。
仮想通貨、特にBTCペアの通貨は1時間の100EMAがレジスタンス&サポートとして意識されています。
仮想通貨をされる方は常時出しておきたいインジケーターの一つだと思います。
===============
以前あったものの改良版です。
・名称の変更
・合成シンボルにも対応
ということで、新規で投稿します。
===============

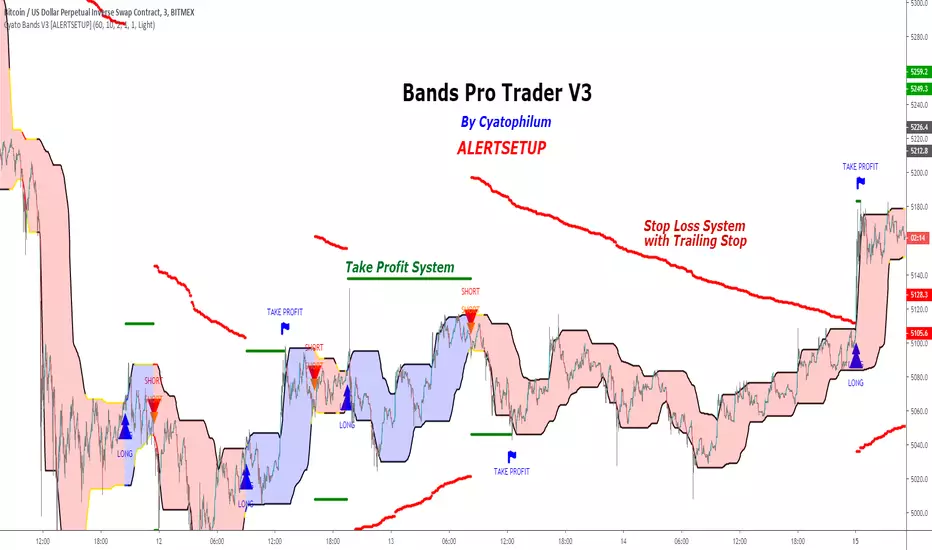
Cyatophilum Bands Pro Trader V3 [ALERTSETUP]An Original Automated Strategy that can be used for Manual or Bot Trading, on any timeframe and market.
>> Presentation <<
This script comes with a Backtest Version
How it works
No, these are NOT Bollinger Bands..
The Cyatophilum Bands are an original formula that I created. You will probably never find it anywhere else.
Their behavior is the following:
When they are horizontal it means the trend is going sideways and they represent supports (lower band) and resistances (upper band).
When they are climbing or falling it means the trend is either bullish or bearish and they represent Trend Lines.
The strategy enters Long on a Bull Breakout and enters Short on a Bear Breakout.
The exits are triggered either on a Trend Reversal, a Stop Loss or a Take Profit.
FEATURES
Take Profit System
Stop Loss System
Show Net profit Line
More features here
Finding a profitable configuration is GUARANTEED
0. Choose your symbol and timeframe. Then add the Backtest version to your chart. If at any time you decide to change your timeframe, go back to step 1.
1. Open the strategy tester and look at the buy & hold line.
If it is mostly climbing (last value greater than 0) then it means we are in a bull market. You should then opt or a long only strategy.
If it is mostly dropping (last value lower than 0) then it means we are in a bear market. You should then opt or a short only strategy.
Note : This first step is really important. Trading against the market has very little chances to succeed.
2. Go into the Strategy Input Parameters:
check "Enable Long Results" and uncheck "Enable Short Results" if you are in a long only strategy.
check "Enable Short Results" and uncheck "Enable Long Results" if you are in a short only strategy.
3. Open the Strategy Tester and open the Strategy Properties.
We are going to find the base parameters for the Bands.
The "Bands Lookback" is the main parameter to configure for any strategy. It corresponds to how strong of a support and resistance the bands will behave. The lower the timeframe, the higher lookback you will need. It can move from 10 to 60. For example 60 is a good value for a 3 minute timeframe. Try different values, and look at the "net profit" value in the Overview tab of the Strategy Tester. Keep the Lookback value that shows the best net profit value.
Then play with the "Bands Smoothing" from 2 to 20 and keep the best net profit value.
The "Band Smoothing" is used to reduce noise.
Usually, the default value (10) is what gives the best results.
From this point you should already be able to have a profitable strategy (net profit>0), but we can improve it using the Stop Loss and the Take Profit feature.
4. To activate the Stop Loss feature, click on the "SECURITY" checkbox
You should see horizontal red lines appear.
A Long/short exit alert will be triggered if the price were to cross this line. (A red Xcross will appear)
Choose the Stop Loss percentage.
On top of that, you can enable the feature "Trailing Stop". It will make the red line follow the price, at a speed that you can configure with the "Trailing Speed" parameter.
Now, sometimes a stop is triggered and it was just a fakeout. You can enable "Re-entries after a stop" to avoid missing additional opportunities.
5. To activate the Take Profit feature, click on the "TAKE PROFIT" checkbox
You should see horizontal green lines appear.
A Long/short exit alert will be triggered if the price were to cross this line. (A flag will appear)
Choose the Take Profit percentage.
A low takeprofit will provide a safer strategy but can reduce potential profits.
A higher takeprofit will increase risk but can provide higher potential profits.
6. Money Management
You can configure the backtest according to your own money management.
Let's say you have 10 000 $ as initial capital and want to trade only 5%, set the Order Size to 5% of Equity.
You can increase net profit by increasing the order size but this is at your own risk.
How to create alerts explained here
Sample Uses Cases
Use it literally anywhere
This indicator can be used on any timeframe and market (not only cryptocurrencies).
About the Backtest below
The Net Profit (Gross profit - Gross loss) is calculated with a commission of 0.05% on each order.
No leverage used. This is a long strategy.
Each trade is made with 10 % of equity from an inital capital of 10 000$. The net profit can be bigger by increasing the % of equity but this a trader's rule to minimise the risk.
I am selling access to all my indicators on my website : blockchainfiesta.com
To get a 2 days free trial, just leave a comment , thanks !
Join my Discord for help, configurations, requests, etc. discord.gg