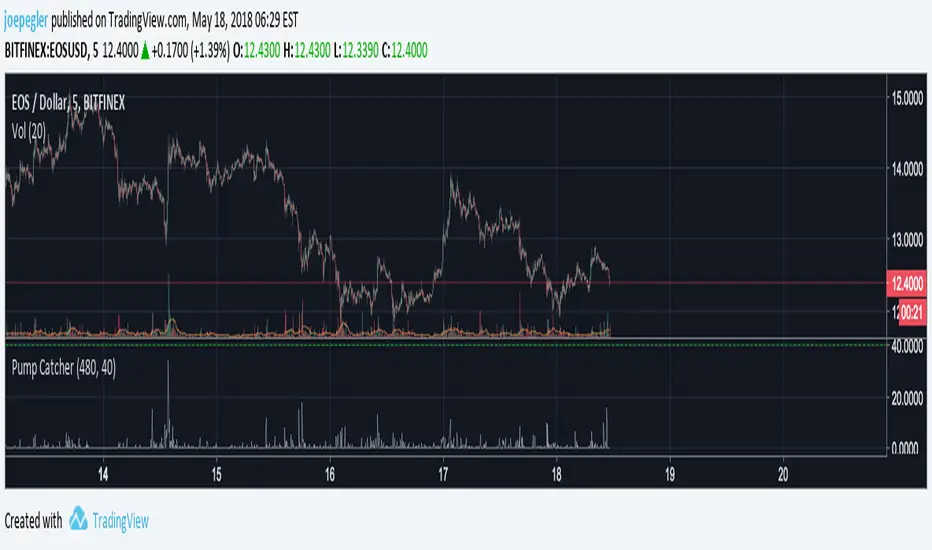
Pump CatcherThis indicator attempts to detect moments of abnormal and accelerating increase in volume. Because pumps happen over short time frames, this script is potentially better used on smaller timeframes (1 - 15 minutes). It takes two inputs: The length of the lookback for the volume rate of change (vroc) calculation (default=20), and The threshold over which a pump is determined to have happened (0-100, default=50). The vroc has been normalised to a result between 0 (no rate of change) and 100 (maximum rate of change the asset has ever undergone to date).
BTC-M
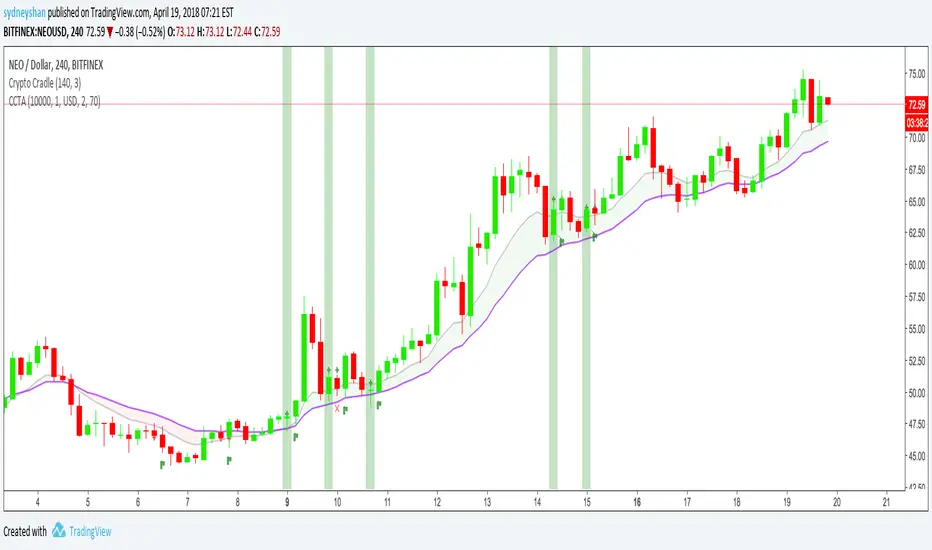
Crypto Cradle Trade AssistantThis indicator compliments the Crypto Cradle indicator by providing your entry, stop, 1:1 scale-out price, trade amount, and potential profit based on your target and scale-out strategy.
1. Ensure you have added the Crypto Cradle and Crypto Cradle Trade Assistant indicators to your chart
2. Click the cog icon to configure this indicator
3. Enter in your account balance and the % you are willing to risk on this trade (default: 1%).
3. Set your target price
4. Tweak the Trade Pair and Precision (Decimals) if required (USD/USDT only BTC & ETH coming soon)
5. Click on the 'Data Window' icon on the right-hand side of the screen and scroll down to CCTA
6. Hover over a highlighted crypto cradle candle (green for long, red for short) and a series of values will appear
Entry price
Stop price
1:1 scale out price
Amount to buy/sell (ie NEO)
Amount in traded currency (ie USD)
Target price (that you set)
Profit based on selling 50% of your bought amount when your reward equals your risk (1:1 scale-out)
Profit based on risking 1% of your portfolio
For more about the Crypto Cradle strategy, visit www.tradercobb.com
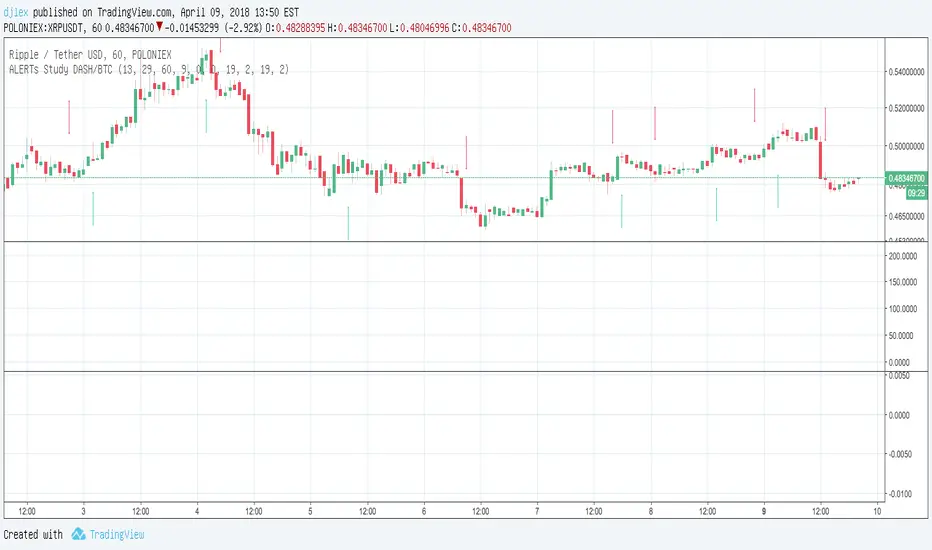
MACD Study DASH/BTC 3H ALERTS for AutoviewAutoview qualified Study Script Alerts for Autoview
Please Set Up Alert 1x Bars Close
For Margin Trading (Poloniex)
ULTIMATE PINE INJECTOR V1.2 INSERT
MACD Created by user ChrisMoody
NO REPAINT
With Stopp Loss and Trailing Stopp and Backtest
Now is for Free for all !
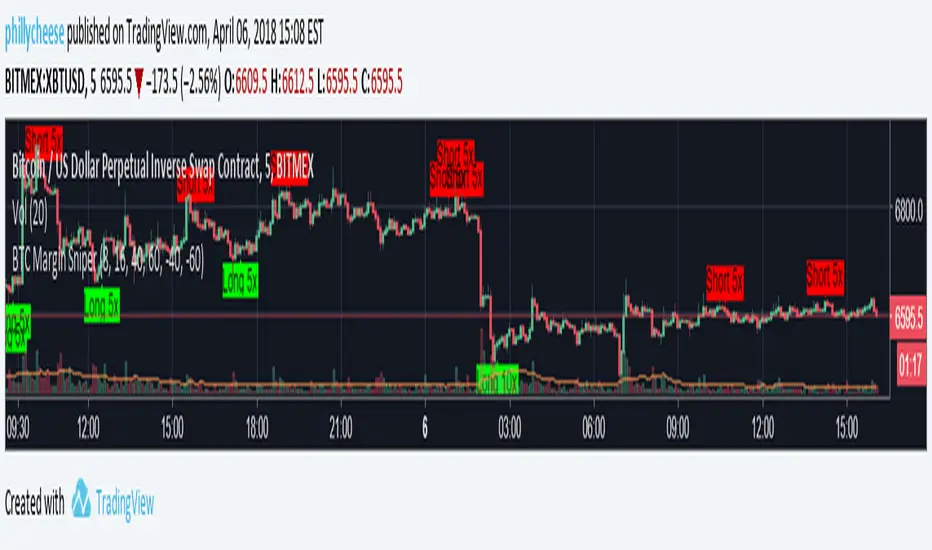
BTC Margin Sniper w/ AlertsMargin Sniper uses 2 levels for overbought and oversold to overlay possible trades on the chart. You can adjust its sensitivity by either increasing or decreasing the overbought and oversold threshold numbers. It must meet one of these levels and the short-term trend has to change direction for it to create the alert and entry on the overlay.
Increasing the overbought input makes the trigger more precise, but it may not trigger as often. Decreasing the oversold input will do the same for that trigger.
You can adjust the alerts and the overlaid position suggestions to match your preferred leverage amount.
To set an alert, click "add alert", then select this script. Choose one of the oversold or overbought alerts and enter your message.
I primarily use this on BitMEX with BTC, but you can use it with other exchanges and coins. You may have to adjust the inputs depending on the coin and the timeframe you use. Do not blindly follow this to make purchases. This is just an alert system to notify you of possible trades.
BTC World Volume (Multi-Exchange)Release: 2018-03-29
__________________________
WHAT IT DOES
Bitcoin is listed on multiple exchanges. Many people have called for a single global index that would quote BTC volume across all exchanges: this script is such a virtual volume aggregate of the 17 largest fiat exchanges on TradingView (listed in the script comments, and in Format > Inputs for you to select). It includes USD, EUR, JPY, KRW and USDT sources.
It will, independently for each tick, quote the volume from all selected exchanges and display a stacked representation, freely inspired from CoinMarketCap charts; also a Moving Average. Each fiat/continent has its own general color, to be able to quickly glance at where volume is coming from, e.g. BitMEX or Asia. (colors are based on Google's Material Design).
By default:
Grey: BitMEX
Green: USD
Yellow: Tether (USDT)
Red: Asia (JPY, KRW)
Blue: Europe (EUR)
No more "on Coinbase this" or "on Bitstamp that", you've now got a global overview! It becomes easy to debunk a few common myths.
See CoinMarketCap for reference.
Note: Bitmex is not taken into account in CoinMarketCap (afaik) since it's trading a derivative asset (XBTUSD contracts), but it usually amounts to ~50% of the overall BTC volume in USD value. The 16 other exchanges quote their volume in BTC, and they represent 30~40% of the overall BTC volume. I believe the whole is good enough to smooth out exchanges variations, and get a fair representation of real-time activity.
__________________________
HOW TO USE IT
Just add it to your chart, it will appear as a separate indicator. By default, it appears as stacked colored "areas". There is also a total volume Histogram, which is transparent by default: you can tweak that in Format > Style.
The darker and lighter backgrounds are respectively indicative of a downward price candle (open > close), or an upward price candle (close > open). They are unrelated to volume and simply help interpreting the indicator.
You can check/uncheck exchanges in the Format > Inputs tab to remove/add some of them from computation. All are enabled by default.
You can check/uncheck exchanges in the Format > Style tab to hide them (usually you would hide all or none).
You can edit colors and transpareny as well for each exchange.
You can edit "Volume histogram" transparency to have it show (it's a simpler representation than areas).
Moving Average: You can select the type (SMA, EMA, DEMA or TEMA) and length.
__________________________
Please leave feedback below or pm me directly for bugs and suggestions.

BTC World Price: Multi-Exchange VWAPBTC World Price: Multi-Exchange VWAP
__________________________
WHAT IT DOES
What you see above are not Bitmex candles, but this indicator's.
Bitcoin is listed on multiple exchanges. Many people have called for a single global index that would quote BTC price and volume across all exchanges: this script is such a virtual aggregate (formerly: Multi-Listed , Volume-Weighted Average Price ).
It will, independently for each tick, for any time-frame:
- Quote the price (O, H, L, C) and volume from Bitfinex (USD), Binance (USDT), bitFlyer (Yen), Bithumb (S. Korean Won), Coinbase (USD), Kraken (EUR) and even Bitmex (USD Contracts).
- Weight each price with the corresponding volume of the exchange.
- Quote the FOREX conversion rate in USD for each currency (USDJPY etc.)
- Finally return global average price (candles) in USD.
- Additionally provide (H+L)/2 etc. values.
No more "on Coinbase this" or "on Bitstamp that", you've now got a global overview!
See CoinMarketCap: Markets for reference. I've included alternative exchanges in the comments at the top of the script.
__________________________
HOW TO USE IT
Basically just add it to your chart and use the indicator's candles instead of the chart's main ticker.
By default, BTC World Price will display candles only, but you can also display OHLC & averages (in whichever style you want).
You may indeed want to hide the main symbol (top-left corner, click the 'eye' button next to its name), or switch it to something else than candles/bars (e.g. line).
Make sure "Scale Price Chart Only" is disabled if you want to use the auto-zoom feature. (if other indicators are messing your zoom, you can try to select "Line with Breaks" or "Area with Breaks" to allow these to overflow from the main window)
By clicking the triangle next to the indicator's name, you can select "Visual Order" (e.g "Bring to Front").
You can select regular Candles or Heikin-Ashi in Options.
In the Format > Inputs tab, you can select which exchanges to quote. By default, all of them are enabled.
The script also exposes the following typical values to the backend, which you can use as Price Source for other indicators: (e.g. MA, RSI, in their "Format > Input" tab)
Open Price (grey)
High Price (green)
Low Price (red)
Close Price (white)
(H + L)/2 (light blue)
(H + L + C)/3 (blue)
(O + H + L + C)/4 (purple)
They are all hidden by default (by means of maximum transparency).
In the Format > Style tab, you can change their color, transparency and style (line, area, etc), as well as uncheck Candles and Wicks to hide these.
If you are using "Indicator Last Value" and want to clear the clutter from all these values, simply uncheck them in Style. They will still be available as Price Source for other indicators.
You can also choose to scale it to the left, right (default) or "screen" (no scaling).
Once you're satisfied with your Style, you may click "Default"> "Save as default" in the botton-left. Everytime you load the indicator, it will look the same. ("Reset Settings" will reset to the script's defaults)
__________________________
Please leave feedback below in comments or pm me directly for bugs and suggestions.

BTC CorrelationA simple script to display how correlated the current ticker is to Bitcoin.
Inputs are the number of bars to check correlation for (default 10) and the the ticker to use for BTC comparison (default is BITFINEX:BTCUSD)
Values of 1 are highly correlated (i.e. bitcoin moves up, so does your current ticker), values of -1 are inversely correlated (i.e. bitcoin moves up, your current ticker moves down).
See: www.babypips.com for some more details on correlation

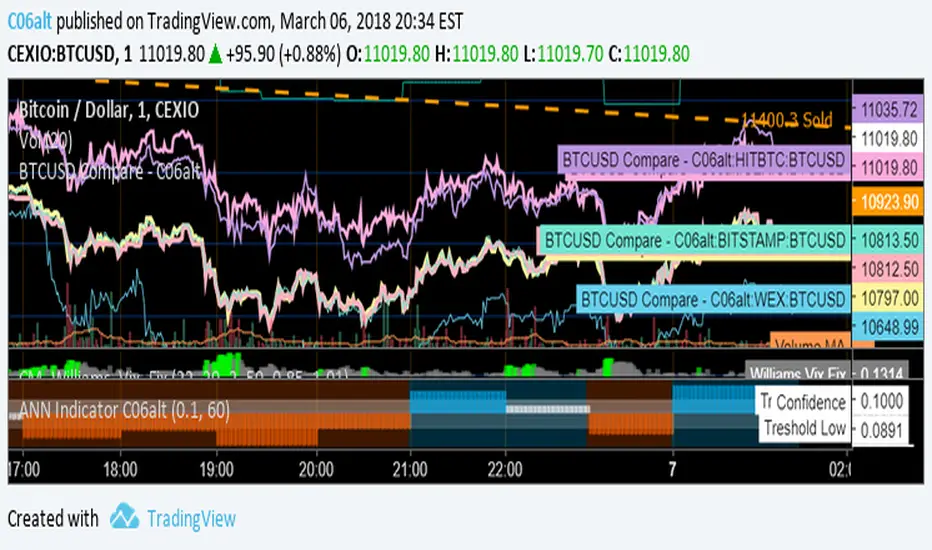
BTCUSD Compare - C06altThis Indicator allows for quick comparison between the BTCUSD exchange closing prices.
btc fractal history by @cryptoshebadds btc price history for observation of fractals in price action. default settings overlay 2013 btc bubble on 2017 btc bubble to show striking similarity between the two.

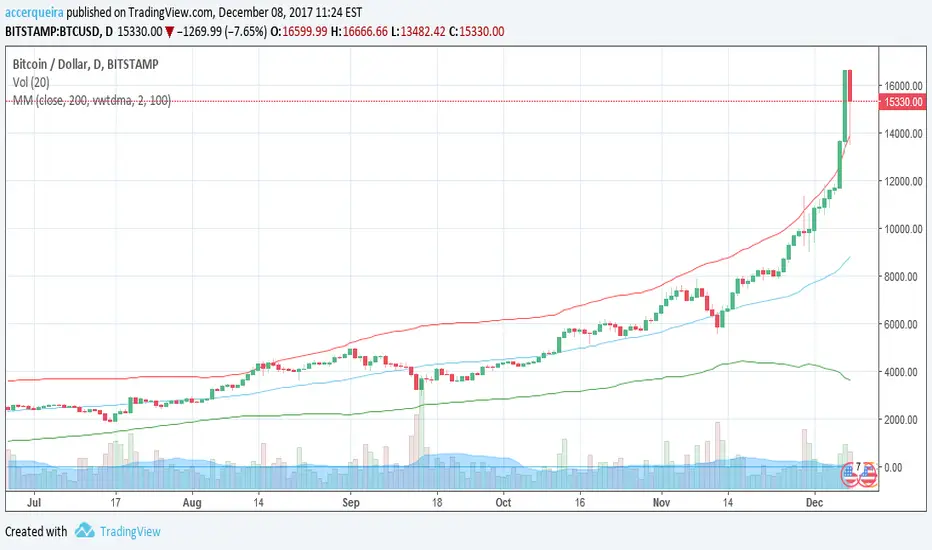
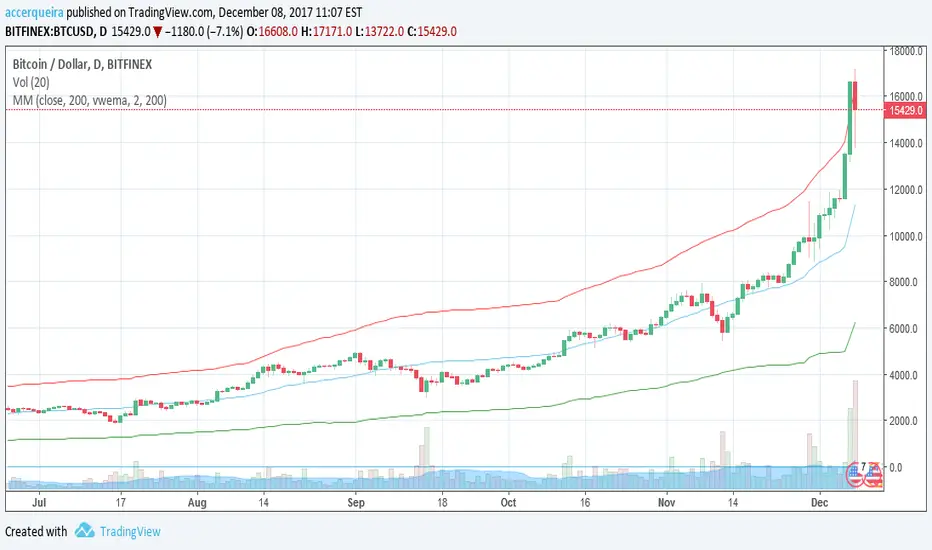
Multiple Moving AverageSuper simple script integrating three moving averages within only one script. It's going to help you to keep your chart cleaner while saving two spots for other indicators you may like. Try it out and let me know what you think.
A possible trading strategy:
Buy/Sell crossover of the MAs. Buy/Sell when fast MA crosses medium MA, double down when medium MA crosses slow MA.
Combining trading strategy is always a good idea.

RSI vs. BTC RSIThis script compares RSI of the underlying asset vs. BTC RSI. By comparing vs. BTC, it help inform your trades when looking for divergences.

MayerMultiple StochasticThis is an stochastic chart of Price adjusted Mayer Multiple Average Delta.
Moving Average Function can be selected from a list with standard functions and following experimental extras:
- Volume Weighted Exponential Moving Average
- Volume Weighted Time Decayed Moving Average // similar to vwema, but alpha is calculated from length as half-life decay function (not sure if I got that right...)
Default MA function is sma, to keep it true to the original MM indicator, but I think VWEMA and VWTDMA may perform better with exponential nature of Bitcoin .
See also:
Suggestions and bug reports are welcome =)

MayerMultiple Price BBThis charts an indicator created by Trace Mayer with some extras.
Plots:
- Mayer Multiple (may be hard to notice, since it overlays by default and stay at the bottom...)
- Price adjusted by Mayer Multiple Average with Bollinger Bands
Moving Average Function can be selected from a list with standard functions and following experimental extras:
- Volume Weighted Exponential Moving Average
- Volume Weighted Time Decayed Moving Average // similar to vwema, but alpha is calculated from length as half-life decay function (not sure if I got that right...)
Default MA function is sma, to keep it true to the original MM indicator, but I think VWEMA and VWTDMA may perform better with exponential nature of Bitcoin .
Suggestions and bug reports are welcome =)
MayerMultiple Price BBThis charts an indicator created by Trace Mayer with some extras.
Plots:
- Mayer Multiple
- Price adjusted by Mayer Multiple Average with Bollinger Bands
Moving Average Function can be selected from a list with standard functions and following experimental extras:
- Volume Weighted Exponential Moving Average
- Volume Weighted Time Decayed Moving Average // similar to vwema, but alpha is calculated from length as half-life decay function (not sure if I got that right...)
Default MA function is sma, to keep it true to the original MM indicator, but I think VWEMA and VWTDMA may perform better with exponential nature of Bitcoin .
Suggestions and bug reports are welcome =)
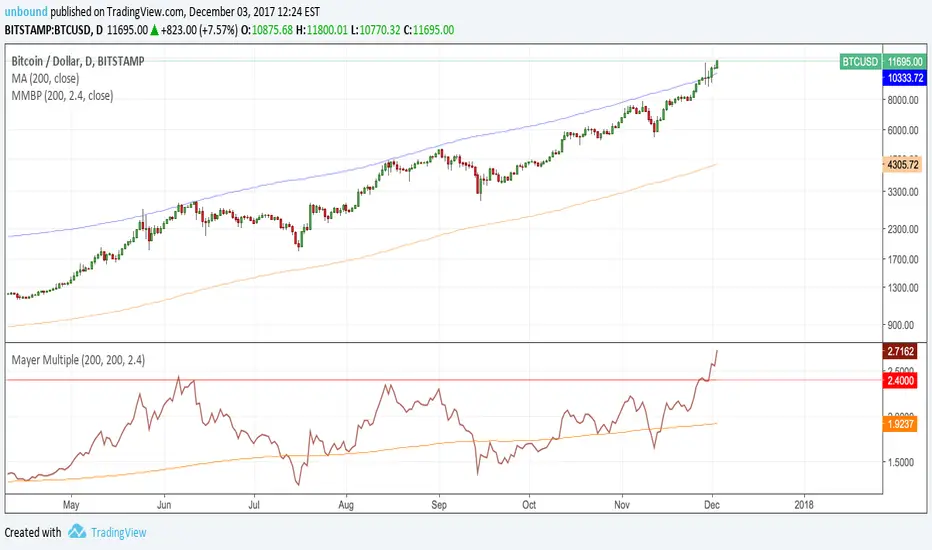
Mayer Multiple v2.0 - Klahr ThresholdThis is a simple update to the Mayer Multiple script by Unbound , which charts an indicator created by Trace Mayer and popularized by Preston Pysh.
The original post identified any price below 2.4x the 100-day MA as the BTC buy threshold. While the logic there is historically sound, it does not account for the fact that the BTC trend is parabolic in nature. With that in mind, I've attempted to update the 2.4x multiple to react based on the moving average of the Mayer Multiple itself. To do so, I simply found the number that, when added to the MM moving average, historically hit the 2.4x multiple during periods of low volatility. This turns out to be 1.17.
The green line represents the Klahr Threshold (is it obnoxious if I call it that? I've always wanted an indicator named after me). As you can see from the above chart, it hovers around 2.4x in late 2012 to early 2013, rises above it until mid 2014, and then stays below until 2016. It then stays almost exactly at 2.4x until April 2017, when it rises significantly above it for the first time since July 2014. The convergence in late 2012 and 2016-2017 is what leads me to believe that this should be the basis for the updated threshold.
It's entirely possible that there's a more robust method of calculating a reactive threshold (or a different number that should be added to the multiple's MA), but I think this is a good first step in refining the multiple to withstand the test of time.

Mayer MultipleFollowing Preston Pysh's "Bitcoin Mayer Multiple" study, I made this simple script to plot the Mayer multiple by calculating the ratio between bitcoin price and its 200-day moving average. It also plots the moving average of ratio itself.
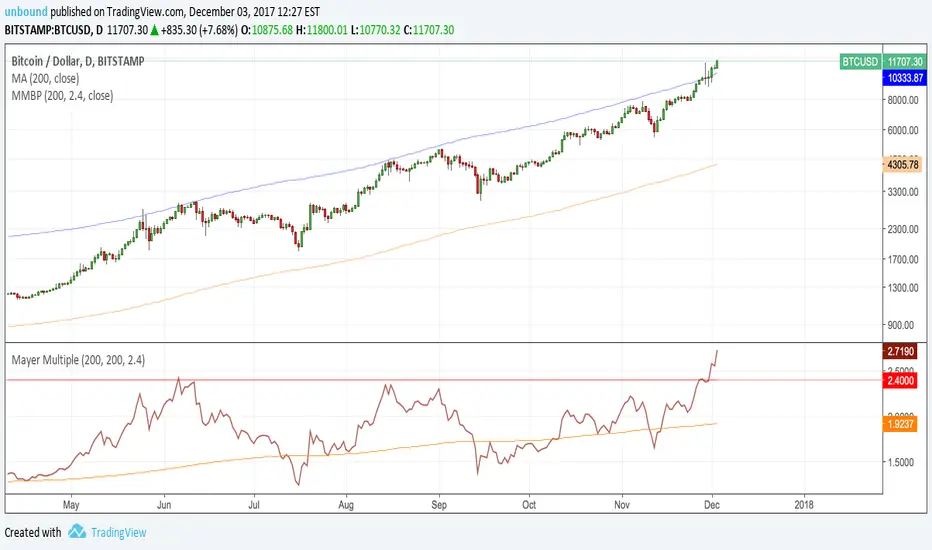
Mayer Multiple Buy PriceFollowing Preston Pysh's "Bitcoin Mayer Multiple" study, I made this simple script to plot the recommended buy price based on the calculated 2.4x ratio between bitcoin price and its 200-day moving average. The ratio and SMA length have default values of 2.4 and 200 and can be adjusted.
BTC Buy Sell Guide (BSG) - MA & RSIhi BTChes,
green is when the price drops below the 100 day MA
red is the intensity of the 14 day RSI
BUY @ green
SELL @ the second or third RSI spike
most importantly, keep in mind fundamentals :)
-joie
BCH / BTC Domination Correlation - FINEXBlue Line shows the BCH dominance of a particular BTC price move.
Blue is fast, orange is slow
This version is the oscillator script of a 2-in-1 overlay + oscillator depending on which plots are enabled.
Use with "Actualized BCH+BTC Price Persistence BITFINEX" - the overlay version of this script.
SNOW_CITY

BTC Volume in FiatThis indicator shows volume in Fiat. You will get wierd numbers if you use it on non BTC-FIAT pairs.

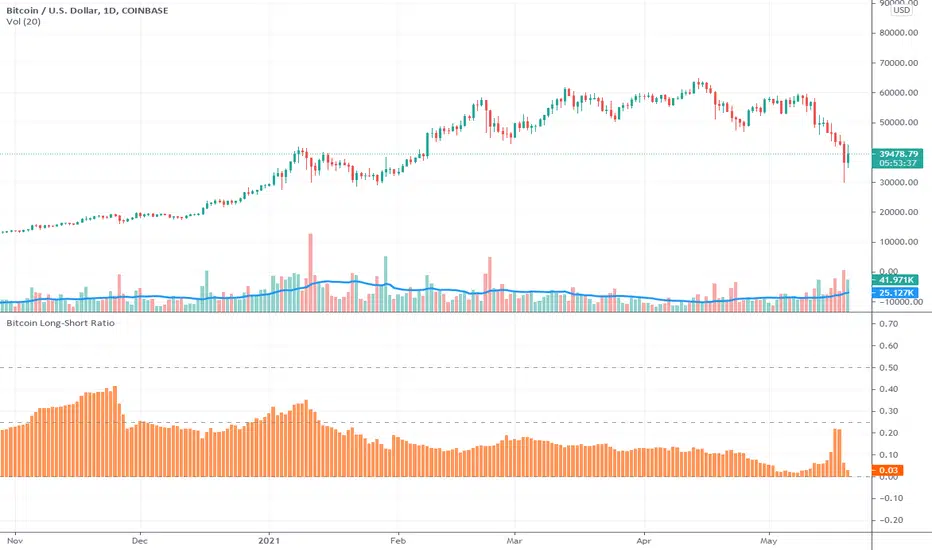
BFXLS - BitFinex Long/Shorts
Small improvement upon the above script - all credit should really go to pigloo
Auto-detects ticker and automatically loads the long/shorts for it - so works on more than just BTC
Note - only works on BitFinex and only works for tickers which have long and short data available!
Green area = Longs
Red area = Shorts
Lighter area = Longs - Shorts
