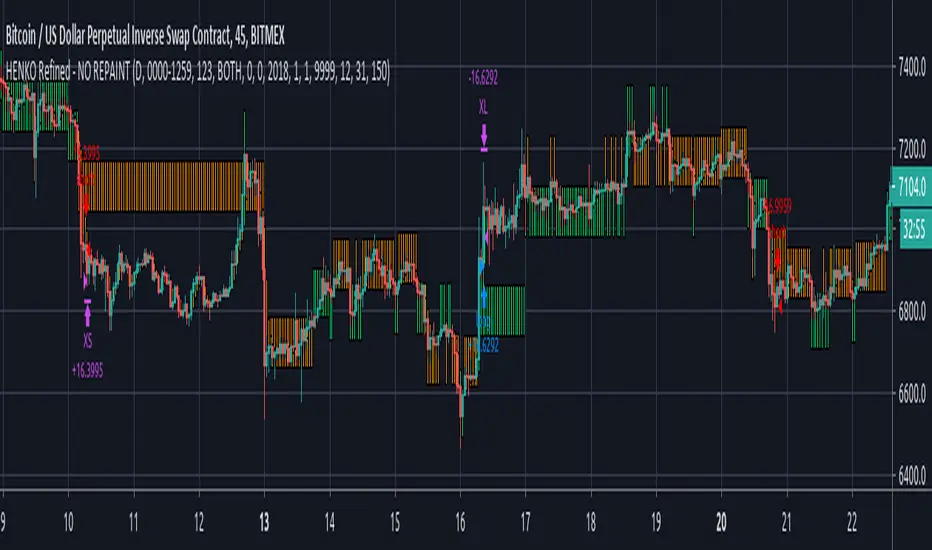
HENKO (Renko + HeikinAshi) -- No RepaintThis particular work is completely mine.
I have not used anyone else's code (not even a fragment).
Parts of the code are used from Open Source library linking to www.investopedia.com and TradingView's example section at www.tradingview.com
The above sources have been used to get Custom Heikin Ashi Candles.
Calculations on Renko bars is completely on me as I have used Daily close and open values to build my own Renko Candles.
Custom Bricksize for Float values has been made available in this public version.
I take no responsibility for the performance of this indicator as I have completely turned off the Repainting in this version of my script.
I am publishing the script for Public use.
I'll be releasing updates for this script in future as the performance is somewhat acceptable.
Profit Factor will decrease with bigger backtest data.
NO REPAINTING issues shall be reported at all costs as the tradingview's default Time based renko has been completely discarded, thus making it rely on its own.
Be advised that as the Renko Bars are calculated at 00:00 UTC, you're not supposed to mess with the timing in the script, unless you're working with Stock markets where it is important that you set your day start and end precisely.
You can play with the Brick Size to see what's more beneficial for you.
No Repaint RENKO
NOTE:= PERFORMANCE OF THIS INDICATOR DEPENDS UPON THE BRICKSIZE OF RENKO BARS.
BTCUSD
QuantNomad - Significant Pivot Reversal StrategyI'm working on improving the Pivot Points Reversal Strategy.
As one of the ways to filter out insignificant levels I decided to check that pivot point is not above/below neighbors, but check that it's above/below at least by a certain amount.
I use ATR, so in params, you can set length of ATR and also ATR multiplier. The new level will be calculated only if PP will be above/below neighbors by atr * atr_mult.
It seems this approach might help in some cases.
Here I have PivotPoint + RSI strategy:
QuantNomad - EVWMA Cross StrategyPretty simple EVWMA (Elastic Volume Weighted Moving Average) Cross Strategy. Long on bullish cross, Short on Bearish Crosss.
EVWMA is a quite interesting moving average where period of the MA is defined from volume itself.
It incorporates volume information in a natural and logical way. The eVWMA can be looked at as an approximation to the average price paid per share.
As a volume period you can use sum of the last x bars volumes.
Here is EVWMA as an indicator:

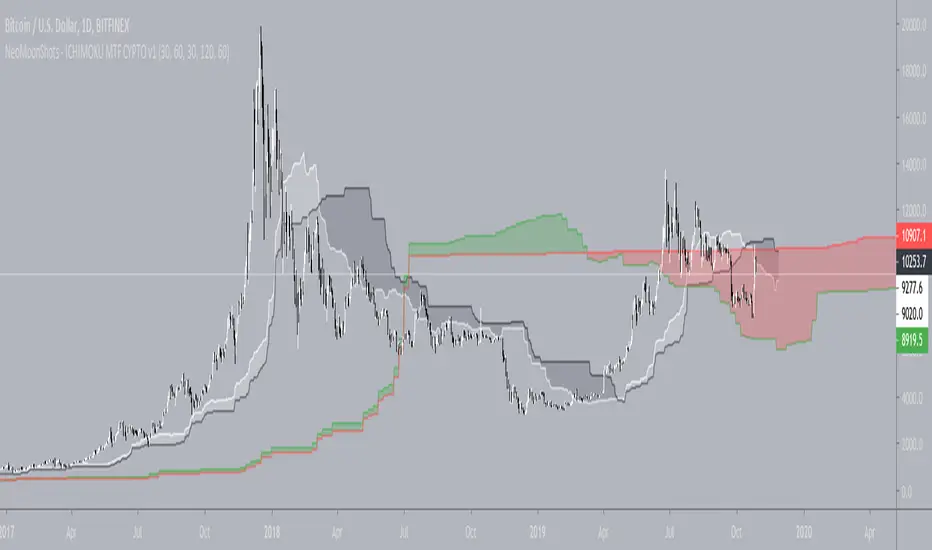
NeoMoonShots - ICHIMOKU MTF CYPTO V1Ichimoku cloud study to support multiple time frame (TF) at any given TF.
Supported TFs are:
1. 1 Hour
2. 4 Hour
3. Daily
4. 2Days
5. 3Days
6. Weekly.
Infopanel to show SenkouSpan A and B levels.
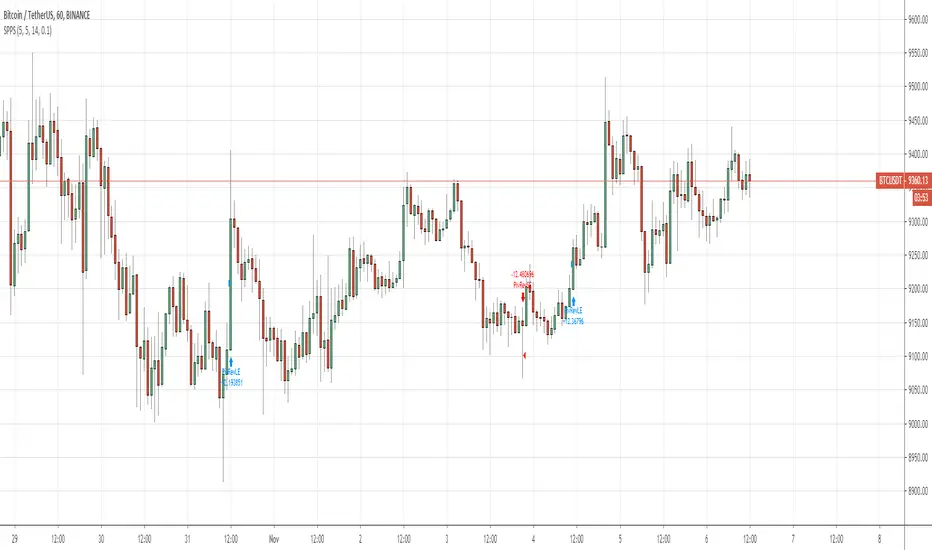
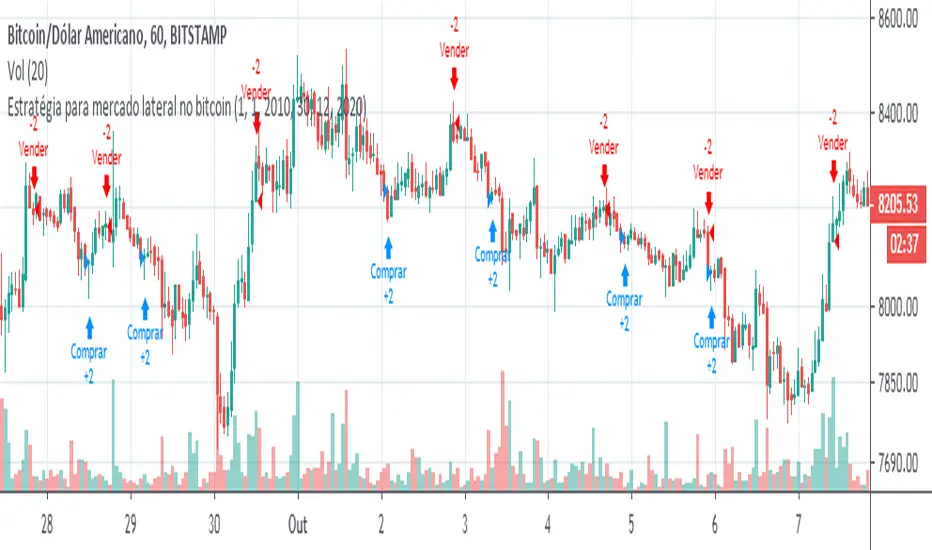
Strategy for trading in the side market on the BTCUSD one-hour cThis strategy is designed to make money in the bitcoin / dollar side market.
OBS: Only use this strategy if the market is lateral or to trade against the trend. Do not use this strategy to operate in favor of the trend!
Instructions:
- Only use this strategy if the market is moving sideways!
- When it appears "buy" buy;
- When "sell" appears, sell od bitcoins;
- Operate on the hourly bitcoin / dollar chart.
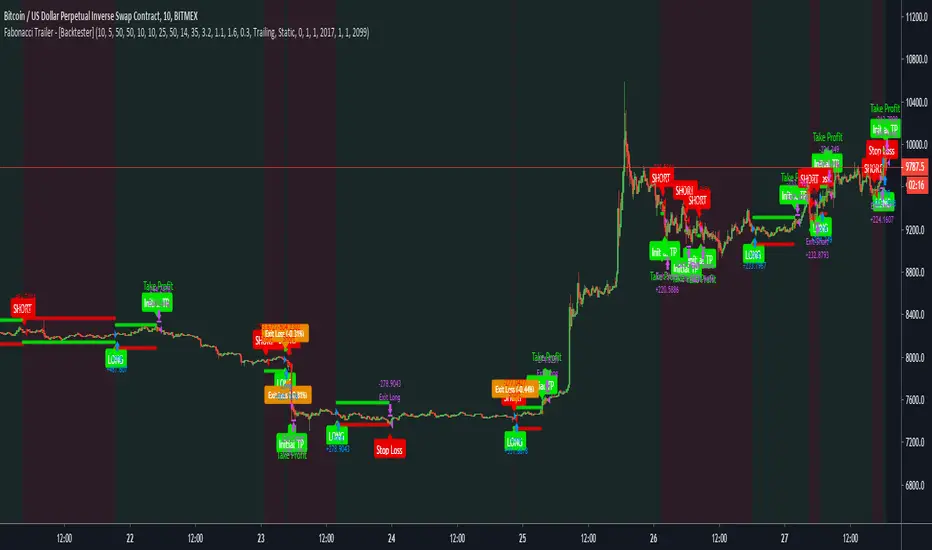
Fabonacci Trailer - [Backtester]This study comes with the following indicators and features:
ADX indicator
Chop indicator
Super Trend indicator
Trailing Take Profit and Stop Loss
Entry, Take Profit, and Stop Loss Alerts
Renko chart support
And a few more indicators in the back-end to increase accuracy and optimize entries
The study version with all alerts can be found in my profile. It is not repainting and we advise to use alerts on “Once Per Bar Close”.
Please note that this script is based on invite only.
Fabonacci Trailer - [Alerts]This script comes with the following indicators and features:
ADX indicator
Chop indicator
Super Trend indicator
Trailing Take Profit and Stop Loss
Entry, Take Profit, and Stop Loss Alerts
Renko chart support
And a few more indicators in the back-end to increase accuracy and optimize entries
This script works really well as a scalper on lower Time Frames as well as on higher Time Frames. Besides that you can also use it on pretty much any coin or asset.
This script is not repainting. We advise to use alerts on “Once Per Bar Close”.
If you’d like to automate this script you can do that by using AutoView, ProfitView, ProfitTrailer, CryptoHopper etc.
Please note that this script is based on invite only.

MA Crossover [Alerts]This is a Moving Average Crossover study .
The study comes with all alerts (Long, Short, Take Profit, and Stop Loss).
A few visuals like Exit Loss and Profit/Loss Boxes have been added as well.
The following Moving Averages are supported:
SMA
EMA
DEMA
TEMA
WMA
VWMA
SMMA
HullMA
LSMA
ALMA
SSMA
TMA
ZLEMA
If you’d like to automate this script you can do that by using AutoView, ProfitView, ProfitTrailer, CryptoHopper etc.
Feel free to leave a comment and share it with your friends. Enjoy!

True Trend BTC (Conquer Trading & Investing)Bitcoin tends to really trend for long period of times, whether it’s up or down. It’s a trending asset because it’s a new asset, full of price discovery.
I really hope this indicator is instrumental in your Bitcoin trading, it really does an outstanding job in defining the trend and helping you stay with it.

OracleWhere to use?
Oracle gives the best performance on ETH/USD but also works for BTC/USD and some other charts like XAU/USD ( Gold ). Fails for almost all other cryptocurrencies.
Use 1d or 4h time frames only. 2h and 3h also work in some cases. Use Heikin Ashi candles for the best results.
The strategy is still being tested. Use at your own risk.
How to use?
Arrows start pointing upwards and candle closes above the Orange line - Price is likely to go up
Arrows start pointing downwards and candle closes below the Orange line - Price is likely to go down
Also, the orange line can be used as a mental stop loss point.

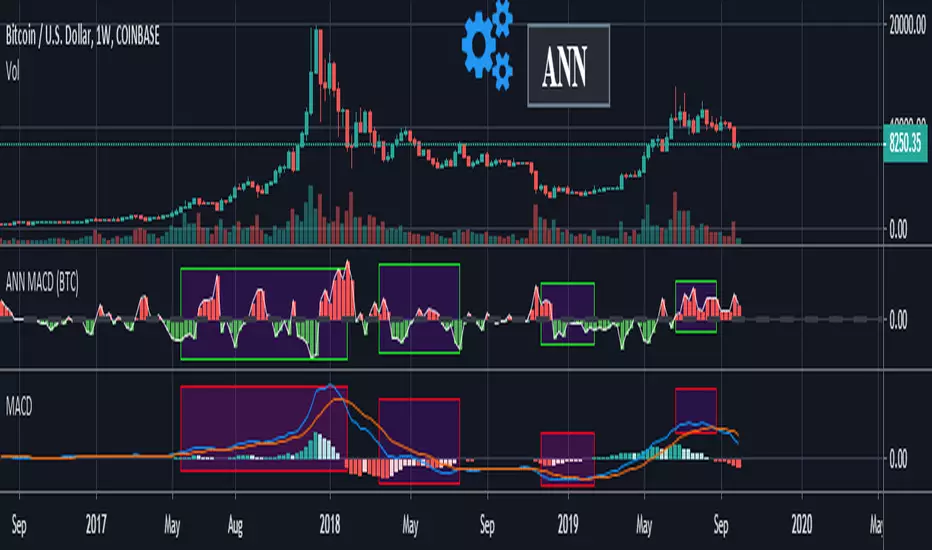
ANN MACD BTC v2.0 This script is the 2nd version of the BTC Deep Learning (ANN) system.
Created with the following indicators and tools:
RSI
MACD
MOM
Bollinger Bands
Guppy Exponential Moving Averages:
(3,5,8,10,12,15,30,35,40,45,50,60)
Note: I was inspired by the CM Guppy Ema script.
Thank you very much to dear wroclai for his great help.
He has been a big help in the deep learning series.
That's why the licenses in this series are for both of us.
I'm sharing these series and thats the first. Stay tuned and regards!
Note : Alerts added.

LinReg-Bitcoin's Power Oscillator.2019.01[wozdux]Bitcoin power oscillator from Harold Christopher Burger.
Since the first day of history is the most important, it is not correct to use this indicator on young exchanges with a short history.
The oscillator is calculated based on regression lines from the first day of history to the current day. The way of calculation of the oscillator. First, the regression line from the first day of history to the current bar is calculated for each bar.
Thus, for each bar, the formula of a straight regression line of the form Y=b*x + a is calculated. Where x is the number of days elapsed from the beginning of the history to the current drill. Y is the bitcoin price of the current day (bar) on the regression line. Thus, Y Is the predicted bitcoin price that would have to be. The second stage of calculation. Now we have the real price of bitcoin for the current day and the predicted price by the regression line. We calculate the ratio of the real price to the predicted one and take the logarithm of the obtained value. G=log10(Close/Y). This value is drawn in the form of a graph of the bitcoin power oscillator. The resulting oscillator oscillates in a constant range of values from -1 to +1.
This oscillator clearly captures the moments of price reversal. At the tops, the reversal occurs when the oscillator reaches the value range from 0.6 to 0.8. In the lowlands, the reversal occurs in the range of values from -0.8 to -0.4.
Indicator setting-description of buttons from top to bottom.
1) Raise the chart by X units. This is a corrective point in order to raise the chart above/below the zero line
2) Offset the start day of the story. The first day of history is the point relative to which all regression lines, all bars are calculated. This point can be slightly corrected by shifting the initial day to the left for a certain number of days.
3) button to switch between different ways to calculate the offset (A) in the formula Y=b*x + A.
4) the Orange level is the trend line of the historical power oscillator troughs. The orange level is an inclined level of price reversal from the bottom up.
5) the Green level is an important area of likely bitcoin price reversal at the tops.
6) the Red level is the horizontal level of the price reversal from the bottom up.
....
Осциллятор мощности биткоина от Harold Christopher Burger. "Это моя попытка воспроизвести вычисления данного генератора методами Pine Script .
Поскольку первый день истории имеет самое важное значение, то использовать данный индикатор на молодых биржах с короткой историей будет не корректно.
Осциллятор вычисляется на основе линий регрессии от первого дня истории до текущего дня. Путь вычисления осциллятора. Сначала для каждого бара вычисляется линия регрессии от первого дня истории до текущего бара.
Таким образом, для каждого бара вычисляется формула прямой линии регрессии вида Y=b*x + a. Где х -это количество дней, прошедших от начала истории до текущего бура. Y- это цена биткоина текущего дня (бара) на линии регрессии. Таким образом, Y- Это предсказанная цена биткоина, которая должна была бы быть. Второй этап вычисления. Теперь у нас есть реальная цена биткоина на текущий день и предсказанная цена линией регрессии. Вычисляем отношение реальной цены к предсказанной и берем логарифм , полученнного значения. G=log10(Close/Y). Это значение рисуем в виде графика осциллятора мощности биткоина. Полученный осциллятор колеблется в постоянном диапазоне значений от -1 до +1.
Данный осциллятор четко отлавливает моменты разворота цены. На вершинах разворот происходит тогда, когда осциллятор достигает области значения от 0.6 до 0.8. В низинах разворот происходит в области значений от -0.8 до -0.4.
Настройка индикатора - описание кнопок сверху вниз.
1 ) Поднять график на Х единиц. Это корректирующий пункт для того, чтобы приподнять график выше/ниже относительно нулевой линии
2) Смещение начального дня истории. Первый день истории -это та точка оносительно которой вычисялются все линиии регрессии, всех баров. Эту точку можно немного подкорректировать, сместив начальный день влево на какое-то количество дней.
3) Кнопка переключения между разными способами вычисления смещения (A) в формуле Y=b*x + A.
4) Оранжевый уровень - это линия тренда исторических впадин осциллятора мощности. Оранжевый уровень это наклонный уровень разворота цены снизу вверх.
5) Зеленый уровень - это важная область вероятного разворота цены биткоина на вершинах.
6) Красный уровень -это горизонтальный уровень областей разворота цены снизу вверх.

Super Trend Daily 2.0 BFThis is my Super Trend Daily strategy but with one important difference. You can now adjust settings for long or short signals individually and separately. For example, the condition for a long signal may require a different parameter setting than the condition for a short signal. Each parameter in the signal generation can be tuned. You can also decide what kind of stop loss you want for each side - you could have a fixed stop loss for longs and an ATR derived stop loss for shorts, or whatever.
We also have the option to choose if we want longs, shorts or both.
INISTRUCTIONS
Look at the background colors:
Green line = long signal
Red line = short signal
Aqua = No long trades
White = No short trades
Yellow dotted line = stop loss for long
Orange dotted line = stop loss for short
The aqua and white backgrounds mean the conditions are choppy/sideways according to our settings we applied to the rate of change function for a long/short signal respectively. It is possible to get a long signal in a white background, but not a short signal. Similarly, it is possible to get a short signal in an aqua background, but not a long signal.
This is a work in progress so any suggestions for improvements are welcome.

1337 Simple Strategy - FREE - simple BTCUSD H1-H6 trendfollowing strategy
- best on H2-H4
- longterm strategy (no scalping)
- best with 1-3 pyramiding (but also without good)
TF = HTF Input
src = OHLC4 or hl2 for best results
Noisfilter = avoid too many Signals

Super Trend Daily BF 🚀Super Trend is based on volatility and attempts to show the overall greater trend of a market. Thanks to everget for the idea of improving the Super Trend code. Thanks to kiasaki for ROC code.
The idea here is to enter a trade upon trend reversal (unless we have a white background - this indicates choppy/sideways market).
INSTRUCTIONS
Follow the background color for signals of a trend reversal.
Bright green = long
Bright red = short
White = no trade
We use a fixed stop loss here of 6% but I have included the option to apply an ATR based stop loss in Settings. No take profit. No re-entering until we get an opposing signal.
I use a Rate of Change function to detect when we should stay out due to choppy sideways price action.
This strategy was optimised for XBT/USD on Bitmex 1 day chart, ideal settings for other pairs will differ.

That One Indicator (Free) - [Backtester]This Backtester comes with the following indicators:
Bollinger Bands
ADX
Moving Average Trend Confirmation Filter ( EMA , SMA , DEMA , TEMA , WMA , VWMA , SMMA , HullMA, LSMA , ALMA , SSMA, TMA, ZLEMA )
And a few more indicators in the back-end to increase accuracy
This strategy works really well as a scalper on lower Time Frames as well as on higher Time Frames. Besides that you can also trade it on pretty much any coin or asset.
The alerts script is not repainting. We advise to use alerts on “Once Per Bar Close”.
If you’d like to automate this strategy you can do that by using our alerts script with AutoView, ProfitView, ProfitTrailer, CryptoHopper etc.
Alerts are set very clearly as Long and Short to avoid confusion.
Feel free to leave a comment and share it with your friends.

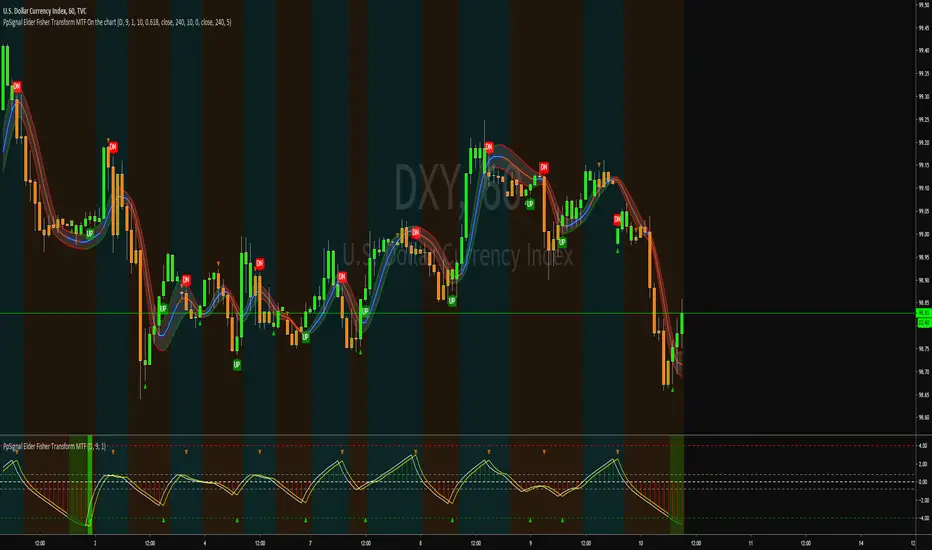
PpSignal Elder Fisher Transform MTFWhat is the Fisher Transform Indicator?
The Fisher Transform is a technical indicator created by J.F. Ehlers that converts prices into a Gaussian normal distribution. In this way, the indicator highlights when prices have moved to an extreme, based on recent prices. This may help in spotting turning points in the price of an asset. It also helps show the trend and isolate the price waves within a trend.
The Fisher Transform attempts to normalize asset prices, thus making turning points in price clearer.
Some traders look for extreme readings to signal potential price reversal areas, while others watch for a change in direction of the Fisher Transform.
The Fisher Transform formula is typically applied to price, but it can also be applied to other indicators.
Asset prices are not normally distributed, so attempts to normalize prices via an indicator may not always provide a reliable signal.
The Fisher Transform Explained
The Fisher Transform enables traders to create a Gaussian normal distribution, which converts data that isn't typically normal distributed (like market prices). In essence, the transformation makes peak swings relatively rare events to help better identify price reversals on a chart. The technical indicator is commonly used by traders looking for leading signals rather than lagging
indicators.
How to use the script?
Buy Long signal when the histogram is green and the background is aqua.
Sell signal when the histogram is red and the background is orange.
More signal in the script
you ave two scalping signals, when the move average high (gray color) is over the low signal (yellow) you will see a triangle this i a good signal for anticipating to the long signal.
and viceversa when the low signal is below to the high signal, you will see an orange triangle.
Strategy based on the principles of Price ActionIt is considered the percentage of candles with low and high closure for a certain period. Then, a moving average is built from these values. When the moving average of the ratio of tall candles to low candles is greater than the ratio of low candles to high, then long (that is, when the green line crosses the red). And vice versa - a condition for short. It also works on crypto with other settings. Idea for improvement: you can make partial exit by taking, at certain profit levels, the chart will be more stable. Result with a commission of 0.004% You can create an optimizer, and use this strategy on any liquid asset. (Sorry for google translator)

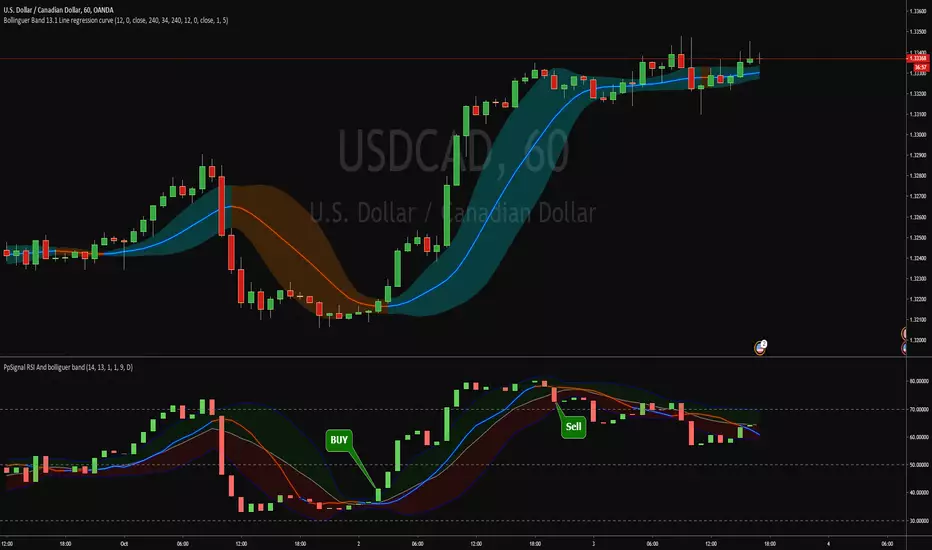
PpSignal RSI and bollinguer bandRSI bollinguer band oscillator, buy when the Ma is blue and the rsi is on the upper band and sell when de ma is red and rsi is cross down the lower band..
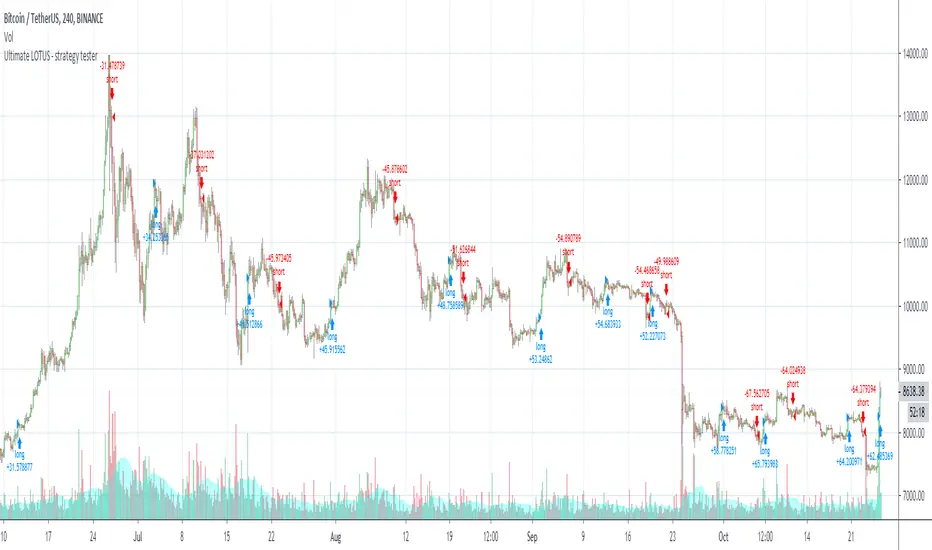
Ultimate LOTUS - strategy tester
Welcome to the Ultimate LOTUS - Strategy Tester.
This indicator is used for back-testing. Once you have found settings that you like, you can use my other published indicator "Ultimate LOTUS" to set alerts.
How to use: Apply to any chart, on any time frame. You will see LONG and SHORT signals on the chart. A LONG signal represents an entry/buy in, and a SHORT signal represents an exit/sell.
You can use the Express - Strategy Tester to scalp on low time frames such as the 5m, 15m, 30m etc. Or use it on higher time frames such as the 1hr, 2hr, 4hr.
You can use regular candles but Heikin Ashi are recommended for better accuracy.
You cannot set alerts with this indicator!
ANN MACD (BTC)
Logic is correct.
But I prefer to say experimental because the sample set is narrow. (300 columns)
Let's start:
6 inputs : Volume Change , Bollinger Low Band chg. , Bollinger Mid Band chg., Bollinger Up Band chg. , RSI change , MACD histogram change.
1 output : Future bar change (Historical)
Training timeframe : 15 mins (Analysis TF > 4 hours (My opinion))
Learning cycles : 337
Training error: 0.009999
Input columns: 6
Output columns: 1
Excluded columns: 0
Grid
Training example rows: 301
Validating example rows: 0
Querying example rows: 0
Excluded example rows: 0
Duplicated example rows: 0
Network
Input nodes connected: 6
Hidden layer 1 nodes: 8
Hidden layer 2 nodes: 0
Hidden layer 3 nodes: 0
Output nodes: 1
Learning rate : 0.6 Momentum : 0.8
More info :
EDIT : This code is open source under the MIT License. If you have any improvements or corrections to suggest, please send me a pull request via the github repository github.com
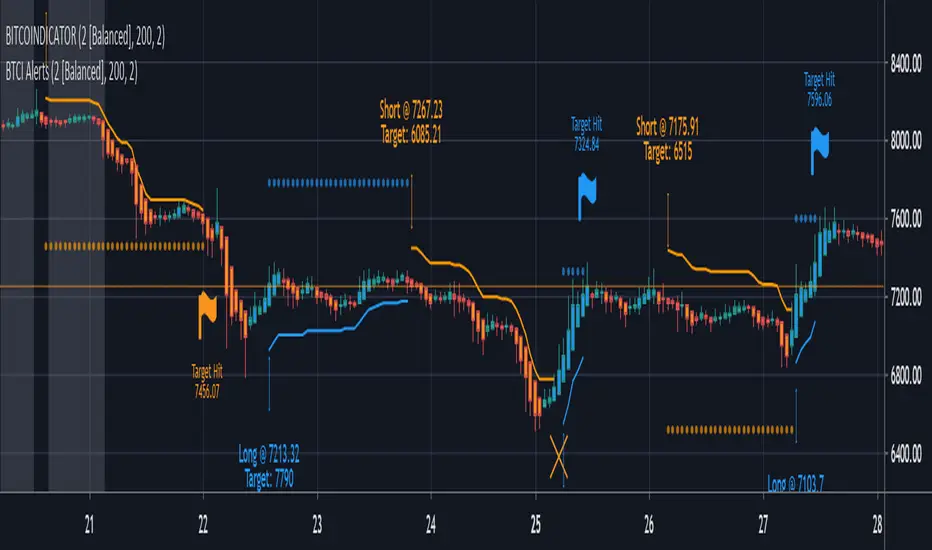
BITCOINDICATOR StrategyStrategy for BITCOINDICATOR for your own backtesting purposes.
The trade locations mirror the price label values generated by BITCOINDICATOR (You can check by clicking on Strategy Tester > List of Trades). Just like BITCOINDICATOR, this strategy works with all time frames, although higher time frames will result in better average profit per trade.
Inputs:
- Click the gear icon to adjust the backtesting date range inputs.
Properties (gear icon then click properties tab):
- The default initial capital is 0, and the default order size is 1 Contract (1 BTC ) per trade (this gives more weight to the most recent data).
* We recommend keeping the order size in contracts because if you use fiat, the time periods of lower-priced Bitcoin will have a greater impact on the strategy (since those trades would transact more BTC ).
- Pyramiding is the number of trades allowed to be taken in the same direction. The default value is set to 5, although it is rare to see more than 2 trades in the same direction.
* Additional trades in the same direction can be useful for adding on to your position or just for trend confirmation. If you prefer to see every SHORT followed by a LONG and vice-versa, you can change pyramiding to 1.
Side Notes:
- BITCOINDICATOR strategy can also be used for any Altcoin/Stable coin pair (such as ETH/USD). However, you will want to increase the order size from 1 Contract, to suit your Altcoin (For example, at the time of writing: 1 BTC = 47 ETH, so I would trade ETH/USD with an order size of 47 contracts). Of course, you can adjust the order size to the amount that you are actually trading.
- You will notice that the lower the selected time frame, the date range for backtesting becomes more limited. This is because there is a historical bar data limit of 5,000 - 10,000 bars depending on the tier of your TradingView account.
*Bitcoindicator Strategy is part of the Bitcoindicator package.
For detailed information on Bitcoindicator and how to add it to your charts, please visit:
www.bitcoindicator.com
Strategy tested on BTC/USD(Day) from 1/1/2017 - 10/1/2019 :

BITCOINDICATOR AlertsAdd this indicator to your chart to set up alerts for BITCOINDICATOR.
Alerts will tell you when to buy long and when to sell short.
They can also be used simply as entry/exit notifications or trend confirmation.
Unless you are a day trader, we recommend you only set up alerts for higher time frames to limit notifications.
How to use:
- In the top right of your chart, click the alarm clock symbol.
- Click the set alert "+" symbol next to Manage Alerts.
- In the pop-up box, change the condition to BTCI Alerts.
- Choose the alert you want - Buy Long or Sell Short.
- Choose ONLY either Once Per Bar or Once Per Bar Close.
Note: If you choose Once Per Bar, you will receive an alert the instant the trade condition is met. However, if the trade condition is unmet again in the same bar and stays unmet until the bar closes, the real-time price label generated by BITCOINDICATOR will have flickered out and the trade signal will be invalidated. This option is for more aggressive traders as it gets you into the trade earlier, but adds some risk.
- Adjust additional inputs and a custom message (we recommend to add your time frame to your message if you have multiple alerts set up).
- Click Create
*Bitcoindicator Alerts is part of the Bitcoindicator package and should only be used with BITCOINDICATOR.
For detailed information on Bitcoindicator and how to add it to your charts, please visit:
www.bitcoindicator.com