SMA Serial for Crypto Day Trade Fixed Length SSCDTENCrypto market is different from other financial markets
This indicator plot SMA series that fits Crypto, esp BTCUSD, XBTUSD
Good for 5m - 1H time period for Day Trading.
Specific SMA can be toggle on/off
---------- Française ----------
Le marché de la crypto-monnaie est différent des autres marchés financiers
Cet indicateur série SMA qui correspond à Crypto-monnaie, en particulier BTCUSD, XBTUSD
Bon pour 5m - 1H période pour le day trading.
SMA spécifique peut être activé / désactivé
---------- 中文 ----------
加密货币市场与其他金融市场不同
该指标绘制了适合加密货币的SMA系列,特别是BTCUSD,XBTUSD
适合5分钟 - 1小时 日间交易时间段。
特定SMA可以打开/关闭
----------日本語----------
暗号通貨市場は他の金融市場とは異なります
この指標は、暗号通貨、特にBTCUSD、XBTUSD用のSMAシリーズを描画します。
5分から1時間の取引期間に適しています。
特定のSMAをオン/オフにすることができます
---------- Disclaim ----------
Before using this indicator, you acknowledge that you have read and accepted that this indicator is for research purpose only and it does NOT provide any investment nor trading signal.
Users should make their own decisions, carefully assess risks and be responsible for their own investment and trading activities.
BTCUSD

Delta longs-shorts. BITFINEX:BTCUSDFor any timeframe. Use for the BTC/USD pair. It is calculated by the formula: longs - shorts. Used data from Bitfinex. To smooth the values, you can use the EMA embedded in the indicator.

11.01.2017 XBTUSD FinalThis script has been developed by me since the beginning of 2017 and at the moment I present its best version. Due to the fact that I am planning to create my own project based on this algorithm, I will open access to use it for everyone for a moderate reward. The collected funds will be used to ensure the promotion of the project and the improvement of the current algorithm.


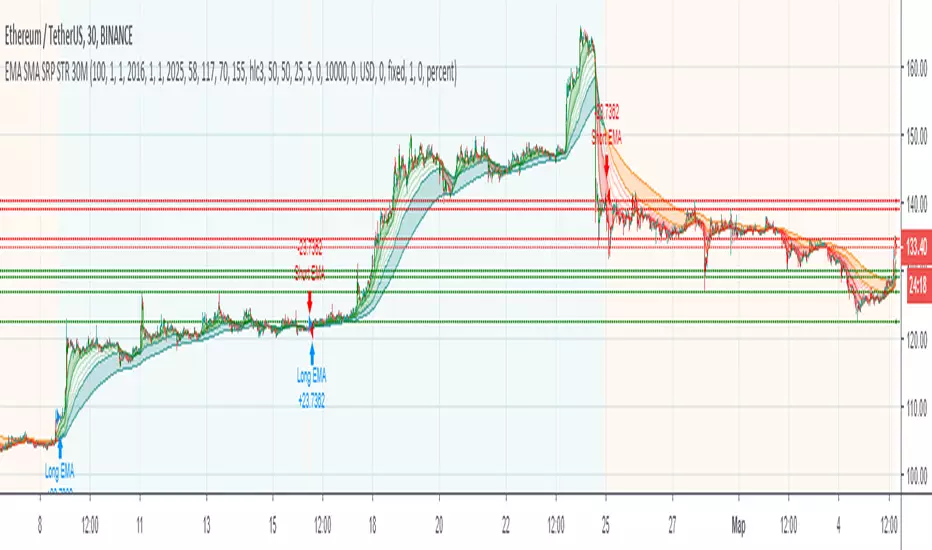
EMA SMA SRP STRATEGY 30MThe strategy is based on indicators:
Exponential Moving Average (EMA)
Simple Moving Average (SMA)
Support and Resistance Levels
Allows to find entry/exit points

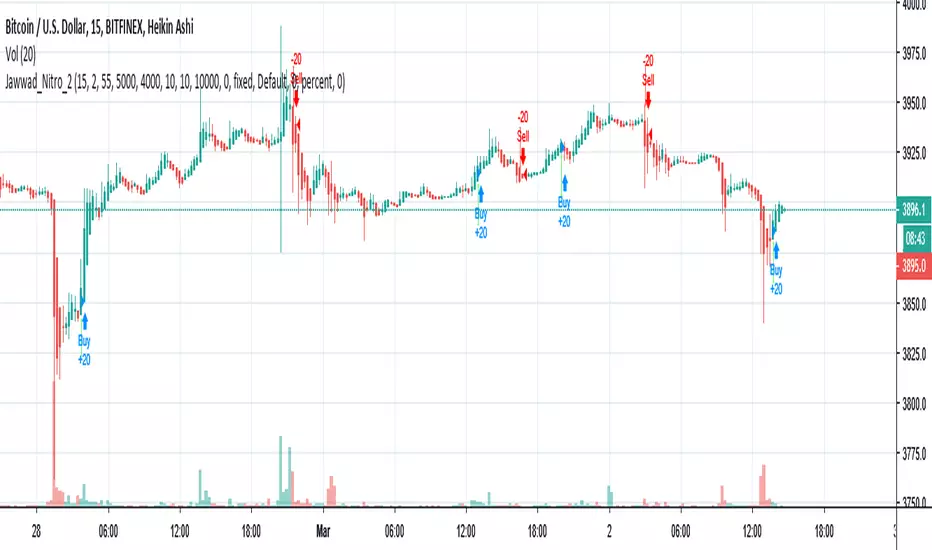
Jawwad Nitro_2 Crypto Forex Strategy - Highly ProfitableThis strategy is tested on selected crypto and forex pairs. It seems to be highly profitable and non-repainting. You can make some good money until you are following it properly and not playing with the settings.
1. Use 15 minute Heiken-ashi chart.
2. Apply the strategy.
3. Enjoy!!!
If this strategy works for you, please don't forget to buy me a cup of coffee... If you find anything wrong, please let me know. I shall be happy to fix it for you.
Cheers,
Jawwad
Pump/Dump Hunter 15M+ Alerts//The Alerts is based on the pumps and dumps strategy, as well as a sudden change in market volumes
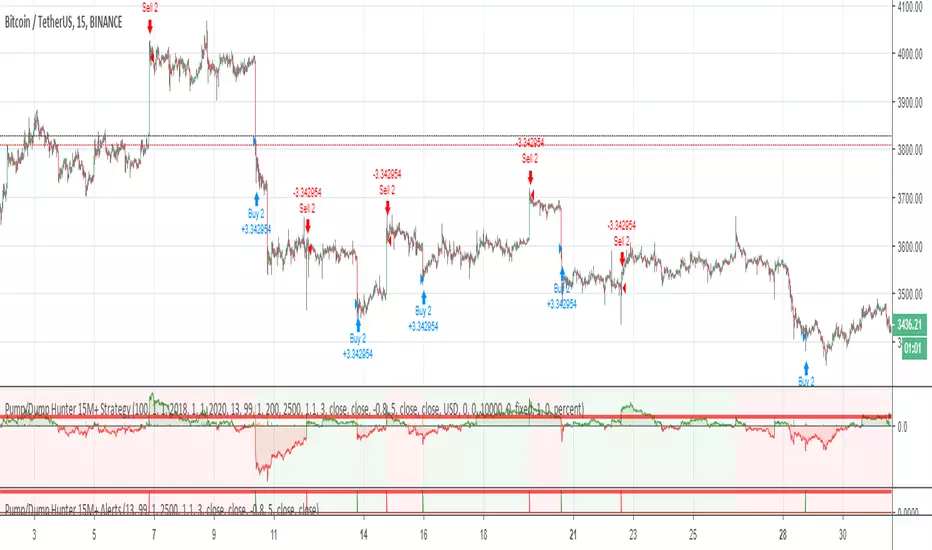
Pump/Dump Hunter 15M+ Strategy// The strategy is based on the pumps and dumps, as well as a sudden change in market volumes

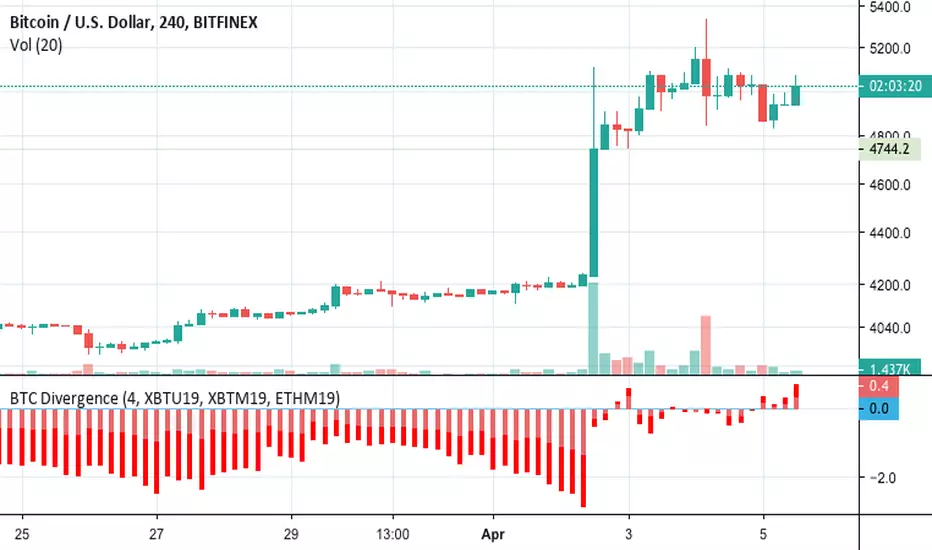
BTC Futures Divergence Monitor 1.0BITFINEX:BTCUSD
BTC Futures Divergence Monitor 1.0
=======
# Abstract
This script shows the divergence between BTC futures price and BTC actuals price of bitFlyer FX and BitMEX in percentage .
Usually, when people bought it or sold it too much on futures, the divergence between actuals and futures are getting expanding.
I believe this is really useful to find when the conversion of the trend happens.
Also supports ETH and USDT divergence too. If you wish to enable USDT mode, please check "Show only USDT divergence (Poloniex)" on the settings menu.
Enjoy :)
# Supports:
- bitFlyer FX (blue)
- BitMEX BTC Futures 3mo (orange)
- BitMEX BTC Futures 6mo (red)
- BitMEX ETH Futures (purple)
- USDTUSD (Poloniex)
# Disclaimer:
This is a free script. Feedbacks are welcome! But I don't have any responsibility when this script has broken or something went wrong.
TREND PROTECTTrading system developed for protecting grid trading or gamma short positions or for taking advantage of a rise of the BTC protecting from crashes.
It is in forward test without changing the parameters since April 2018.


PpSignal Super Trend Smooth Trend Trader StrategySuper trend scalp system, buy when the bar is green and sell when the candle is red.
you can use in all time frame

PpSignal SuperTrendPpSignal supertrend channel is calculated with eldher super smooth system.
we added PpSignal CFB move average
PpSignal Golden Cross V2In this version added CFB and move out Vidya, cfd is more and quickly for anticipate the change trend.
BTCUSDSHORT - BTCUSDLONG : balance of powerHello everyone,
I noticed that many people try to compare SHORTS and LONG positions (see: BTCUSDSHORTS and BTCUSDLONGS ), and the available indicators don't sufficiently highlight the balance of power .
That's why I programmed this indicator to answer this need ( which I also have ! ).
His name is : BTCUSDSHORT - BTCUSDLONG crossover indicator
I think you will understand quickly how it works, it's easy :
- If the histogram is negative, the color is red and that means that there are more BTCUSDSHORTs than BTCUSDLONG
- If the histogram is positive, the color is green and that means that there are more BTCUSDLONDS than BTCUSDSHORTS
A small cross (red or green) appears when the power balance is reversed.
Have a good day.
EDIT 03/02 : Title has been changed

[BACKTEST] CMYK-RMI-TRIPLE IIThis is the same previous script but without the calculation of the Deribit index (for BITMEX users for example) that can give problems due to no connection with any of the 6 exchanges. Now use 'close' as source.
Settings for BTCUSD or XBTUSD
Best time frame: 5 minutes