YinYang VolumeOverview:
YinYang Volume is an Advanced Volume Indicator. Regular Volume can be deceiving. It can be hard to tell how much of the Volume bar is Buy vs Sell volume, especially since the bar is green or red simply based on if it closes at a greater price than it opened. With YinYang Volume you'll be able to see how much Buy AND Sell Volume there is on each bar. Being able to see both is very useful, but the cherry on top is the Buy and Sell Moving Average Lines. These lines (White is Buy and Orange is Sell) can show who is currently winning the fight, Bulls or Bears. When the lines cross it's a shift in momentum and when combined with other technical analysis you can better understand the direction the market is moving and make an informed and educated trading decision. YinYang Volume also has Information tables, these tables display the Buy vs Sell volume on different Timeframes. This way even if you're trading on a Low Timeframe (like 15 minutes) you can see how the Buy vs Sell volume is fairing on other Timeframes.
Tutorial:
Unlike most volume indicators, including standard volume, we can see both Buy AND Sell volume for each bar. You may be wondering, well what’s the importance of this? The answer is EVERYTHING! Volume is one of the most important indicators when it comes to trading. Nothing moves without volume. However, with standard volume, the bar is either red or green simply based on if it closes greater than it opens. Now, that is pretty silly if you ask us. Let’s get into depth as to why seeing both Buy and Sell volume is important, and examples for how you can make trades with it:
In this example above, we have 2 green bars and they both have high levels of volume. This bar on the right however, has more volume than the one on the left. The issue here is, the bar on the right has MORE Sell volume than it even does have Buy volume; meanwhile the bar on the left has way more buy volume than the bar on the right with little sell volume. Without separating them and by simply looking at the price bar and regular volume bar, we would never be able to deduce this. It is crucial to understand and see how much of each volume there is as it plays a huge role in the price movements.
The white line represents the Buy Volume Moving Average and the orange line represents the Sell Volume Moving Average. These moving averages are very useful as when they cross they represent strong Buy and Sell Signals.
We’ve enabled signals which plot circles onto the MA’s to display when they’ve crossed. The white circle represents a Buy Signal and the Orange circle represents a Sell Signal. These signals are very strong, but there is a catch that comes with it. The bar right after the signal has the highest chance of a reversal so it isn’t always advised to make the trade until confirmed that the reversal didn’t happen on the following bar. If you have enough data based on other technical analysis to know the first signal is true, then use it as a way to solidify the fact that it is a good entry/exit location.
You can change the length of which the MA’s are smoothed out over. For instance, in the previous examples and by default the length is 14. However, if we are to change it to 50 for instance, it makes them a longer lasting MA that has much fewer crosses. This can be useful based on your trading style and if you prefer to stay in trades for quite awhile. As you can see, all signals with the 50 length are quite accurate and would have produced profitable trades, likely more so than at 14, but since it moves slower there's fewer signals to trade on.
Our Information Tables are there to show you the amount of Buy vs Sell %’s on 6 different Time Frames at the same time. It can be very useful to know how people are feeling on different Time Frames without you having to change your own. This way you can stay on say the 15 minute Time Frame locked in your trade and can see if the momentum of your long trade is cooling down based on higher Time Frames Buy vs Sell volume %’s.
For example, let's say you got an alert from YinYang Volume for Buy Signal on the 1 Day. You then entered a trade which you deemed a good location on the 15 minutes (after doing your own technical analysis on the 15 minute too). The Buy vs Sell Volume %’s on the 1 Day was 55% Buy and 45% Sell when you entered the trade. You are still waiting for exit confirmation on the 15 minute but you notice the Buy vs Sell Volume % on the 1 Day goes down to 52% Buy and 48% Sell. You can see the momentum changing. Even though you haven’t received confirmation for exit on the 15 minute, it may still be a good time to get out as momentum is clearly changing on the 1 Day.
We will conclude this Tutorial here. We hope you’ll get some good use out of our Volume Indicator and its ability to display unique Volume Data. If you have any Questions, Comments, Suggestions or Concerns, please don’t hesitate to contact us.
Settings:
1. Show Signals:
Toggling this setting shows when the Buy and Sell Volume MA’s cross each other. It produces a white circle when the Buy Volume Crosses over the Sell Volume (BULLISH) and an orange circle when the Sell Volume Crosses over the Buy Volume (BEARISH).
2. Length:
How far back should we average the Buy and Sell Volume Moving Averages? 14 is default has been tested and proven to work well, however you can change it if there is a different value that suits your trading style better.
3. Type:
How is the Moving Averages calculated? VWMA (Volume Weighted Moving Average) is the default as it has been tested and worked best; afterall, we are calculating volume and therefore should use a volume weighted MA calculation. However, you can change it as your options are:
VWMA, EMA and SMA
4. Information Tables:
4.1. Show Information Tables:
Our Information tables display 6 different resolutions so you can see how much Buy vs Sell volume there is as a % in multiple different Time Frames without having to change your Time Frame.
4.2. Strength:
The Buy / Sell Volume %’s displayed within your Information Tables are based on Moving Averages. The length this moving average uses is based on the Strength you select. The strengths aren’t as simple as just a length amount but are a calculation involving multiple different lengths and averages. However, the stronger the strength, generally the farther the lookback length is as an average. Your options for strength are:
Unbreakable
Very Strong
Strong
Average
Weak
Very Weak
Glass
We recommend ‘Average’ Strength, however if you find you want to see the %’s change more or less frequently you can adjust to your trading style
4.3. Res1 / Res2/ Res3 / Res4 / Res5 / Res6:
These represent the different resolutions (Time Frames) being used in your information tables and can be modified to display whatever resolution works best for your trading style. By default they are:
Res1: Current Timeframe
Res2: 15 Minute
Res3: 1 Hour
Res4: 4 Hour
Res5: 1 Day
Res6: 1 Week
Backup Res (not changeable): 5 Minute (this is only used if your Current Timeframe in Res1 is a duplicate of one of the other resolutions)
HAPPY TRADING!
Buy

YinYang Fear and Greed Index (FGI)Overview:
YinYang Fear and Greed Index is used for seeing how people are feeling towards the current price. It works similar to an RSI, but fluctuates differently. Essentially you want to be Greedy when the Index displays Fear and Fearful when it displays Greed. Our Indicator displays a Green Circle (Greed Signal) on the YinYang Fear and Greed Index when there is a large amount of Greed at this price point. It displays a Red Circle (Fear Signal) when there is a large amount of Fear. The Fear and Greed Signals can happen at any Fear and Greed Index but generally they correlate with the Index level. The Fear and Greed Signals are much more important at dictating a swing in momentum than the actual Index itself. The Index is more of a guide and is useful for seeing when the Index level crosses the Ma (the yellow line) as you can see a shift in momentum. However for large swings in momentum, the Fear and Greed Signals should be used. Do NOT Ignore these signals, they are quite powerful at predicting momentum swings.
Tutorial:
As you can see, the Fear and Greed Index looks somewhat similar to an RSI, but it has the ability to gain drastic momentum when there are strong changes in Fear and Greed.
When it comes to identifying buy/sell locations you generally want to ensure 2 things:
For a buy, the Fear and Greed Index (FGI) is less than 30.
For a sell, the FGI is greater than 70.
A signal has occurred. For buy that is the red circle and for sell that is the green circle.
The reason we generally want to ensure these 2 rules is to ensure you have the highest chance of being right with the lowest risk of being wrong. The way you want to use this indicator is; Be Fearful when others are Greedy and Greedy when others are Fearful.
There will be times when a fear or greed signal appears when the index is between 30-70. When these occur, they are still generally strong signal locations that represent a high chance of momentum in the direction they signal, however they face a higher risk of being wrong and therefore shouldn’t be used on its own to make a trade.
In the photo above we can see that the FGI’s color changed from Red to Orange in the candle after the Fear Signal. This happened because there was high price movement right after it (which is normal) and caused the Fear level to drop.
The color the FGI displays is based not off the FGI but by the STATE it is currently in. When the color is Green it is in a state of HIGH GREED, when the color is Red it is in a state of HIGH FEAR. When the color is Teal it is in a state of SLIGHT GREED, when the color is Orange it is in a state of SLIGHT FEAR. These colors hold true for the Information Tables as well.
As we can also see from the example above, it is 100% possible to have a state of HIGH GREED when the FGI is low. For instance look at the Fear (BUY) signals circled. Right before the Fear Signals happened, it was in a state of HIGH GREED (Green). The opposite is also true with Fear. We can have a high state of Fear when the FGI is high. However, please do remember, the lowest risk and best time to make trades is still:
FGI is higher than 70 and there is a Greed Signal = SELL
FGI is lower than 30 and there is a Fear Signal = BUY
You may notice there are sometimes occurrences that we call ‘Oddballs’. These oddballs are quite rare but they do happen and when they do they’re generally in clusters (close together). These Oddballs are when a Greed Signal occurs when the FGI is very low or when a Fear Signal occurs when the FGI is very high. Basically, they are occurring in the opposite location that they are supposed to. These may not seem like they matter but they matter a lot. As you can see based on where the blue vertical lines are, the price moved in the direction the signal identified shortly after the signal.
You may be wondering, are Oddball’s stronger price influencers than the regular signal? The issue with Oddballs is they sometimes CAN BE. But generally they aren’t. They generally do signal price movement will occur in the direction they are influencing, but generally not as much movement as if it occurred properly (Fear signal under 30 or Greed signal above 70).
The takeaway from Oddballs is to acknowledge their existence and potentially use them as markers for smaller purchases or DCA locations. We don’t recommend treating them as a legitimate purchase signal as they generally are weaker and less predictable, but nevertheless don’t dismiss them.
Our Information Tables are there to show you the FGI on 6 different Time Frames at the same time. This can be very useful for knowing how the other Time Frames are fairing while you are trading without needing to constantly change the Time Frame you are on.
For example, you see a Fear Signal on the 1 Day Time Frame, you then swap to the 15 minute Time Frame to find your entry location. Well, once you’re locked into that trade, you’ll likely be fixated on the 15 minute Time Frame. There’s a chance while you’re still waiting for your exit that levels and states of the FGI could change on higher Time Frames. This could drastically influence when and where your exit on the lower Time Frame should be.
This concludes our Tutorial on how to use YinYang Fear and Greed Index (FGI). However, continue reading for a description and better understanding of the Settings available to you for customization within this Indicator.
Settings:
1. Information Tables:
1.1. Show Information Tables:
Our Information Tables display 6 different Time Frames (resolutions) so that you can see the current level of Fear and Greed (FGI) that is prevalent on each Time Frame. There are 4 different states the FGI can be in:
Fear (Red)
Minor Fear (Orange)
Greed (Green)
Minor Greed (Teal)
The color of each Time Frame Cell (on Oscillator and in the table) is based on the following:
Red: Red represents that it is currently in a state of Fear. When it is in a state of fear it means traders are being overly bearish and selling when they likely shouldn’t. While it is in a state of Fear, there is a high chance of BULLISH price movement occurring. Remember, Be Fearful when others are Greedy and Greedy when others are Fearful.
Orange: Orange represents that it is currently in a state of Minor Fear. Minor Fear means that the FGI is less than 50, but it’s not currently in a state of Fear or Greed. While it is in this state, there is a better chance for BULLISH price action than there is bearish but it's nowhere near as likely as when in a state of Fear.
Green: Green represents that it is currently in a state of Greed. When it is in a state of Greed, it means traders are being overly bullish and buying when they shouldn’t. While it is in a state of Greed, there is a high chance of BEARISH price movement occurring.
Teal: Teal represents that it is currently in a state of Minor Greed. Minor Greed means that the FGI is greater than 50, but it’s not currently in a state of Fear or Greed. While it is in this state, there is a better chance for BEARISH price actions than there is bullish; but it’s nowhere near as likely as when its in a state of Greed.
2. Res1 / Res2/ Res3 / Res4 / Res5 / Res6:
These represent the different resolutions (Time Frames) being used in your information tables and can be modified to display whatever resolution works best for your trading style. By default they are:
Res1: Current Timeframe
Res2: 15 Minute
Res3: 1 Hour
Res4: 4 Hour
Res5: 1 Day
Res6: 1 Week
Backup Res (not changeable): 5 Minute (this is only used if your Current Timeframe in Res1 is a duplicate of one of the other resolutions)
Our Fear and Greed Index can be very useful for understanding how people are feeling in the market and when large price swings will occur. Remember, Be Greedy when others are Fearful and Fearful when others are Greedy!
If you have any Questions or Concerns, don’t hesitate to contact us.
HAPPY TRADING!

YinYang RSIYinYang RSI is a Momentum Oscillator. It is loosely based on the standard RSI but uses our Custom True Value Zone Algorithm. Essentially it is a stronger, more accurate RSI that isn't manipulated by consolidation. YinYang RSI moves slightly slower than the standard RSI but when it does move it is much more accurate.
Why do we deem YinYang RSI to be a more accurate RSI? Well, let's discuss some of the underlying logic behind it. YinYang RSI is derived from the High and Low data from multiple Security Requests, we send that data into a modified Donchian Channel to calculate its Basis. That basis is then taken and averaged between multiple different VWMA calculations to ‘Smooth’ it out before we send it into an RSI calculation and display the final results.
This may sound a little confusing and you may be wondering, why bother doing this? The main reason we created the YinYang RSI is to remove the fact that consolidation causes Regular RSI to go down in index value. In our opinion RSI shouldn’t go down due to consolidation. By removing consolidation from RSI it innately made the RSI more smooth and since it became more smooth there were less times it crossed the RSI Moving Average (MA). In turn, since it crosses the RSI MA less, it means when it does cross the RSI MA, it is a much stronger more accurate signal; but don’t just take our word for it! Let’s get into some examples to show you exactly how it works:
Our RSI is very smooth, because of the way we apply VWMA to it, it keeps it from being a jagged line like the regular RSI is:
Our Indicator features 3 RSI’s in it: YinYangRSI, Regular RSI and YinYang Stoch RSI. The reason there are 3 is not only for the Information Tables (we will talk about this later), but also for the fact that you can overlay them on top of each other.
Here is the same dates but with Regular RSI:
Hopefully you can see how different they are and how smooth ours is, but if not, lets overlay them so you get a better idea:
When the YinYang RSI and Regular RSI are overlaid on top of each other, the Regular RSI’s colors change for easier readability. The Regular RSI turns Pink and the Regular RSI MA turns Orange. As you can see here, they function much differently and it is quite clear that the YinYang RSI holds itself during consolidation and is more smooth.
You may be asking yourself, this is great and all, but how does it help me trade?
Well, now that you understand the difference between YinYang and Regular RSI let's discuss exactly that!
So as you can see in the image above, when the RSI crosses the RSI MA it represents a strong movement in price is likely about to occur. When the RSI is very low (20 or less) and it crosses ABOVE the RSI MA, this represents a BUY/LONG signal. When the RSI is very high (80 or above) and it crosses BELOW the RSI MA, this represents a SELL/SHORT signal.
There are times where it is a good time to buy or sell, but the RSI may not be in the right place. This is rare but it does happen. We marked a location that did exactly that with an Orange circle in the picture above. These things happen, however we don’t recommend you act on them. The main reason is that they are much more risky. Nothing will ever be 100% accurate, but the key is making decisions that are more in your favor than not. When the RSI and RSI MA cross and the RSI is near 50, it's much less accurate, however, not impossible for it to be a good signal.
Now you may be wondering, how come I see 2 SELL or 2 BUY signals before the RSI moves a lot? This is quite normal. Based on the picture above, all of the BUY and SELL signals are accurate, but not all of them have insane price movements. However, they all did feature SOME price movements. Just because a BUY or SELL (RSI and RSI MA crossing) happens, doesn’t mean the RSI is going to move all the way from 80 to 20, sometimes the price only moves a bit and then corrects back. This is completely normal.
The part that is up to you is knowing when to exit these trades. You can use the YinYang RSI to see entry locations for Long/Short, but it can be risky to assume that you can go from a BUY right to a SELL and vice versa.
Don’t fret, there is a reason we have our YinYang Stoch RSI within this indicator and its not just because we felt like it! When you overlay the YinYang RSI and YinYang Stoch RSI on top of each other, you can get a very good idea of when a signal may be over and likely it’s a good time to get out. However, first, just so you understand what our YinYang Stoch RSI does, let's take a quick look at it.
At first glance, the YinYang Stoch RSI can look pretty strange and even overwhelming, this is completely normal. It features drastic movements, but only when there is good reason to! When the blue line (K) crosses the orange line (D) it represents momentum in price. So when the blue line crosses above the orange line it means BUY and when the blue line crosses below the orange line it means SELL.
How it works with the YinYang RSI is simple, lets toggle the two of them on together in the settings:
It may look a little confusing at first, and we don’t necessarily recommend you do it for your entry as it can be a little too much and sometimes confusing, but it can be very helpful for understanding your exit and if the momentum has changed/died down. Here's an example based on our initial BUY/SELL image above:
So since we’re talking about the double SELL signal and how to know if its momentum is ending we’ve zoomed in on this example. Here we can see where the pink circle is, that the YinYang Stoch RSI has gained buy momentum and the sell momentum has likely ended here. This is canceled out however, by the fact that shortly after we see another SELL signal combined with the Stoch RSI crossing under and also showing SELL momentum. The blue Vertical lines are to show visually where the stoch crossed over/under as they can be a little hard to see visually. Also, based on this example, you can see where the orange circle is that was clearly a very good buy location and also has the stoch crossover in that location too. So even though the RSI isn’t very low, there is still a decent amount of bullish momentum in that location. Is this enough for you to make a purchase on? In our opinion, it’s still a little too risky, but maybe it fits your trading style, or maybe you decide its a good time to Dollar Cost Average / purchase just a small amount.
Now, you may be wondering, as we mentioned it early, what are those Information Tables that have been sitting on the right of every example?
These Information Tables are there to display very important Time Frame data for you. Not only can you see 6 Different Time Frames, which you can customize within your Settings. You also get to see the level of RSI and RSI MA for YinYang, Regular and YinYang Stoch RSI. Being able to see this data on multiple different Time Frames without having to change the Time Frame you are on can be very helpful, especially if you’re trading on a lower Time Frame like 15 minutes. The color of the box is based on if the RSI has crossed the MA or not. When the box is Green, the RSI is greater than the MA (Bullish). When the box is Red, the RSI is less than the MA (Bearish).
This concludes our Tutorial on how to use YinYang RSI, below you will see all of our current Settings, what they all mean and how you can customize them.
Settings:
1. Show Signals:
Signals are when the RSI crosses the RSI MA (for any RSI TYPE active). When these crosses happen, it will make a plot on the chart that represents Buy and Sell Signals. These signals have alerts that correspond with them, but you will manually need to set up these alerts yourself through the indicator. Please refer to TradingView for how to set up alerts.
2. RSI Type:
We have 3 types of RSI’s within this Indicator:
YinYang RSI
Regular RSI
YinYang Stoch RSI
These RSI’s can be used individually or overlaid on top of each other for easier comparison. It can be useful to go back and forth between indicators or have them overlaid to get a better understanding of what's going on.
2.1. YinYang RSI:
Our YinYang RSI is our custom RSI that is based on our True Value Zone Algorithm. It is the main purpose of this Indicator but can be used in conjunction with Regular RSI and YinYang Stoch RSI. YinYang RSI is a much more smooth, slow moving form of RSI that doesn’t go down from consolidation and therefore makes the RSI and RSI MA crosses much more accurate.
2.2. Regular RSI:
This is a regular RSI that is within our indicator so you can make comparisons and also overlay on top of our YinYang RSI and/or YinYang Stoch.
2.3. YinYang Stoch RSI:
This is a Stoch RSI that is calculated with our YinYang RSI’s values to create a very unique Stoch RSI. Our YinYang Stoch RSI moves very drastically and quickly when there is true momentum swings but it never really hovers in the middle. It makes its way from 0-100 and 100-0 within 2-3 candles usually and if it makes it all the way, you know there is momentum backing this price movement.
3. Information Tables:
3.1. Show Information Tables:
Our Information tables display 6 different Time Frame resolutions to give you the data of YinYang RSI/MA, Regular RSI/MA and Stoch RSI/MA over multiple different Time Frames so you don’t constantly have to keep changing yours and can focus on the trade at hand.
You can choose to display:
‘All’,
‘None’,
‘YinYang RSI’,
‘Regular RSI’,
‘YinYang Stoch RSI’
and/or any combination of the three so you can see all the data you want to your liking.
3.2. Display Tables Direction:
Since there are 6 different Time Frames shown, and you have the ability to display all 3 RSI and MA values, this table can get pretty big. If you have a large monitor and not too many indicators active it's no big deal and a vertical display is likely what you’ll want. However, if you have a smaller monitor or many Indicators active, it will scrunch this Indicator and make it difficult to see all of your Time Frames in the tables. For this reason, we have the option to display them ‘Horizontally’.
3.3. Res1 / Res2/ Res3 / Res4 / Res5 / Res6:
These represent the different resolutions (Time Frames) being used in your information tables and can be modified to display whatever resolution works best for your trading style. By default they are:
Res1: Current Timeframe
Res2: 15 Minute
Res3: 1 Hour
Res4: 4 Hour
Res5: 1 Day
Res6: 1 Week
Backup Res (not changeable): 5 Minute (this is only used if your Current Timeframe in Res1 is a duplicate of one of the other resolutions)
Alerts are available and customizable within the Indicator. You can set up an alert for any of the RSI crossing Signals.
If you have any Questions or Concerns, don’t hesitate to contact us.
HAPPY TRADING!

VWAP angle TrendThe VWAP Angle Trend is an indicator built with the aim of providing valuable insights into the reversal points of the #VWAP using Angle
This is achieved by calculating the angle between the current VWAP and its previous value over a customizable lookback period and normalizing it with ATR
By analyzing the angle, we can gain an understanding of the strength and direction of the VWAP, which can help them identify potential trend reversals or continuations.
After observing the market over a lengthy period, I have come to realize that as the angle increases above 65 or decreases under -65 , it confirms a higher likelihood of a trend reversal.
the indicator highlights these zones where a trend reversal is more likely to occur.
The indicator can help you to assess the strength and direction of VWAP, enabling you to make more informed trading decisions.
By identifying periods of strong momentum or potential exhaustion, you can seek opportunities for entering or exiting positions, and potentially capitalize on trend movements in the market.

RSI Momentum TrendThe "RSI Momentum Trend" indicator is a valuable tool for traders seeking to identify momentum trends.
By utilizing the Relative Strength Index (RSI) and customizable momentum thresholds, this indicator helps traders spot potential bullish and bearish signals.
you can adjust input parameters such as the RSI period, positive and negative momentum thresholds, and visual settings to align with their trading strategies.
The indicator calculates the RSI and evaluates two momentum conditions: positive and negative.
The positive condition considers the previous RSI value, current RSI value, and positive change in the 5-period exponential moving average (EMA) of the closing price.
The negative condition looks at the current RSI value and negative change in the 5-period EMA.
Once a momentum condition is met, the indicator visually represents the signal on the chart.
The "RSI Momentum Trend" indicator provides you with a quick and effective way to identify momentum trends using RSI calculations.
By incorporating visual cues and customizable parameters, it assists traders in making informed decisions about potential market movements.

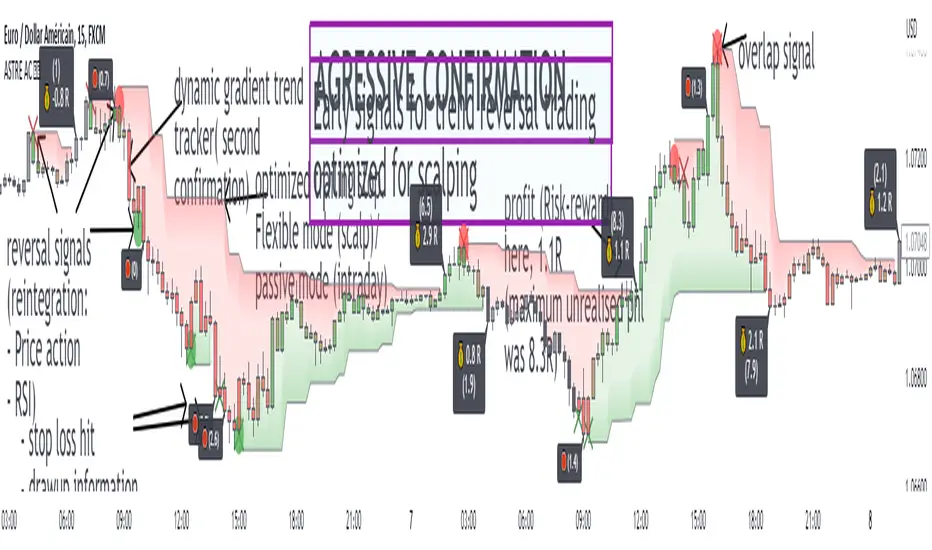
Agressive ConfirmationThis indicator serves as a guide for aggressive counter-trend trading, offering entries, a trailing stop for trade exits and a performance backtesting system (risk ratio).
AC proves to be an excellent ally in assisting counter-trend entry decisions. The signals come from two different sources, and are positioned almost identically in terms of the timing of entry into a trade on a trend change.
The first is RSI reintegration: simple, effective. The second is price action reintegration (identifies short-term support/resistance, a false break with counter-trend reinjection).
The duality of this entry system means you can be present on most local tops and bottoms without having an excessively high number of trade entries. The failure of the first entry can give a signal on the second (divergence, volatility...): use this complementarity to your advantage! If the first signal ends in a loss, wait for confirmation on the second signal.
The trailing stop system is activated as soon as an entry signal is detected, and if no entry signal is still active. The trade is closed when the candle closes above or below the trailing stop.
Two possible settings:
"passive": (multiply 5, period 8), least reactive trailing stop, willing to hold the trade
"balanced": (multiply 1, period 4): versatile trailing stop, ideal compromise.
These trailing stop parameters are optimized by the automated backtesting strategy of our IRL indicator, which indicates precise reversal levels. To use them in this specific context, you need to be in timeframe m1. For more information on these levels, please see my profile!
The stop loss for each reversal corresponds to the last high/low of the last 4 candles. It's possible to display this value above or below the trade entry signal, which makes it easier to understand the practical application of the signals presented.
An option for displaying more information on trades executed once closed. When an exit signal is detected (stop loss OR trailing stop), the candle leading to the trade's closure is marked with a label, providing information on the trade's profit (expressed in R, risk ratio). A second piece of information, in brackets, is the drawup: this corresponds to the maximum unrealized PNL of the closed trade.
The size of these labels can be modified according to the trade's PNL, all managed by profitability thresholds in R (default: 8R, 4R, 1R).
these latest entry signal performance functions optimize the backtesting process and the identification of relevant reversal strategies, by reversing the methodology: "where are the biggest profits made over such and such a period, what were the signals of my studied strategy, ...". The drawup, for its part, will enable you to appreciate an entry during a volatile period, which can sometimes lead to substantial short-term gains, but which the trailing stop exit failed to capitalize on!
A second signal corresponds to an additional confirmation, generally later in the timing, and informed by candle coloring. Based on RSI convergence/divergence, and to be used as a possible complementary filter to entry signals. Independent and without impact on the entry and exit signals studied.
This indicator has been developed in synergy with our other published technical indicators for identifying reversal zones / reversal timings, and offers a guideline for those less experienced in frontrunning/counter-trending. AC should be the sinequa none for a reversal entry, and will enable you to appreciate the reversal setups studied!
Parabolic SAR + EMA 200 + MACD SignalsParabolic SAR + EMA 200 + MACD Signals Indicator, a powerful tool designed to help traders identify optimal entry points in the market.
This indicator combines three popular technical indicators: Parabolic SAR (Stop and Reverse), EMA200 (Exponential Moving Average 200) and MACD (Moving Average Convergence Divergence) - to provide clear and concise buy and sell signals based on market trends.
The MACD component of this indicator calculates the difference between two exponentially smoothed moving averages, providing insight into the trend strength of the market. The Parabolic SAR component helps identify potential price reversals, while the EMA200 acts as a key level of support and resistance, providing additional confirmation of the overall trend direction.
Whether you're a seasoned trader or just starting out, the MACD-Parabolic SAR-EMA200 Indicator is a must-have tool for anyone looking to improve their trading strategy and maximize profits in today's dynamic markets.
Buy conditions
The price should be above the EMA 200
Parabolic SAR should show an upward trend
MACD Delta should be positive
ُSell conditions
The price should be below the EMA 200
Parabolic SAR should show an downward trend
MACD Delta should be negative

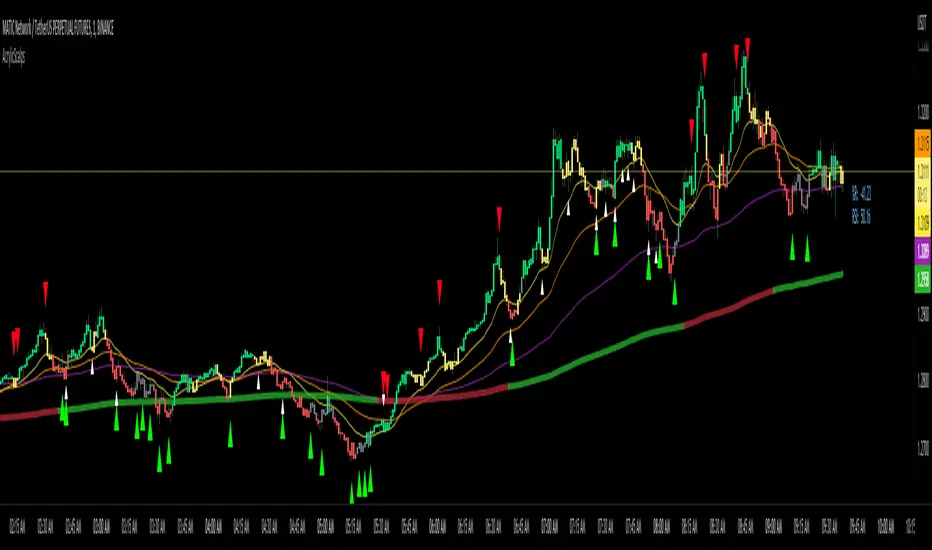
B/S Volume with Timeframe InputDaytrading For Success's volume indicator with timeframe input selection added. Example shown is 1 minute time frame with 5 minute input selected.

VWAP + 2 Moving Averages + RSI + Buy and SellIndicator: VWAP + 2 Moving Averages + RSI + Buy and Sell
Buy and Sell Arrows (Great for use alone or in conjunction with other scripts on the chart)
This indicator displays BUY (BUY) and SELL (SELL) arrows on the chart based on a combination of moving averages, VWAP and RSI. Arrows are a visual way to identify trading opportunities and can be useful for traders who want to follow a strategy based on these conditions.
The indicator uses two moving averages (20 and 50 periods) to identify upward crosses (buy) and downward crosses (sell). In addition, it takes into account VWAP (Volume Weighted Average Price) and RSI (Relative Strength Index) as additional filters to confirm buy and sell signals.
This script is great for use both independently and in conjunction with other indicators and strategies. You can combine it with other indicators and customize it to your preferences to create a more comprehensive trading strategy.
Please remember that this indicator is provided for educational purposes only and does not constitute financial advice. It is always recommended to carry out a thorough analysis before making any trading decisions.
Give this indicator a try and enjoy clear visualization of buy and sell arrows on your chart. Happy trading!

Inside candle (Inside Bar) Strategy- by smartanuThe Inside Candle strategy is a popular price action trading strategy that can be used to trade in a variety of markets. Here's how you can trade the Inside Candle strategy using the Pine script code provided:
1. Identify an Inside Candle: Look for a candlestick pattern where the current candle is completely engulfed within the previous candle's high and low. This is known as an Inside Candle.
2. Enter a Long Position: If an Inside Candle is identified, enter a long position at the open of the next candle using the Pine script code provided.
3. Set Stop Loss and Take Profit: Set a stop loss at a reasonable level to limit your potential losses if the trade goes against you. Set a take profit at a reasonable level to take profit when the price reaches the desired level.
4. Manage the Trade: Monitor the trade closely and adjust the stop loss and take profit levels if necessary. You can use the Pine script code to automatically exit the trade when the stop loss or take profit level is hit.
5. Exit the Trade: Exit the trade when the price reaches the take profit level or the stop loss level is hit.
It's important to note that the Inside Candle strategy is just one of many strategies that traders use to trade the markets. It's important to perform your own analysis and use additional indicators before making any trades. Additionally, it's important to practice proper risk management techniques and never risk more than you can afford to lose.

Long & Short / Bullish & Bearish & Neutral / Sentiment LONG and SHORT signal generation:
The LONG and SHORT signals in this script are generated based on a combination of sentiment, price strength, and volume strength calculations. The following parameters and calculations are used in determining these signals:
Sentiment:
The sentiment is calculated using a Simple Moving Average ( SMA ) of the SMO (oscillator) over a specified sentiment_length.
Price Strength:
The price strength is calculated as the percentage change in the closing price compared to the previous closing price.
Volume Strength:
The volume strength is calculated as the percentage change in the trading volume compared to the previous trading volume .
Custom Oscillator:
This oscillator is calculated as the difference between price strength and volume strength, followed by calculating its SMA over a specified strength_length.
The LONG signal is triggered when:
The sentiment_diff (difference between the oscillator and the SMA oscillator) is greater than 0, and the close price is greater than the fast EMA ( Exponential Moving Average ) of the close price, OR
The custom oscillator crosses over its SMA , and the close price is greater than the open price, and the close price of the previous period is greater than the close price of two periods ago.
The SHORT signal is triggered when:
The sentiment_diff is less than 0, and the close price is less than the fast EMA of the close price, OR
The custom oscillator crosses under its SMA , and the close price is less than the open price, and the close price of the previous period is less than the close price of two periods ago.
Color change description:
The color change in this script is based on the relationship between the close price and the highest/lowest SMAs of the high/low price over a specified lengthInputRoR. The following colors are used:
Green:
Bullish area (close price is greater than the highest SMA of the high price)
Red:
Bearish area (close price is less than the lowest SMA of the low price)
Yellow:
Neutral area (close price is between the highest and lowest SMAs of the high and low prices)
Color meaning description:
Yellow (Neutral Area):
This color indicates that the close price is between the highest and lowest SMAs of the high and low prices, signaling more caution and uncertainty in the market.
Green ( Bullish Area):
This color represents a bullish market condition where the close price is greater than the highest SMA of the high price, suggesting a higher probability of a successful LONG position.
Red ( Bearish Area):
This color signifies a bearish market condition where the close price is less than the lowest SMA of the low price, indicating a higher probability of a successful SHORT position.
Support and Resistance lines explanation:
Support and resistance lines are calculated based on the highest and lowest prices over a specified number of periods. These lines are used to identify significant price levels where the market may experience increased buying or selling pressure.
Resistance:
The resistance line is calculated using the highest high price over a specified number of periods. This line represents a price level where selling pressure is expected to increase, making it more difficult for the price to rise further. Traders often consider resistance levels as potential entry points for SHORT positions or exit points for LONG positions.
Support:
The support line is calculated using the lowest low price over a specified number of periods. This line represents a price level where buying pressure is expected to increase, making it more difficult for the price to fall further. Traders often consider support levels as potential entry points for LONG positions or exit points for SHORT positions.
The resistance and support lines are plotted using different colors to help traders visualize the important price levels where the market may experience a reversal or consolidation.
Final Words:
This script provides LONG and SHORT signals and alerts based on a combination of sentiment, price strength, and volume strength calculations. It is designed to serve as a high-quality aid for executing well-informed trading ideas. However, it's important to note that the LONG and SHORT signals and alerts generated by this script should not be considered as trading advice. Traders should always conduct their own research and analysis before making any trading decisions. The script aims to assist in visualizing important market trends and price levels, helping traders make more informed decisions based on their personal trading strategies.
Ema ScalpThis is another simple strategy based on ema
Entry Buy - 1) when close crossover ema then buy and only open one trade till it not close
2) if previous buy trade is profitable open another trade and check again trade is profitable or not
3)if trade is not profitable reset and wait for sell condition...
Entry Sell -1) when close crossunder ema then sell and only open one trade till it not close
2) if previous sell trade is profitable open another trade and check again trade is profitable or not
3) if trade is not profitable reset and wait for buy condition.....
stop loss and take profit is percentage based ...

Buy Sell Signal ScannerThis is a higher timeframe scanner that detects whether the market is bullish or bearish according to our Buy Sell Indicator on up to 8 different timeframes. It can also be customized to scan different tickers so you can scan tickers that typically move with or against the ticker you are trading for extra confirmation. The scanner can be configured to use the exact same settings that you use with the Buy Sell Indicator so everything is using the same formula.
For price action identification, scalp mode looks at the candle body, candle wicks and size of the body and wicks and compares all of that to the previous candle to see if it is bullish or bearish. Swing mode will compare the current candle to the last 2 candles and long swing mode will compare the current candle to the last 10 candles. It’s looking for higher highs & lower lows, if the candle body is large or small and much more.
There are also filters that prevent signals from being given when the candle is small or has not made a higher high or lower low compared to the previous candle and multiple other filters to help hold positions longer. Once the price action direction has been confirmed, then the script looks at a massive amount of other calculations to determine if a signal should be given or not. These calculations are made up of all of my best indicators combined into a master signal generator as well as more new calculations from things I have learned over time and tested extensively that have not been made available to the public until now.
Price action as well as many other factors will all have to be confirming the direction before a signal can come in, but it reacts very quickly so it can give early signals at the first sign of reversal. Fine tune your settings to match your Buy Sell Indicator settings to get the same signals on the scanner.
HOW TO USE
The scanner will show the higher timeframe in a table on the side of the chart if no other ticker is selected to scan. The timeframe cell will show as green if that timeframe is currently in a bullish signal and red if that timeframe is currently in a bearish signal. If you set it to use a different ticker, the ticker name and timeframe will show up in the table.
The defaults are set up to scan the same ticker as your chart but on higher timeframes. It is set up for a 1 minute chart by default, but each timeframe can be adjusted to suit your preference all the way up to a 1 year timeframe.
You can set the scanner to look at different tickers as well which is very useful for getting confirmation by setting it to scan other tickers that usually move in the same direction or opposite of the ticker you are trading.
TRADE MODE
The signal settings allow you to match the scanner settings to your settings on the Buy Sell Indicator. There is scalp mode, swing mode and long swing mode. All 3 settings use the same calculations for signals, but they have different price action filters to help hold swings longer. Scalp mode will only be looking at the current bar compared to the previous bar, but swing mode will look at the current bar compared to the previous 2 candles. Long swing mode will compare the current candle to the last 10 candles to hold positions even longer.
There is also a candle trailing length that can be adjusted as well to suit your preference. This adds a filter that ensures the current candle is closing higher than the previous X number of candles you choose for a bull signal and is closing lower than X number of previous candles for a bear signal. Make sure to match these settings to how your Buy Sell Indicator is configured to get matching results.
You can also move the position of the scanner table to any part of the chart in the settings menu at the bottom.
ALERTS
There are alerts set up that will give you a signal when all timeframes are bullish on candle close and another signal that will alert when all timeframes are bearish on candle close. There is also an alert for when the first 4 timeframes & ticker are bullish and the last 4 timeframes & ticker are bearish or the opposite. This is useful for looking at forex markets and setting the first 4 to tickers that move together and the last 4 to tickers that move opposite.
MARKETS
This Buy Sell Signal Scanner can be used on any market with price data such as stocks, crypto, forex and futures.
TIMEFRAMES
This Buy Sell Signal Scanner can be used on any timeframe. And will scan any of our available timeframes between 1 minute and 1 year.
PAIRINGS
We recommend pairing this Buy Sell Signal Scanner with our Buy Sell Indicator so you can get signals and price action colored candles on the ticker you are trading and then use the scanner for confirmation of trend on higher timeframes and trade with the trend.

Buy Sell IndicatorThis Buy Sell Indicator uses price action calculations to determine the bullish or bearish nature of the current market and then calculates if the price action is strong enough to give a signal. The indicator is fully adjustable so you can fine tune it to fit your specific trading style with Scalp Mode, Swing Mode, Long Swing Mode and candle trailing length. It also has an automatic trailing stop loss and take profit features that can be customized.
For price action identification, scalp mode looks at the candle body, candle wicks and size of the body and wicks and compares all of that to the previous candle to see if it is bullish or bearish. Swing mode will compare the current candle to the last 2 candles and long swing mode will compare the current candle to the last 10 candles. It’s looking for higher highs & lower lows, if the candle body is large or small and much more.
There are also filters that prevent signals from being given when the candle is small or has not made a higher high or lower low compared to the previous candle and multiple other filters to help hold positions longer. Once the price action direction has been confirmed, then the script looks at a massive amount of other calculations to determine if a signal should be given or not. These calculations are made up of all of my best indicators combined into a master signal generator as well as more new calculations from things I have learned over time and tested extensively that have not been made available to the public until now.
Price action as well as many other factors will all have to be confirming the direction before a signal can come in, but it reacts very quickly so it can give early signals at the first sign of reversal. Fine tune your settings to match your trading style from within the input settings and then look for potential reversal areas and take signals that appear in that reversal area for the highest probability of winning trades. I decided not to include any support or resistance or similar tools in order to keep the indicator lightweight and respond as fast as possible as well as update the candles as quickly as possible. This also lets you keep your charts clean and only use the support & resistance tools that you prefer since everyone has a different trading style.
HIGHER TIMEFRAME AND/OR MARKET SCANNER
There is also a higher timeframe scanner available as a separate indicator titled Buy Sell Signal Scanner that you can find on my profile. It can be customized to show you up to 8 higher timeframes of your current ticker or any other ticker you like. This is useful for trading with the trend of the higher timeframes or you can set it to the same timeframe as your chart and scan other tickers that usually move together or opposite for extra confirmation. Each ticker/timeframe will be displayed in a table on the chart and colored green or red depending if it is currently bullish or bearish. If you are using a different timeframe than the current chart, then it will display the timeframe next to the ticker name.
HOW TO USE
CANDLES
The candles will paint blue or orange according to the price action detected. This can be customized or turned on/off and will follow the price action according to the trade mode settings. Using these candle colors helps to get rid of anxiety when watching candles come in that are in the opposite direction of your trade. I highly recommend using this feature as it helps you control your emotions much better during trading.
TRADE MODE
The trade mode settings let you choose between Scalp Mode, Swing Mode and Long Swing mode. They all use the same price calculations, but each mode has its own filters to hold through ranging price action in a slightly different way. You can also adjust the candle trailing length to make it hold positions even longer. The candle trailing length will not let a signal come in until there is a higher high or lower low than the previous X number of candles from this setting.
Scalp mode will get you in and out of positions the earliest. Swing mode will hold signals longer by filtering out ranging price action. Long swing mode uses even more filtering to hold positions even longer than swing mode and let price range more without calling out every move. Each one of these modes will also be affected by the candle trailing length.
It should be noted that using swing mode and long swing mode or increasing the candle trailing length will make the signals not perform as well when price action is whipsawing up and down and also will not have as early of entries and exits as scalp mode due to the range breaks that are needed for a signal to be given. That being said, it will hold positions much longer when markets are trending and still have great entries and exits, so use the longer settings when markets are trending and then switch to scalp mode when the market is chopping around and moving sideways for best results.
Scalp Mode
Swing Mode
Long Swing Mode
STOPLOSS
There is an automatic stoploss feature as well. It calculates the average candle height and adds/subtracts that from the highest high or lowest low of the past X number of candles according to your Stoploss Candle Trail Length. Use a lower number for a tight trailing stoploss and increase the number for a more loose stoploss. You can also customize the color of the stoploss line and label or turn it off if you prefer. The stoploss will update on every candle for proper trailing but it will not switch to an opposing signal until the candle closes with a new signal.
TAKE PROFIT
There is an automatic take profit level generator as well that also uses the average candle height for its calculations. There are 3 settings that let you set the average candle size multiplier for each take profit level. The default settings are evenly spaced at 3, 6 and 9 times the average candle height from where the most recent signal locked in at candle close. Adjust these numbers to suit your preference. You can also customize the color of the take profit lines and label or turn it off if you prefer. The take profit levels will not change to an opposing signal until the opposing signal is confirmed on the candle close.
Auto Stoploss & Take Profit
SIGNALS
The default signals are green and red arrows. The color can be adjusted in the settings or you can turn the bull or bear signals on or off if you only want entry signals for the direction of the trend.
VOLUME SPIKE SUPPORT & RESISTANCE
There are volume based auto support & resistance levels that are off by default, but can be turned on in the settings. It calculates the average volume over multiple periods and gets the average of that and then looks for volume spikes that were greater than the average, multiplied by the volume spike multiplier in the settings. If set to 3, then the volume spike will need to be 3 times or higher than the average volume bar for a level to show up. Increase or decrease this number to get more or less levels.
VOLUME WARNING
If volume is very low compared to normal, then a volume warning label will appear at the top of the chart letting you know that volume is very low and to trade with caution. I recommend not trading during those times though as price can whipsaw very easily.
ALERTS
There are also alerts that can be triggered for buy signals as well as sell signals. They are set to only send signals when the bar is confirmed so you won’t get alerts for signals that repaint while the candle is still open. You can use these alerts to send signals to your own trading bot if you choose to.
MARKETS
This buy sell indicator can be used on any market with price data such as stocks, crypto, forex and futures.
TIMEFRAMES
This buy sell indicator can be used on any timeframe.
PAIRINGS
We recommend pairing this Buy Sell Indicator with our Buy Sell Signal Scanner so you can check other timeframes and trade with the trend or use the scanner to look at other markets that move together or opposite of the ticker you are trading for extra confirmation of direction.

Alex trading stragedyOverview
This script, named "ALEX TRADING STRATEGY", is a technical trading strategy designed for new investing groups. It uses a combination of various technical indicators to identify potential buying and selling opportunities in the market. The script includes the Relative Strength Index (RSI), Simple Moving Averages (SMA), Exponential Moving Averages (EMA), and Higher High Lower Low (HHLL) strategies to create a complete trading solution.
The user can change the position from long to short in the Input Settings. The script uses bar colors to indicate the current trading position. The script also has exit strategies to help manage the open trades. The user can also set the period for the various indicators used in the strategy.
The script provides various technical indicators and entry/exit signals to make the trading decision easier for the user. It also includes pivot lines, resistance and support levels to help the user make a more informed decision.
This Pine script implements a multi-indicator trading strategy that combines several technical analysis techniques for making trading decisions. The script uses the Relative Strength Index (RSI) to determine overbought and oversold conditions in the market and plots the RSI values on the chart. The RSI values above 70 are considered overbought and plotted as red upward triangles, while the RSI values below 30 are considered oversold and plotted as green downward triangles.
The script also calculates Simple Moving Averages (SMAs) with the user-defined period and plots them along with the Exponential Moving Averages (EMAs) of 20, 50, and 100 periods. Based on the crossover of the close price and the moving averages, the script enters long or short trades. The script sets the trade exit conditions as the low or high crossing the lower or upper band, respectively.
In addition to the moving average crossover, the script uses the highest high and lowest low over a user-defined period to determine long and short entries. The script plots the long and short conditions on the chart as green upward and red downward triangles, respectively. The script allows the user to switch between long and short trades by changing the input settings.
Finally, the script changes the bar colors based on the trade direction, with green bars indicating a long trade, red bars indicating a short trade, and blue bars indicating no trade. Overall, this Pine script provides a comprehensive trading strategy that combines several technical analysis techniques to make informed trading decisions.
HOW TO USE
Input Settings: In the Input Settings section, you can change the long to short position. You can also change the period value (default is 10) used to calculate the Simple Moving Average (SMA) for the Keltner channel.
Indicators: The script uses RSI (Relative Strength Index) with 14 periods as well as multiple EMAs (Exponential Moving Averages) with periods 20, 50, and 100 to help in making trading decisions.
Entry Signals: The script uses two main entry signals: (1) Keltner Channel and (2) HHLL (High-Low). When the closing price crosses above the upper band of the Keltner channel, the script generates a long signal, and when the closing price crosses below the lower band of the Keltner channel, the script generates a short signal. The HHLL strategy generates a long signal when the current high crosses above the highest high of the last "nPeriod" bars, and generates a short signal when the current low crosses below the lowest low of the last "nPeriod" bars.
Exit Signals: The script uses two exit signals: (1) Stop Loss based on Keltner channel and (2) Profit Target based on Keltner channel. The script exits the long position when the closing price crosses below the lower band of the Keltner channel, and the script exits the short position when the closing price crosses above the upper band of the Keltner channel.
To use this script, you will need to have access to a trading platform that supports PineScript, such as TradingView, and attach the script to a chart. The script will then automatically generate entry and exit signals based on the rules described above. It's important to note that this script is just a tool and not a guarantee of profit. As with any trading strategy, it's important to thoroughly test and understand the script before using it for live trading.

Acrylic's 1m/3m Scalper Buy/Sell SignalsAcrylic's Scalper Signals uses a combination of RSI / Stochastic / Williams %R to calculate the perfect entry signals. The script(with it's default settings) has been optimized and thoroughly tested on BTC & ETH 1 and 3 minute time frames. It's intended for quick in and out trades that should only last a few minutes unless a strong trend is caught. Basic knowledge of market structure is needed, as you will not be taking every signal generated by the script.
You also have the option to display all signals regardless of the short term trend that has been confirmed by RSI. This can be good if you're looking for reversal entries at resistance/support levels.
-Large triangle signal: Strongest signal that was confirmed with RSI & Williams %R optimized calculations. (prints at current candle close)
-Small triangle signal: Fractal signal can be used as a late entry signal/continuation. (prints after 2 candle closes)
-Candle colors are matched to stochastic strength for added confluence to enter trades. (Must hide default trading view candles to see these)
-233SMMA color is matched to the extreme short term trend based off of RSI calculations.
Perfect Long Entry Setup Image :
1) EMA21 > EMA55 > EMA100 > SMMA233(Colored green for added confluence) - All pointing up indicating strong trend
2) Enter on pullback to short term EMA after signal candle closes. (Do not take entry if candles closed below 100EMA)
Perfect Short Entry Setup Image :
1) EMA21 < EMA55 < EMA100 < SMMA233(Colored red for added confluence) - All pointing down indicating strong trend
2) Enter on pullback to short term EMA after signal candle closes. (Do not take entry if candles closed above 100EMA)
Feel free to ask questions or leave feedback in the comments, I'm always looking to improve! Thanks!
Buy Sell Calendar [LuxAlgo]The Buy Sell Calendar indicator displays a calendar showing the sentiment for the current day/month. Three different methods can be used to determine this sentiment.
The calendar can also highlight the percentage of bullish days/months for a month/year.
🔶 SETTINGS
Frequency: Calendar frequency, options include "Daily" and "Monthly"
Sentiment Method: Method used to determine the sentiment for the day/month, options include: "Linreg", "Accumulated Deltas", and "Max/Min"
Timezone Offset: UTC time zone offset.
Limit Date: Limit date used by the calendar, the sentiment of days/months outside this limit will not be returned.
🔹 Calendar
Show Calendar: Determines whether to display or hide the calendar.
Location: Location of the calendar on the chart.
Size: Calendar size.
🔶 USAGE
The proposed script can allow users to quickly determine if a specific day/month is considered bullish or bearish. A green cell is used for bullish days/months, while a red one is used for bearish days/months.
Additionally vertical lines are displayed on new days/months with a color highlighting the current sentiment for this specific day/month. Note that this is done retrospectively, the color of a line set at time t might differ at time t+n .
🔶 SENTIMENT METHODS
Determining whether a day/month is bullish or bearish can be done using three different methods. Note that each method makes use of the closing price as the input, and as such can eventually return different results depending on the selected timeframe. Each method is described below:
🔹 Linreg
The Linreg method fit lines between each day/month using the method of least squares and determines if that particular day is bullish or bearish based on the line slope sign. For example, a rising line would indicate a bullish day/month.
🔹 Accumulated Deltas
The method of accumulated deltas simply accumulates bullish and bearish price changes for the current day/month, the result with the highest magnitude determines the sentiment for that day/month.
🔹 Max/Min
The max/min method computes a trailing maximum and a trailing minimum for the current day/month. The sentiment is determined by the price position relative to the average between the obtained maximum/minimum, with a bullish sentiment being determined if price is above the average.

Rotational Gravity OscillatorMade using elements from two Cheatcountry scripts:
Includes a Bollinger Band for bounds that forms a trend follower based on the 0 point.
Includes CheatCountry color code signals, different color scheme. Bright colors are strong signals, ark are weak, green bull, red bear, the basics.
Switches for Bollinger Band color codes, which can actually be useful signals.
This oscillator can be used for divergences, trends, signal strength, confirmation, volatility readings, you name it.
It is a comparative oscillator, that compares adaptively smoothed, weighted modified Change of Gravity oscillators between 2 symbols and multiple lengths to determine directional momentum as one asset compares to another.
The default uses the Crypto TOTAL market cap to help trade cryptocurrencies. You will notice that BTC will give sell signals in uptrends at times. That is because it is being compared to an index of the total Crypto market cap, and since alt-coins move faster, BTC will lag behind this index.
Give CheatCountry a follow, hes one of the MVPs of Tradingview Pinescripters, constantly giving us access to novel new concepts as they are published by professionals.

TwV Market SignalsSignals Indicator
Summary
This indicator allows traders to have in handy short and long signals and estimate the trend of the market.
The indicator draws Long and Short signals depending on the trend analysis. The indicators also use meaningful colors for traders to be able to visually understand the graphs, such us fillings on EMAs, so the possible trend is represented.
The colors used are light green for bullish, red for bearish, dark green for possible bearish to bullish change and purple for possible bullish to bearish change. These colors are applicable to all fillings and summary box.
How to use this indicator
The use of EMAs 10,20 and 50 draw the medium to long term trends, therefore avoiding signals against the trend. Furthermore the EMAs will advise possible change in trends, specially considering the 10 and 20 cross, considering that crossing the 10,20 and 50, might confirm the change in med to long term trend change of the price. This is completely visual in the chart as it tints green for positive trend and yellow to red for negative trend.
The 200 SMA is included as it also gives better confirmation to the trend, the basics tell that when the EMAs mentioned above are below the 200 SMA then the likelihood for entries in long positions are not the best and vice versa for short.
Therefore, the trader shall filter Long and Short Signals accordingly as this EMAs are not used to send Long and Short signals considering that they confirm the trend in a slow pace and not reactively to the price volatility.
There are two strategies built-in within the indicator:
Strategy 1 – Longer time trades and high volatility handling
The Long and Short Signals are based on 14 and EMAs (by default). This two Mas are used to send signals based on their crossovers as they are way more reactive to the price movement.
Trader shall consider that EMAs are used for higher timeframes, therefore the indicator has the possibility to adjust the EMAs and use SMAs or WMAs instead for one or the two parameters (14 and 21).
WMAs react faster to the price volatility so the trader shall adjust this according to the timeframe being used. (Lower timeframes suggested).
This strategy is used for trades that might keep running for longer periods of times.
For reference on what the SMAs, EMAs and WMAs are, please see below sections in the description.
Strategy 2 - Shorter time trades and unhandled high volatility
The Long and Short Signals are bases on HMA. HMAs (Hull Moving Averages) track the price movement and volatility way faster that SMAs, EMAs and WMAs, therefore as the HMA follow the price quicker, it is intended for short time trades even in higher timeframes.
Scalping is not suggested using this strategy as HMA do not handle high volatility even on higher timeframes.
One of the biggest differences from the first strategy is that there is no more than a single HMA length to work with, which is 24 as default.
HMAs calculation is different to other MAs, therefore combining various HMAs lengths looking for crossovers become trend identification a lot less precise. HMAs are not intended to be used with different length crossovers.
Exit points = The use of Stochastic and VRVP
Stochastic RSI
It is well known that when Stochastic RSI resets when overbought or oversold therefore traders have within a summary box the possibility to check whether the K & D lines in the Stochastic RSI hace crossed over bullish or bearish.
Although the crossover is not mandatory for a change trend, the crossover might be used by the trader to exit a position considering that the price might move on the opposite direction.
Traders shall look at the summary box, where bullish and bearish crossovers are shown, so they evaluate their position exit.
Visible Range Volume Profile
The use of the VRVP is to find support and resistance on the price movements. Although high and lows are used as possible supports and resistances, VRVP shows an area of confluence on the order book, where volume of positions are accumulated and that might act as support or resistance depending on the price direction.
Traders can visually activate the VRVP to see the Point of Control (POC) directly on the chart as a line (similar as how a support or resistance would be drawn). Moreover, traders have the ability to see within the summary box, whether to see if the price is above or below the POC, so they clearly know if it is acting as support or resistance.
Price Direction
Trade the market trend is well know to be used to identify possible price direction. It is important not to confuse the longer time trend drawn by the EMAs with the TTM Trend bar color. The TTM trend colors bars according to the price direction, helping traders not to confuse when a red bar appears on an up trend or green bars on a down trend.
This coloring helps traders not to exit trades based on bar coloring, which might psychologically affect when scalping or short-term trading specially.
Originally, the TTM trend is used considering the ADX in and indicator called TTM Squeeze, where the strength of the movement is measured, therefore although candle colors help with the price direction, ADX provides the trader the ability to see whether the direction is losing momentum and then catch the best possible exit before the direction change.
How to use Summary
1. Receive the Long or Short Signals using strategy 1 or 2, depending on the selected in the main menu of the indicator.
2. Evaluate the trend based on the 10,20, 50 and 200 MAs. Filter the Long and Short signals accordingly.
3. Monitor constantly the TTM Trend and the ADX for the direction and strength of the position entered and review if the momentum is being lost, considering step 4 or other possible reasons that might lead to exiting the position.
4. Once entered to a position evaluate constantly the Stochastic RSI bearish or bullish crossover or POC value on screen or summary box to exit the position.
Terminology basics
Trend indicators
Exponential Moving Average (EMAs): The base indicator is composed of moving averages of 10, 20 and 55 exponential periods, to determine a possible bullish or bearish trend (EMA Crossing)
Simple Moving Average (SMA): The base indicator is composed of a moving average of 200 simple periods, which in conjunction with the EMAs can lead to estimate potential upward or downwards moves, as well as possible resistances. (SMA Positioning)
Weighted moving average (WMA): It is a technical indicator that traders use to generate trade direction and make a long or short position. It assigns greater weighting to recent data points and less weighting on past data points. (WMA Crossing)
Strength and S/R indicators
VPVR (Volume Profile Visible Range): It allows to determine the Point of Control (POC) which is the node with the highest volume profile. This can be used as an important retest point or to calculate potential support and resistance. The POC level is represented with a red dotted line in the graph.
The VPVR is a simplified version of the “TwV Multi-timeframe Dynamic VRVP” that you can find for free use in my profile. This version calculates the main’s timeframe POC and also has the possibility to be fixed range if the trader enables it from the menu. (Dynamic range by default).
ADX (Average Directional Index): The ADX helps the indicator to estimate the strength of the movement, always considering the DI+ and DI- to not go against the trend strength. This is represented as summary text in a table.
/
Exit indicator
Stochastic RSI: It is an indicator used in technical analysis that ranges between zero and a hundred and is created by applying the Stochastic oscillator formula to a set of relative strength index (RSI) values rather than to standard price data. Using RSI values within the Stochastic formula gives traders an idea of whether the current RSI value is overbought or oversold (Exit zones)
/
Summary Panel
This panel allows the trader to have a summary of the current status (bearish or bullish) of some of the most determinant indicators within the strategy. It has the following characteristics:
It is placed on the right bottom side of the chart by the default. Traders can change its position or hidden it through the main menu of the indicator.
Its colors change according to the indicator’s values and constant change for easier detection.
The summary box shows the projection for each of the indicators (Trend, Stochastic, EMA, VPVR and ADX).
The summary box is multi-language (English and Spanish), which can be changes in the main menu of the indicator
Alerts
Within the indicator’s menu, you can set up alerts for all long, short, close long and close short signals, which might come in handy when the trader would like to have notifications on the Trading View website, desktop app or phone apps. Furthermore, there are also signals for possible exit points, which can also be activated from the indicator’s menu.

Ma PullbackThis indicator is based on ema band....
condition for buy =>
1) price should crossover ema band
2) price pullback on ema band but price should not close below lower band
3)after pullback green candle should close above ema band
4)check candle size when its crossing ema band
5)check previous canlde 7 should not touching cloud so (we can reduce range signal)
condition for sell =>
1) price should crossunder ema band
2) price pullback on ema band but price should not close above upper band
3)after pullback red candle should crossunder ema band
4)check candle size when its crossing ema band
5)check previous canlde 7 should not touching cloud so (we can reduce range signal)
this indicator also for education purpuse how we can make pullback condition....

Orb breakout Buy condition =>ORB range 9:20-9:25. On 5 min TF if candle breaks high and next candle break high of that candle. buy signal when third candle breaks high of 2nd candle
Sell condition=>ORB range 9:20-9:25. On 5 min TF if candle breaks low and next candle break low of that candle. sell signal when third candle breaks low of 2nd candle
this indicator is extended version of my previous indicator i got a comment request from @RISHISAKHARE to devlope indicator based on above mention rule ....

HMA Breakout Buy/Sell indicator for Scalping & Intraday - ShyamHi All,
This is a very simple indicator which provides the buy signal, when the moving average lines turns Green and sell signal, when the moving average signal turns red. This can be used for both intraday and scalping method with different timeframes. But best time frame is 5 minutes.
Buy Signal >>> Line turns GREEN (Use trailing SL to cover maximum profit)
Sell Signal >>> Line turns RED (Use trailing SL to cover maximum profit)
No trade >>> Line turns GRAY
Best timeframe >>> 5 minutes
Thanks,
Shyam

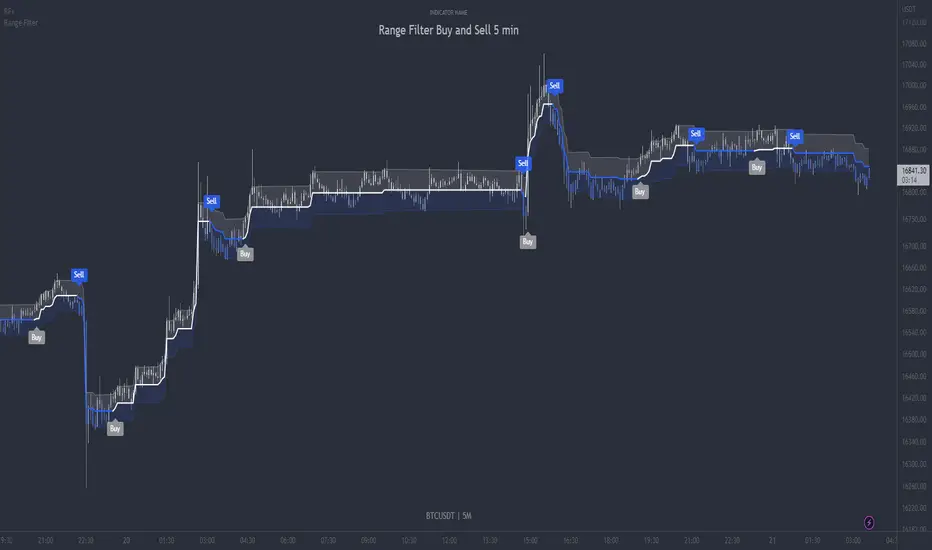
Range Filter Buy and Sell 5min - guikroth versionRange Filter Buy and Sell 5min - the @guikroth version, republished.
Since this popular version of the Range Filter is no longer available via the original author, I republish it here under the same name.
This version remains true to the guikroth version from the calculations to the default settings and comments in the code, with the exception of an update to the latest version of PineScript, minor styling adjustments and the addition of an all-in-one 'buy or sell' alert option.
The guikroth version was a simplified modification of the original Range Filter by @DonovanWall .
Including having just 3 bar colours based on the filtered price trend, different source input options to the original, and the addition of buy and sell signals and alerts based upon the Range Filter colour change. It consisted of just three inputs; source, sampling period, and range multipler. With the update to version 5, external indicators can also be used as inputs, for example using a VWAP or EMA loaded on your chart as the input on the Range Filter is now also possible.
What is the Range Filter?
As the author of the original Range Filter describes it:
"This is an experimental study designed to filter out minor price action for a clearer view of trends. Inspired by the QQE's volatility filter, this filter applies the process directly to price rather than to a smoothed RSI .
First, a smooth average price range is calculated for the basis of the filter and multiplied by a specified amount.
Next, the filter is calculated by gating price movements that do not exceed the specified range.
Lastly the target ranges are plotted to display the prices that will trigger filter movement.
Custom bar colors are included. The color scheme is based on the filtered price trend."
Popularity of the Range Filter
The Range Filter is a very popular and effective indicator in its own right, with adjustments to the few simple settings it is possible to use the Range Filter for helping filter price movement, whether helping to determine trend direction or ranges, to timing breakout or even reversal entries. Its practical versatility makes it ideal for integrating it's signals into a variety of trading strategies or even other indicators.
With many thanks to the authors of the previous and original versions; @guikroth and @DonovanWall .