Volume Delta Candles [LuxAlgo]Volume Delta Candles provides insights about Intrabar trading activity in an easy-to-interpret manner. Lower timeframe or real-time data is used for displaying Volume Delta percentage against the total volume as a coloured bar part.
The script also highlights the intrabar price with the maximum trading activity, as well as complementary information.
🔶 USAGE
The tool focuses on intrabar volume to provide more information about the trading activity associated with a candle, without having to use an external volume indicator.
Each indicator components is further explained below:
🔹 Volume Delta
The volume delta is obtained by the difference between buy volume and sell volume, where buy volume is the volume associated with a bullish intrabar candle, and sell volume with a bearish intrabar candle.
Positive volume delta is displayed with a green candle area, while negative delta is displayed with a red candle area.
🔹 Bar Coloring
The script displays VD as a percentage of the whole, or from the candle half, depending on the setting ' Display '.
Bars can be coloured as follows:
Full (100%) when Display is set at ' Full Bar '
Half (50% or 100% of half a bar) when Display is set at ' Half Bar '
A negative VD (more bearish than bullish volume) will fill the bar from the top (or centre) of the bar towards the bottom, and a positive VD will fill a bar from the bottom (or centre) of the bar towards the top.
A negative VD on a green candle will show a red-coloured VD against a green-bordered candle. On the other hand, a positive VD on a red candle will show a green-coloured VD against a red-bordered candle.
Colours for VD sentiment opposite to the candle sentiment can be set differently if desired.
🔹 Highest Volume Price Level
The script displays a white (black on light mode) line highlighting the intrabar price level with the highest volume.
When ' Show Previous Max Volume Price ' is checked, a white (black on light mode) dot is displayed 1 bar to the right.
🔶 DETAILS
🔹 Tick/LTF data
The above example used Lower TimeFrame (LTF) data.
The following example uses real-time tick data ( Settings -> Data From )
Both options, LTF or tick data, will show a vertical dotted line where the data starts.
🔹 LTF settings
When ' Data from ' LTF is chosen and ' Auto ' enabled, the LTF will be the nearest possible x times smaller TF than the current TF. When 'Premium' is disabled, the minimum TF will always be 1 minute to ensure TradingView plans lower than Premium don't get an error.
Examples with current Daily TF (when Premium is enabled):
500 : 3 minute LTF
1500 (default): 1 minute LTF
5000: 30 seconds LTF (1 minute if Premium is disabled)
🔹 Notes
Different LTFs give different data, which means different results; this doesn't mean it isn't correct; they are just different data sets.
(LTF is displayed at the top right corner)
To ensure maximum visibility of values, we recommend using Bars from the Bar's style menu.
🔶 SETTINGS
Data from: Lower TimeFrame or real-time Tick data
Resolution: LTF setting
Auto + multiple: Adjusts the initial set resolution
Premium: Enable when your TradingView plan is Premium or higher
🔹 Intrabar Data
Colours
Display: Full/Half bar
Show previous max volume price: White/black dot, showing previous highest volume price level
🔹 Table
Show TF: Show LTF at the top right corner
Colour + table text size
🔹 Details
Show details: label with 'Volume', 'Delta' (VD) and '%'
See USAGE for more information
Candle

Truly Bullish & Bearish CandleThis Pine Script indicator identifies and highlights truly bullish and bearish candles on your chart. Truly bullish candles are characterized by a strong bullish close significantly above the specific percentage, suggesting strong buying pressure. Conversely, truly bearish candles exhibit a strong bearish close significantly below the specific percentage, indicating strong selling pressure. By identifying these candles, traders can gain insights into potential shifts in market sentiment and make more informed trading decisions.
Key Features:
Identifies truly bullish and bearish candles based on strong open/close differentials.
Highlights these candles on the chart for easy visualization.
Helps traders identify potential reversals or continuations in market trends.
Customizable parameters for fine-tuning to suit individual trading strategies.
Compatible with various timeframes and trading instruments.
Usage Instructions:
Apply the indicator to your chart.
Configure the settings according to your preferences.
Look for highlighted truly bullish and bearish candles as potential entry or exit signals.
Consider additional analysis and risk management strategies to confirm trading decisions.
Disclaimer: This indicator is provided for informational and educational purposes only. It is not intended as financial advice or trading recommendations. Trading involves risks, and it's essential to conduct thorough research and practice proper risk management techniques.

Three Inside [TradingFinder] 3 Inside Up & Down Chart Patterns🔵 Introduction
"3 inside up" and "3 inside down" denote a duo of candlestick reversal patterns, each comprising three individual candles, commonly observed on candlestick charts.
These patterns manifest as a sequence of three candles, signaling a potential loss of momentum in the current trend and a potential reversal in direction.
This pattern consists of 3 consecutive candles and can be either "bullish" or "bearish".
In the bullish pattern, known as "Inside Up," emerging at the conclusion of a downtrend, the final candle must exhibit bullish characteristics, while the third candle from the end must display bearish traits.
Conversely, in the bearish pattern, termed "Inside Down," occurring at the culmination of an uptrend, the last candle must demonstrate bearish behavior, with the third candle from the end reflecting bullish attributes.
🔵 How to Use
Using this indicator is very simple. Filtering "Strong 3 Inside Bar" and "Weak 3 Inside Bar" is a feature available in the settings section. You can turn the filter "On" or "Off." By default, the "Filter" is set to "On."
" Filter: On ":
" Filter: Off ":
🔵 How to Display
For better display and differentiation of "Strong 3 Inside Bar" and "Weak 3 Inside Bar," when the "Filter: On" is active, the 3 Inside Bars are displayed in green and red colors. When the "Filter: Off" is active, the 3 Inside Bars are displayed in blue and black colors.

Dark Cloud [TradingFinder] Piercing Line Reversal chart Pattern
🔵 Introduction
"Reversal candlestick patterns" are among the Japanese candlestick patterns considered as alerts for a potential change in the current price trend. It is often assumed that by identifying reversal candlestick patterns, the price trend will definitely change, either from bullish to bearish or from bearish to bullish. However, this claim is not entirely accurate, and a change in price trend does not always mean a reversal.
Nonetheless, the importance of reversal candlestick patterns remains significant. By recognizing these patterns, you can better predict changes in the trend with higher probability and make better trading decisions.
🔵 Dark Cloud
The "Dark Cloud" pattern occurs when, after an upward trend, buyers continue to drive the price up in the first candle. However, in the next candle, with sellers entering and increasing selling pressure, the price starts to decrease compared to the close of the previous candle.
This price decrease is significant enough that in the last candle, the price goes lower than the open of the previous candle, serving as a warning sign for a potential change in price trend.
The fundamental principles for the formation of the "Dark Cloud" pattern include :
1.Two candles consisting of a positive candle (first candle) and a negative candle (second candle) whose main body should be above the halfway point of the first candle's main body but does not completely cover it.
2.The color of the main body of the second candle should be opposite to the color of the main body of the first candle.
Factors affecting the strength of the "Dark Cloud" pattern include :
1.The length of the bodies of both candles, especially the second candle, which increases the strength of the pattern.
2.The gap between the two bodies can also indicate the strength of the pattern.
3.The absence of a lower shadow in the second candle also indicates the strength of the pattern.
4.If the pattern forms in a price resistance range, it has more strength.
🔵 Piercing Line
The "Piercing Line" pattern occurs when, after a downward trend, sellers decrease the price by offering their shares on the first day. However, on the next day, with buyers entering and increasing demand, the price starts to increase compared to the close of the previous day.
This increase is significant enough that in the last candle, the price goes higher than the open of the previous day, serving as a warning sign for a reversal in the price trend. Overall, this pattern is the opposite of the "Dark Cloud" pattern and occurs under a bearish trend.
The fundamental principles for the formation of the "Piercing Line" pattern include :
1.Two candles consisting of a negative candle (first candle) and a positive candle (second candle) whose main body should be above the halfway point of the first candle's main body but does not completely cover it.
2.The color of the main body of the second candle should be opposite to the color of the main body of the first candle.
Factors affecting the strength of the "Piercing Line" pattern include :
1.The length of the bodies of both candles, especially the second candle, which increases the strength of the pattern.
2.The gap between the two bodies can also indicate the strength of the pattern.
3.The absence of an upper shadow in the second candle also indicates the strength of the pattern.
4.If the pattern forms in a price support range, it has more strength.
🔵 How to Use
The "green circle" symbol corresponds to the "Strong Piercing Line" signal, the "blue triangle" symbol corresponds to the "Weak Piercing Line" signal, the "red circle" symbol corresponds to the "Strong Dark Cloud" signal, and the "red triangle" symbol corresponds to the "Weak Dark Cloud" signal.
🔵 Setting
Using the "Show Dark Cloud" and "Show Piercing Line" buttons, you can enable or disable the display of Dark Cloud and Piercing Line.

CandleStick [TradingFinder] - All Reversal & Trend Patterns🔵 Introduction
"Candlesticks" patterns are used to predict price movements. We have included 5 of the best candlestick patterns that are common and very useful in "technical analysis" in this script to identify them automatically. The most important advantage of this indicator for users is saving time and high precision in identifying patterns.
These patterns are "Pin Bar," "Dark Cloud," "Piercing Line," "3 Inside Bar," and "Engulfing." By using these patterns, you can predict price movements more accurately and therefore make better decisions in your trades.
🔵 How to Use
Pin Bar : This pattern consists of a Candle where "Open Price," "Close Price," "High Price," and "Low Price" form the "Candle Body," and it also has "Long Shadow" and "Short Shadow." In the visual appearance of the Pin Bar pattern, we have a candle body and a pin bar shadow, where the candle body is smaller relative to the shadow.
Just as the candle body plays an important role in analysis, the pin bar shadow can also be influential. The larger the pin bar shadow, the stronger the expectation of a trend reversal.
When a "bearish pin bar" occurs at resistance or the chart ceiling, it can be predicted that the price trend will be downward. Similarly, at support points and the chart floor, a "bullish pin bar" can indicate an upward price movement.
Additionally, patterns like "Hammer," "Shooting Star," "Hanging Man," and "Inverted Hammer" are types of pin bars. Pin bars are formed in two ways: bullish pin bars have a long lower shadow, and bearish pin bars have a long upper shadow. Important: Displaying "Bullish Pin Bar" is labeled "BuPB," and "Bearish Pin Bar" is labeled "BePB."
Dark Cloud : The Dark Cloud pattern is one type of two-candle patterns that occurs at the end of an uptrend. The 2-candle pattern indicates the shape of this pattern, which actually consists of 2 candles, one bullish and one bearish. This pattern indicates a trend reversal and is quite powerful.
The Dark Cloud pattern is seen when, after a bullish candle at the end of an uptrend, a bearish candle opens at a higher level (weakly, equal, or higher) than the closing point of the bullish candle and finally closes at a point approximately in the middle of the previous candle. In this indicator, the Dark Cloud pattern is identified as "Wick" and "Strong" .
The difference between these two lies in the strictness of their conditions. Important: Strong Dark Cloud is labeled "SDC," and Weak Dark Cloud is labeled "WDC."
Piercing Line : The Piercing candlestick pattern consists of 2 candles, the first being bearish and consistent with the previous trend, and the second being bullish. The conditions of the pattern are such that the first candle is bearish and a price gap is created between the two candles upon the opening of the next candle because its opening price is below (weakly equal to or less than) the closing price of the previous candle.
Additionally, its closing price must be at least 50% above the red candle.
This means that the second candle must penetrate at least 50% into the first candle. Important: Strong Piercing Line is labeled "SPL," and Weak Piercing Line is labeled "WPL."
3 Inside Bar (3 Bar Reversal) : The 3 Inside Bar pattern is a reversal pattern. This pattern consists of 3 consecutive candles and can be either bullish or bearish. In the bullish pattern (Inside Up) formed at the end of a downtrend, the last candle must be bullish, and the third candle from the end must be bearish.
Additionally, the close price must be more than 50% of the third candle from the end. In the bearish pattern (Inside Down) formed at the end of an uptrend, the last candle must be bearish, and the third candle from the end must be bullish. Additionally, the close price must be less than 50% of the third candle from the end. Important: Bullish 3 Inside Bar is labeled "Bu3IB," and Bearish 3 Inside Bar is labeled "Be3IB."
Engulfing : The Engulfing candlestick pattern is a reversal pattern and consists of at least two candles, where one of them completely engulfs the body of the previous or following candle due to high volatility.
For this reason, the term "engulfing" is used for this pattern. This pattern occurs when the price body of a candle encompasses one or more candles before it. Engulfing candles can be bullish or bearish. Bullish Engulfing forms as a reversal candle at the end of a downtrend.
Bullish Engulfing indicates strong buying power and signals the beginning of an uptrend. This pattern is a bullish candle with a long upward body that completely covers the downward body before it. Bearish Engulfing, as a reversal pattern, is a long bearish candle that engulfs the upward candle before it.
Bearish Engulfing forms at the end of an uptrend and indicates the pressure of new sellers and their strong power. Additionally, forming this pattern at resistance levels and the absence of a lower shadow increases its credibility. Important: Bullish Engulfing is labeled "BuE," and Bearish Engulfing is labeled "BeE."
🔵 Settings
This section, you can use the buttons "Show Pin Bar," "Show Dark Cloud," "Show Piercing Line," "Show 3 Inside Bar," and "Show Engulfing" to enable or disable the display of each of these candlestick patterns.

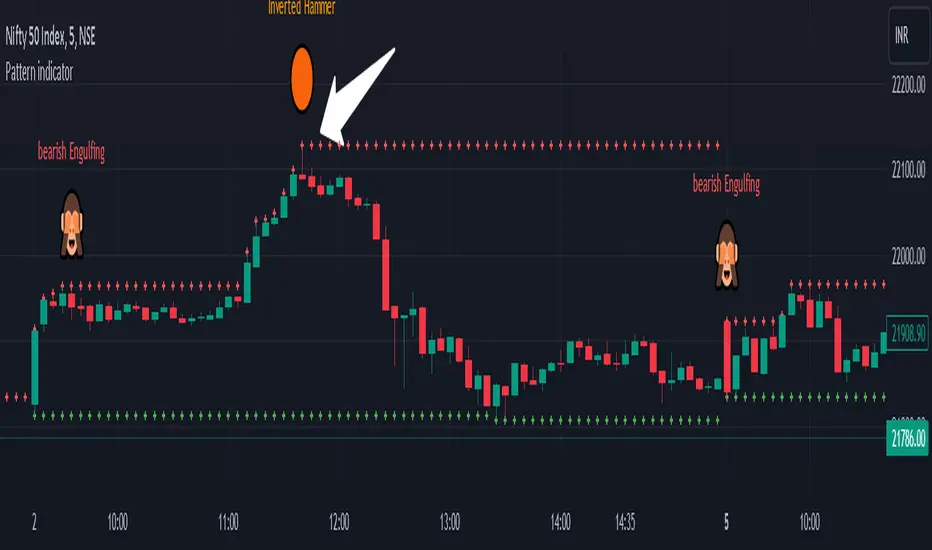
Pattern indicatorRules are pretty simple for this indicator .we are searching candlestick pattern on current day high and low ..
*** Candlestick we are looking for ***
1) Bullish/Bearish Engulfing 2) Bearish/Bullish Harami 3)Hammer/Inverted Hammer
Rule for searching bullish candlestick ====>
1) searching for current day high and day low
2) looking for candlestick as Bullish Engulfing or Bullish Harami or Hammer
3) if we got both rule 1 and rule 2 we are getting label ex- bullish engulfing
4) we can Enable/Disable Candlestick we don't want to search
Rule for bearish candles ====>
1) searching for current day high and day low
2) looking for candlestick as Bearish Engulfing or Bearish Harami or inverted hammer
3) if we got both rule 1 and rule 2 we are getting label ex- bullish engulfing
4) we can Enable/Disable Candlestick we don't want to search
Note -- i have created all indicator calculation ....
Disclaimer: market involves significant risks, including complete possible loss of funds. Consequently trading is not suitable for all investors and traders. By increasing leverage risk increases as well.With the demo account you can test any trading strategies you wish in a risk-free environment. Please bear in mind that the results of the transactions of the practice account are virtual, and do not reflect any real profit or loss or a real trading environment, whereas market conditions may affect both the quotation and execution
Candlesticks Patterns [TradingFinder] Pin Bar Hammer Shooting🔵 Introduction
Truly, the title "TradingView" doesn't do justice to this excellent website, and that's why I've written about its crucial aspect. In this indicator, the identification of all candlesticks known as "Pin bars" is explored.
These candlesticks include the following:
- Hammer : A Pin bar formed at the end of a bearish trend, with its body being either bearish or bullish.
- Shooting Star : Formed at the end of a bullish trend, with its body being either bearish or bullish.
- Hanging Man : Formed during an upward trend, characterized by a candle with a lower shadow.
- Inverted Hammer : Formed during a downward trend, characterized by a candle with an upper shadow.
🟣 Important : For ease of use, we refer to these four candlestick patterns as Pin Bars and categorize them into the main friends "Bullish" and "Bearish."
🟣 Important : In all sources, Hanging Man and Inverted Hammer are referred to as "Reversal candles." However, in reality, whenever they appear after breaking a significant area (Break Out), we expect these candles to signal a continuation of the trend and confirmation in the direction of the trend.
🟣 Important : One of the best signs of market manipulation and entry by market giants is the "Ice Berg." So, it provides one of the best trading opportunities.
🔵 Reason for Creation
Many traders, especially volume traders, use Pin bars as confirmation and enter the market after their occurrence. In this indicator, all four patterns are identified and displayed in a colored candle format, using "triangle" and "circle."
When they are evident on the chart, directly or by drawing a horizontal line, they give us good alerts for reversal or continuation areas.
🔵 Information Table
1. Red circle: Pin bars formed in a downtrend.
2. Blue circle: Bullish Pin bars formed in an uptrend.
3. Black triangle: Bearish Pin bar candle in an uptrend.
4. Blue triangle: Bullish Pin bar candle in a downtrend.
🔵 Settings
Trend Detection Period: A special feature that considers smaller or larger fluctuations. If individual price waves need to be considered, use lower numbers; if the overall trend direction is desired, use larger numbers (e.g., 5-7 or higher). This precisely sets the Zigzag or Pivot format, not displayed but considered in the indicator calculation.
Trend Effect : By changing the Trend Effect status to "Off," all Pin bars, whether bullish or bearish, are displayed regardless of the current market trend. If the status remains "On," only Pin bars in the direction of the main market trend are shown.
🟣 Important : Black triangles "Number 3" and blue triangles "Number 4" displayed in the information table section, as explained in the "Information Table" section.
Show Bullish Pin Bar : When set to "Yes," displays bullish Pin bars; when set to "No," does not display them.
Show Bearish Pin Bar : When set to "Yes," allows the display of bearish Pin bars; when set to "No," does not display them.
Bullish Pin Bar Setting : Using the "Ratio Lower Shadow to Body" and "Ratio Lower Shadow to Higher Shadow" settings, you can customize your bullish Pin bar candles. Larger numbers impose stricter conditions for identifying bullish Pin bars.
Bearish Pin Bar Setting : Using the "Ratio Higher Shadow to Body" and "Ratio Higher Shadow to Lower Shadow" settings, you can customize your bearish Pin bar candles. Larger numbers impose stricter conditions for identifying bearish Pin bars.
Show Info Table : Allows the display or non-display of the information table (located at the bottom of the page and on the right side).
🔵 How to Use
At the end of a downtrend, look for "Hammer" candles, easily identified one by one.
To identify the "Shooting Star" candle pattern at the end of an uptrend; expect a price reversal in the downtrend.
For trades in the downward direction, wait for the formation of an "Inverted Hammer" Pin bar.
And finally, in an uptrend, where a "Hanging Man" candle can form.
🔵 Features
For better visualization, triangles and circles are used above the candles, but they can be easily removed. All Pin bars are displayed in color with the following meanings:
- Black-bodied candle: Inverted Hammer
- Turquoise blue candle: Hammer
- Pink candle: Hanging Man
- Red candle: Shooting Star
🟣 Important : The capability to detect the powerful two-candle pattern "Tweezer Top" at the end of an uptrend emerges by forming two "Shooting Star" candles side by side.
Similarly, the two-candle pattern "Tweezer Bottom" is created at the end of a downtrend with the formation of two "Hammer" candles side by side. To identify the "Tweezer" pattern, make sure the settings in the "Trend Effect" section are set to "Off."
🟣 Auxiliary Indicators
During the start of trading sessions such as Asia, London, and New York, where the highest liquidity exists, alongside this indicator, you can use the Trading Sessions indicator.
Sessions
The combination of Order Blocks "-OB" and "+OB" with candles is one of the best trading methods. The indicator that identifies order blocks, along with this indicator, can yield remarkable results in the success of Pin bar candles.
Order Blocks Finder
The trading toolset "TFlab" presents this indicator. To benefit from all indicators, we invite you to visit our page " TFlab Scripts ".

Candle Color By OHLC ComparisonThis indicator is designed to help you recognize the price movements within a candle/bar more quickly and easily. Typically, candle coloring is based on the opening and closing prices, but in this indicator, I followed the OHLC values in reverse order: starting with closing, low, high, and then opening. Each of these is compared with the value in the previous candle. I assigned the least importance to the opening, hence did not include it in the color determination. To make the colors memorable, I used a rainbow-like color scale; with purple representing the highest value and maroon the lowest. You can also change the colors if you wish. Additionally, if you want to set alarms, I assigned values to the candles; the highest being 16 and the lowest 1. A thicker barchart provides a better visual representation.
For instance, consider the monthly chart of the NASDAQ 100. After a prolonged positive trend, when our indicator shows a negative maroon bar (representing a low value) for the first time, it could signal a change in the trend direction. In this scenario, the appearance of the maroon bar serves as a crucial alert for investors to review their current positions or prepare for a potential downtrend. This indicator provides users with a significant advantage in identifying such critical turning points and assists them in quickly adapting to market dynamics.

Volume Candle DistributionThe Volume Candle Distribution (VCD) indicator examines the volume distribution across candle type, distinguishes between neutral, bullish and bearish volume pressures.
The VCD indicator calculates and displays the cumulative volume of bullish and bearish candles over a user-defined period, aggregates the volumes of bullish and bearish candles separately and plots them.
Bullish Volume : This is accumulated when the closing price of a candle is higher than the opening price, the VCD adds up the volume of bullish candle within the user-defined period, and consequently subtracts the volume when bearish candle.
Bearish Volume : Conversely, when the closing price is lower than the opening price, the volume of that candle is considered bearish, the VCD sums the volume of bearish candles over the same period, and consequently subtracts the volume when bullish candle.
Neutral Volume : In cases where the opening and closing prices are equal, the volume of that candle is treated as neutral, and the VCD subtracts the volume from both candles.
The 3 Simple Moving Average (SMAs) included is based volume calculated separately for both bullish and bearish volume data, and the sum of them.

Trailing Candle CounterThis script is for users who like to monitor and/or analyze a specified number of candles within the time the last candle closed. Al Brooks fans may enjoy this indicator.
While searching for an indicator that already had this functionality I found a script by @Steversteves which counted the candles/percentage within a set period of time. This let me know it could be done. In honor of Steversteves I kept the table the same colors - although, I added code to allow the table to be modified.
When opening the script the user will need to set a begin/end time to analyze – don't worry as you can set anything you want and it can be altered after the script is running.
This image shows the settings for a user to be able to set a begin time and have the indicator count all the candles from that time through to the current time and update at each candle close. The user can move the beginning time as needed. This is useful if the user is monitoring the length of a trend, wedge, channel, etc.:
If the indicator is in view and the beginning time is on the chart the user can select the table to view/select/change the beginning time.
This image shows the settings for a user to monitor the last set of candles since the last candle closed. This is useful if the user expects a pullback after a set number of candles or expects some alteration in a trend within a set number of candles. In this case the user setting is to watch five candles:
This setting is the reason for my creation of this indicator. This image shows the settings for a user to monitor two sets of candles. In this case an additional set of five candles has been added to the original set of five candles:
If one is watching for movements to last a certain number of bars when the first bar of the movement is exiting the background color the user can expect a change in the price momentum.
This image shows the same functionality as in Steversteves original script (although, I used almost none of his original code). The user can set a begin time and end time to analyze the number or red/green candles and the percentage of each within that time period.
If the indicator is in view and the beginning and end times are on the chart the user can select the table to view/select/change the times.
I hope you find this useful and if you have any questions/comments/suggestions for improvement please comment below.

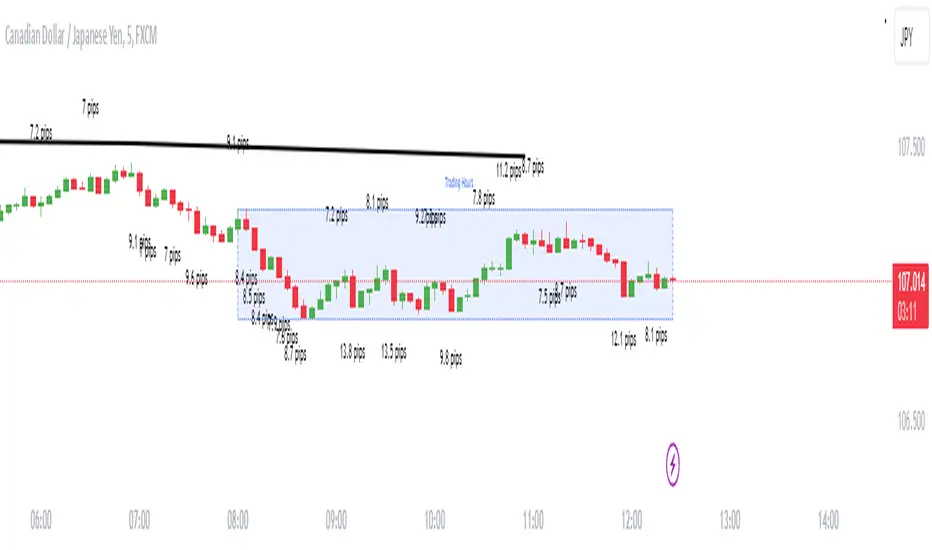
Candle size in pipsDescription
Enhance your trading strategy with precision using this script, designed to measure the range of a candle from wick to wick in pips. Whether you're implementing a specific pip requirement within a candle for your strategy, or simply seeking to better understand market dynamics, this tool provides valuable insights. The script is calculating the amount of pips between the high and the low then compares it to the minimal size you declared. If the amount of pips is more or equal to minimal size it will show the label.
Features
Alert Functionality: Opt to receive alerts by checking the checkbox (default: false).
Customizable Pip Threshold: Tailor the script to your needs by setting the minimum required pips to display on the screen (default: 12).
Different shape: circle, triangle up, triangle down, none
How to Use
Personalize your trading approach by integrating this script with your preferred strategy. For instance, in my strategy involving a 3M continuation, I leverage this tool to determine the pip count of the M15 candle before making entry decisions.
Note: Ensure you understand your strategy's requirements and adjust the script settings accordingly for optimal result s.
Feel free to reach out if you have any questions or require further assistance in maximizing the utility of this script.
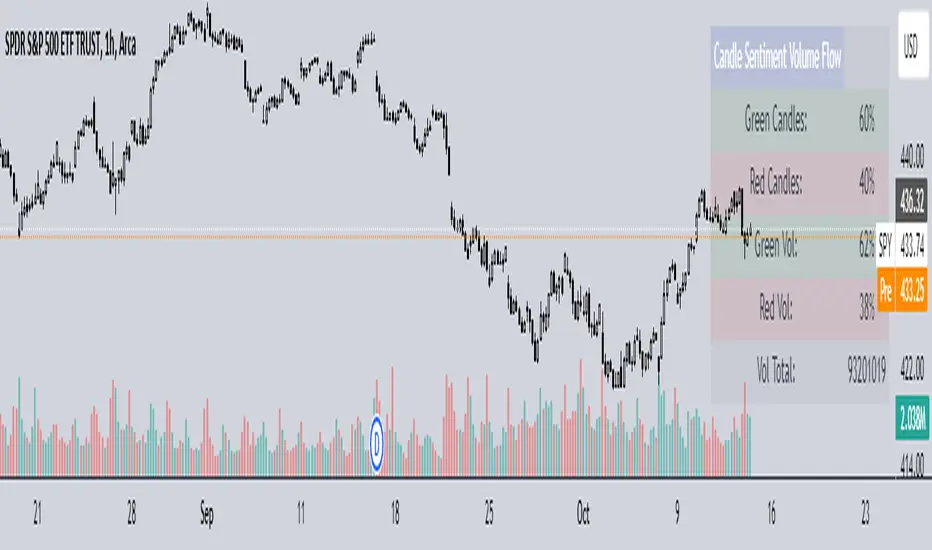
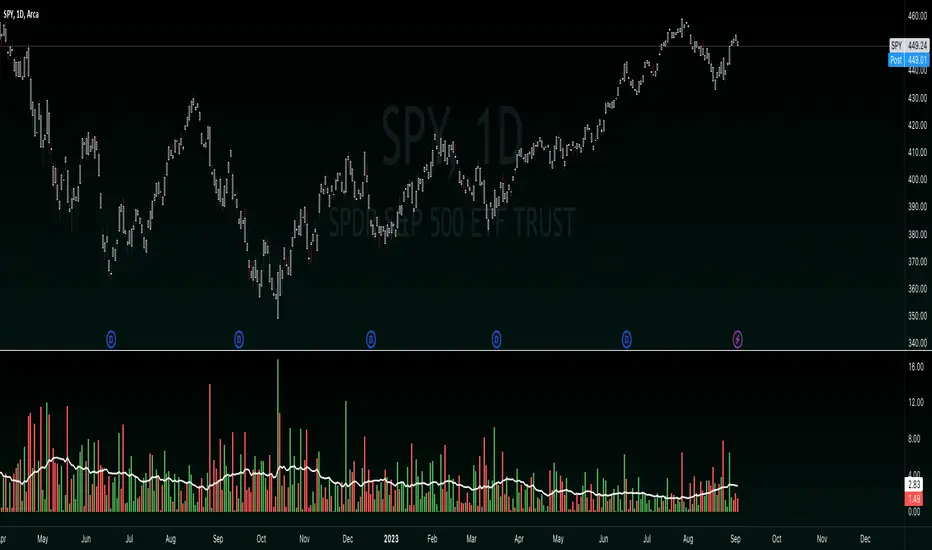
Candle Sentiment Volume FlowCandle Sentiment Volume Flow (CSVF)
NOTE: The indicator showcased in the 1H chart is utilized on the ticker 'SPY'.
The Candle Sentiment Volume Flow (CSVF) is a custom trading indicator designed to analyze and visualize the momentum and volume flow of a financial instrument within a specified range of candles in a chart. It provides traders with a snapshot of the prevailing market sentiment by calculating the percentage of green (bullish) and red (bearish) candles and the volume associated with them over a defined range of periods (X Range).
Core Components:
1. Candle Counting:
- Green Count: Total number of green (bullish) candles in the defined range.
- Red Count: Total number of red (bearish) candles in the defined range.
2. Volume Calculation:
- Green Volume: Cumulative volume of green candles.
- Red Volume: Cumulative volume of red candles.
3. Percentage Calculation:
- Green Percentage: (Green Count / X Range) * 100
- Red Percentage: (Red Count / X Range) * 100
- Green Volume Percentage: (Green Volume / Total Volume) * 100
- Red Volume Percentage: (Red Volume / Total Volume) * 100
4. User-Defined Parameters:
- Candle Range (X Range): Number of candles to be considered for calculations.
- Green Threshold: User-defined percentage to identify significant bullish sentiment.
- Red Threshold: User-defined percentage to identify significant bearish sentiment.
Visual Component:
- Table Display:
A table is displayed on the top right of the chart, providing a quick overview of the calculated percentages and total volume.
The table is color-coded for easy interpretation and includes:
- Green and Red Candle Percentages
- Green and Red Volume Percentages
- Total Volume
Functional Workflow:
- The indicator loops through the past 'X' candles within the defined range, counting the number of green and red candles and accumulating their respective volumes.
- It calculates the percentage of green and red candles and the percentage of volume associated with them.
- The calculated values are displayed in a table on the chart, providing a clear and concise view of the candle sentiment and volume flow within the specified range.
itradesize /\ Remaining Time - Candle close countdown A simple tool that displays the remaining time of M15, H1, H4, and D candles until they close.
Moreover, It works on all timeframes with all the exact data of the desired timeframe.
It can be such a useful tool when you using OHLC, AMD, and other theories. As you do not need to scrub back and forth through different timeframes to look for a bar close.
Notes:
• The Remaining Time Table only works in real time. It will show a “-“ sign, when you are in a replay mode.
This indicator has a Watermark section too where you can add your name/title/etc.. additionally, it shows the symbol, current timeframe, current date and you are able to customise them.

Range Breakout Signals (Intrabar) [LuxAlgo]The Range Breakout Signals (Intrabar) is a novel indicator highlighting trending/ranging intrabar candles and providing signals when the price breaks the extremities of a ranging intrabar candles.
🔶 USAGE
The indicator highlights candles with trending intrabar prices, with uptrending candles being highlighted in green, and down-trending candles being highlighted in red.
This highlighting is affected by the selected intrabar timeframe, with a lower timeframe returning a more precise estimation of a candle trending/ranging state.
When a candle intrabar prices are ranging the body of the candle is hidden from the chart, and one upper & lower extremities are displayed, the upper extremity is equal to the candle high and the lower extremity to the candle low. Price breaking one of these extremities generates a signal.
The indicator comes with two modes, "Trend Following" and "Reversal", these modes determine the extremities that need to be broken in order to return a signal. The "Trend Following" mode as its name suggests will provide trend-following signals, while "Reversal" will aim at providing early signals suggesting a potential reversal.
🔶 DETAILS
To determine if intrabar prices are trending or ranging we calculate the r-squared of the intrabar data, if the r-squared is above 0.5 it would suggest that lower time frame prices are trending, else ranging.
This approach allows almost obtaining a "settings" free indicator, which is uncommon. The intrabar timeframe setting only controls the intrabar precision, with a timeframe significantly lower than the chart timeframe returning more intrabar data as a result, this however might not necessarily affect the displayed information by the indicator.
🔶 SETTINGS
Intrabar Timeframe: Timeframe used to retrieve the intrabar data within a chart candle. Must be lower than the user chart timeframe.
Auto: Select the intrabar timeframe automatically. This setting is more adapted to intraday charts.
Mode: Signal generation mode.
Filter Out Successive Signals: Allows removing successive signals of the same type, returning a more easily readable chart.

YinYang Bar ForecastOverview:
YinYang Bar Forecast is a prediction indicator. It predicts the movement for High, Low, Open and Close for up to 13 bars into the future. We created this Indicator as we felt the TradingView community could benefit from a bar forecast as there wasn’t any currently available.
Our YinYang Bar Forecast is something we plan on continuously working on to better improve it, but at its current state it is still very useful and decently accurate. It features many calculations to derive what it thinks the future bars will hold. Let’s discuss some of the logic behind it:
Each bar has its High, Low, Open and Close calculated individually for highest accuracy. Within these calculations we first check which bar it is we are calculating and base our span back length that we are getting our data from based on the bar index we are generating. This helps us get a Moving Average for this bar index.
We take this MA and we apply our Custom Volume Filter calculation on it, which is essentially us dividing the current bars volume over the average volume in the last ‘Filtered Length’ (Setting) length. We take this decimal and multiply it on our MA and smooth it out with a VWMA.
We take the new Volume Filtered MA and apply a RSI Filter calculation on it. RSI Filter is where we take the difference between the high and low of this bar and we multiply it with an RSI calculation using our Volume Filtered MA. We take the result of that multiplication and either add or subtract it from the Volume Filtered MA based on if close > open. This makes our RSI Filtered MA.
Next, we do an EMA Strength Calculation which is where we check if close > ema(close, ‘EMA Averaged Length’) (Setting). Based on this condition we assign a multiplier that is applied to our RSI Filtered MA. We divide by how many bars we are predicting and add a bit to each predictive bar so that the further we go into the future the stronger the strength is.
Next we check RSI and RSI MA levels and apply multiplications based on its RSI levels and if it is greater than or less than the MA. Also it is affected by if the RSI is <= 30 and >= 70.
Finally we check the MFI and MFI MA levels and like RSI we apply multiplications based on its MFI levels and if it is greater than or less than the MA. It is also affected by if the MFI is <= 30 and >= 70.
Please note the way we calculate this may change in the future, this is just currently what we deemed works best for forecasting the future bars. Also note this script uses MA calculations out of scope for efficiency but there is potential for inconsistencies.
Innately it’s main use is the projection it provides. It only draws the bars for realtime bars and not historical ones, so the best way to backtest it is with TradingView’s Replay Tool.
Well, enough of the logic behind it, let's get to understanding how to use it:
Tutorial:
So unfortunately we aren’t able to plot legit bars/candles into the future so we’ve had to do a bit of a work around using lines and fills. As you can see here we have 4 Lines and 3 Zones:
Lines:
Green: Represents the High
Orange: Represents the Open
Teal: Represents the Close
Red: Represents the Low
Zones:
High Zone: This zone is from either Open or Close to the High and is ALWAYS filled with Green.
Open/Close Zone: This zone is from the Open to the Close and is filled with either Green or Red based on if it's greater than the previous bar (real or forecasted).
Low Zone: This zone is from either Open or Close to the Low and is ALWAYS filled with Red.
As you can see generally the Forecasted bars are generally within strong pivot locations and are a good estimation of what will likely go on. Please note, the WHOLE structure of the prediction can change based on the current bars movements and the way it affects the calculations.
Let's look 1 bar back from the current bar just so we can see what it used to Forecast:
As you can see it has changed quite a bit from the previous bar, but if you look close, we drew horizontal lines around where its projecting the next bar to be (our current realtime bar), if we go back to the live chart:
Its projections were pretty close for the high and low. Generally, right now at least, it does a much better job at predicting the high and low than it does the open and close, however we will do our best to fine tune that in future updates.
Remember, this indicator is not meant to base your trades on, but rather give you a Forecast towards the general direction of the next few bars. Somewhat like weather, the farther the bar (or day for weather), the harder it is to predict. For this reason we recommend you focusing on the first few bars as they are more accurate, but review the further ones as they may help show the trend and the way that pair will move.
We will conclude this tutorial here, hopefully this Predictive Indicator can be of some help and use to you. If you have any questions, comments, ideas or concerns please let us know.
Settings:
Forecast Length: How many bars should we predict into the Future? Max 13
Each Bar Length Multiplier: For each new Forecast bar, how many more bars are averaged? Min 2
VWMA Averaged Length: All Forecast bars are put into a VWMA, what length should we use?
EMA Averaged Length: All Forecast bars are put into a EMA, what length should we use?
Filtered Length: What length should we use for Filtered Volume and RSI?
EMA Strength Length: What length should we use for the EMA Strength
HAPPY TRADING!

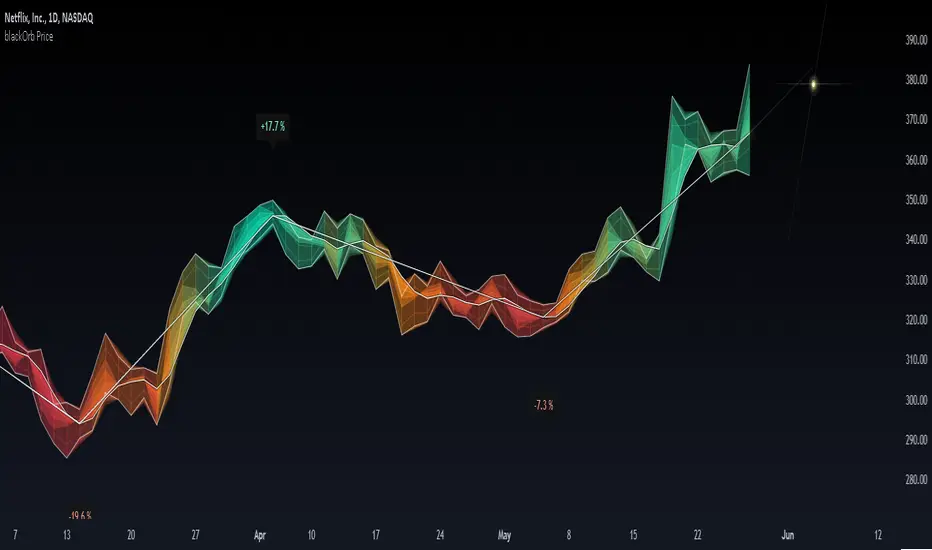
blackOrb PriceblackOrb's Aspiration: Enhancing the Functionality of Area Charts
At its core, an area chart analysis serves as the foundational structure for blackOrb Price. Area charts can be seen as an addition to conventional price charts. Unlike price line charts, which connect closing prices with lines, an area chart fills the space between high and low prices, creating a visual representation of price ranges. This approach can offer several advantages, particularly in assessing price volatility and price dynamics.
A wider area between high and low suggests high volatility, while a narrower area indicates lower volatility. The orientation of the closing price concerning the high-low range provides insights into whether buyers or sellers are exerting influence on the market.
Combined with the following elements, this chart tool can support comprehensive data-driven trading analysis:
- Integrated moving averages for price dynamic insights
- Zigzag pivot identification for price level insights
- Stochastic lookback analysis for turning point insights
- Ghost mode for comparative insights
Technical Methodology
I. Integrated Moving Averages for Price Dynamic Insights
Incorporating various MA alternatives allows traders to gain insights into not only price dynamics but also their underlying strength, which is reflected in trading activity. This strength is visually depicted by the derived price line within blackOrb's Price Area Chart.
Among the array of MA alternatives, VWMA stands out as a suitable implementation choice for integrating volume data. It goes beyond the scope of a simple moving average, considering both price and volume in its calculation, as shown in the following formula:
(C1 x V1 + C2 x V2 + ... + CN x Vn) / (V1 + V2 + ... + Vn)
II. Zigzag Pivot Identification for Price Level Insights
Zigzag Pivot Identification can be a valuable tool for recognizing possible price movements and potential turning points. It operates by pinpointing pivotal moments where prices alter their course. Essential components of this method involve comparing time units both to the left and right within a designated price dynamic phase, effectively defining the search range for pivotal points.
For instance, in the analysis below, the search is for the highest price point that hasn't been surpassed in the last 10 time units to the left and 10 time units to the right:
ta.pivothigh(10, 10)
The lookback variables analyze price points by simultaneously examining a specified number of time units before and after a potential pivot point as the central reference. A pivot is identified when a price point remains unbreached throughout this period.
Note: This method retroactively validates structures, implying that this tool may redraw or adjust its values as price data evolves. This leads to inconsistency and a lack of predictability.
III. Stochastic Lookback Analysis for Turning Point Insights
The stochastic calculation methodology of this feature centers around the following formula:
100 * (close - lowest(low, length)) / (highest(high, length) - lowest(low, length))
This key formula employs a stochastic calculation methodology that assesses the percentage deviation of the closing price from the lowest low over a specified timeframe (length), relative to the span between the highest high and the lowest low. The outcome is normalized within a range of 0 to 100, providing insights into the relative position of the closing price within the high-low range. Traders can define the specific periods over which the stochastic calculation is performed.
Based on this stochastic analysis, the indicator integrates area chart coloring, affording users the flexibility to adjust the sensitivity of area chart coloring according to customized stochastic look-back evaluation phases. Consequently, the coloration by length evaluation can mirror a comprehension of market dynamics.
Note: However, it's important to recognize that the efficacy of evaluation coloring might be compromised during periods of lateral price movement, characterized by less prominent market trends.
IV. Ghost Mode for Comparative Insights
Unveiling convergences and divergences, the Ghost Mode overlays two price charts, which can reveal price trajectories and reactions (e.g. Apple stock's potential response to the NASDAQ 100 Technology Sector Index).
Note: This approach may not capture nuanced correlations during intricate market scenarios.
Note on Usability
This tool is an intricately designed area chart, meticulously created to serve as a fundamental canvas for the seamless integration of other more granular trading indicators.
blackOrb Price can have synergies with blackOrb Candle as both indicators combined can give a bigger picture for supporting comprehensive and multifaceted data-driven trading analysis.
This indicator isn't intended for standalone trading application. Instead, it offers an alternative approach to traditional area charts, serving as a supplementary tool for orientation within broader trading strategies. Irrespective of market conditions, it can harmonize with a wider range of trading styles and instruments/trading pairs/indices like Stocks, Gold, EURUSDSPX500, GBPUSD, BTCUSD and Oil.
Inspiration and Publishing
Taking genesis from the inspirations amongst others provided by TradingView Pine Script Wizard Kodify, blackOrb Price is a multi-encompassing script meticulously forged from scratch. It aspires to furnish a comprehensive area chart approach, borne out of personal experiences and a strong dedication in supporting the trading community. We eagerly await valuable feedback to refine and further enhance this tool.
blackOrb CandleAddressing the Shortcomings of Conventional Candle Charts
I. Surmounting Volatility Challenges
In the realm of combined heightened or subdued volatility and erratic market conditions, traditional candlestick charts are susceptible to deficiencies in isolating extraneous data noise (e.g. high/low wicks, given their frequent incongruity with pivotal market dynamics or arbitrary green/red coloring of candle bodies).
II. Precision in Application
Novice traders may erroneously construe and misemploy traditional candlestick patterns, culminating in erroneous trading determinations. In addressing this challenge, this indicator can help to identify critical signal confluences, enhancing potential signals accuracy.
III. Strategy at the Core
Relying solely on candlestick charts lacks potency without an underpinning well-knit strategy. blackOrb's methodology integrates discernment of pivotal chart configurations with the meticulous construction of comprehensive strategies to mirror a comprehension of potential market dynamics.
blackOrb's Aspirations: Overcoming Enunciated Challenges of Traditional Candle Charts
- Customizable Data Analysis
Engendering the evolution of candle charts involves the judicious adjustment of multifarious open/high/low/close iterations coupled with evaluative mechanisms such as Heikin Ashi and MA smoothing, combined with stochastic calculations.
- Holistic Perspective
Seamless deployment of trading strategies is engendered through salient facets, encompassing up- and downside ratios as well as adaptable true range visualizations, attuned to unfolding price dynamics.
- Personalized Approach
Adaptations in trading styles are seamlessly accommodated, as this indicator offers stochastic candle coloring with customizable stochastic look-back evaluation phases. A selection of over 20 color schemes accommodates individual preferences to differentiate various chart setups at first glance.
Note: However, it's important to recognize that the efficacy of evaluation coloring might be compromised during periods of lateral price movement, characterized by less prominent market trends.
- Ghost Mode for Comparative Insights
Unveiling correlations and divergences, the Ghost Mode overlays two candle charts, which can reveal price trajectories and reactions (e.g. Apple stock's potential response to the NASDAQ 100 Technology Sector Index).
Note: This approach may not capture nuanced correlations during intricate market scenarios.
Technical Methodology
At its core, the stochastic calculation methodology of this indicator centers around the following formula:
100 * (close - lowest(low, length)) / (highest(high, length) - lowest(low, length))
This key formula employs a stochastic calculation methodology that assesses the percentage deviation of the closing price from the lowest low over a specified timeframe (length), relative to the span between the highest high and the lowest low. The outcome is normalized within a range of 0 to 100, providing insights into the relative position of the closing price within the high-low range. Traders can define the specific periods over which the stochastic calculation is performed.
Based on this stochastic analysis, the indicator integrates candle coloring, affording users the flexibility to adjust the sensitivity of candle coloring according to customized stochastic look-back evaluation phases. Consequently, the coloration of candles by length evaluation can mirror a comprehension of market dynamics.
By allowing traders to designate specific periods for the stochastic calculation, it fosters adaptability in combination with the following technical features:
- Conjoining optional transparent Heikin Ashi and/or a weighted MA alternative to harness the virtues of smoothing sans confounding authentic price data and candle dynamics
- Individual electable focus range encompassing retrospection and real-time alignments
- Intra-temporal evaluations, sub-domains & amalgamated value permutations
- Prioritizing individually chosen focus time intervals within the realm of real price highs and lows
- Elaborate price display (e.g. high/low/ohlc4/close) upon chart-hover, accentuating close price implications
- Features offering diverse scaling options, alongside adaptable and customizable price display
- Unveiling uncluttered and directed candle body visualization, implementing wicks to the transparent candle body, given their frequent incongruity of high/low data with pivotal market dynamics
Note on Usability
This indicator isn't intended for standalone trading application. Instead, it offers an alternative approach to traditional candle charts, serving as a supplementary tool for orientation within broader trading strategies.
Irrespective of market conditions, it can harmonize with a wider range of trading styles and instruments/trading pairs/indices like Stocks, Gold, EURUSDSPX500, GBPUSD, BTCUSD and Oil.
Inspiration and Publishing
Taking genesis from the inspirations amongst others provided by TradingView Pine Script Wizard Kodify, blackOrb Candles is an multi-encompassing script meticulously forged from scratch. It aspires to furnish a comprehensive candle chart approach, borne out of personal experiences and a strong dedication in supporting the trading community. We eagerly await valuable feedback to refine and further enhance

Candle Size w/ SMAThis simple indicator calculates the absolute size of the candle by the open and close or high and low values and then plots it on a histogram. It also features a simple moving average with a customizable lookback to track the average candle size based on your lookback.
This indicator can be used to spot unusually large or small candles. And can also be used for testing other strategies or indicators related to candle sizes.
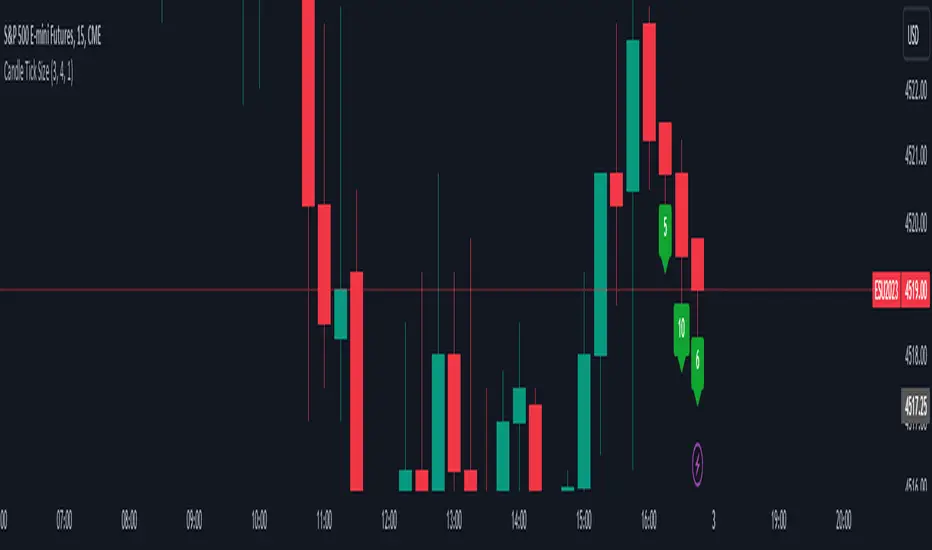
Candle Tick SizeHello everyone!
I dont think it exists, I couldnt find it any way I searched, maybe it is part of a bigger indicator. This is a really basic code, all it does, it shows the tick/pip size of the candles forming. You can adjust on how many candles should it show. Also because the code counts the point size of the candles from high to low, you can adjust that how many ticks are in one point, like for ES and NQ 4 ticks to a point, which is the basic setting. It helps me with entrys when I calculate the contract size so my risk/reward stays pretty much the same depending on the candle size for my entrys.
Boring Candles by BitcoinBailyBoring candlestick is a candlestick whose body is less than 50% of its total candlestick range, this candle is usually small in size.
This indicates that the price range between the open and close of this candle was relatively small, and that there was not a lot of volatility during that time period.

Lower timeframe chartHi all!
I've made this script to help with my laziness (and to help me (and now you) with efficiency). It's purpose is to, without having to change the chart timeframe, being able to view the lower timeframe bars (and trend) within the last chart bar. The defaults are just my settings (It's based on daily bars), so feel free to change them and maybe share yours! It's also based on stocks, which have limited trading hours, but if you want to view this for forex trading I suggest changing the 'lower time frame' to a higher value since it has more trading hours.
The script prints a label chart (ASCII) based on your chosen timeframe and the trend, based on @KivancOzbilgic script SuperTrend The printed ASCII chart has rows (slots) that are based on ATR (14 bars) and empty gaps are removed. The current trend is decided by a percentage of bars (user defined but defaults to 80%, which is really big but let's you be very conservative in defining a trend to be bullish. Set to 50% to have the trend being decided equally or lower to be more conservative in defining a trend to be bearish) that must have a bullish SuperTrend, it's considered to be bearish otherwise. Big price range (based on the ATR for 14 bars) and big volume (true if the volume is bigger than a user defined simple moving average (defaults to 20 bars)) can be disabled for faster execution.
The chart displayed will consist of bars and thicker bars that has a higher volume than the defined simple moving average. The bars that has a 'big range' (user defined value of ATR (14 days) factor that defaults to 0.5) will also have a wick. The characters used are the following:
Green bar = ┼
Green bar with large volume = ╪
Green bar wick = │
Red bar = ╋
Red bar with large volume = ╬
Red bar wick = ┃
Bar with no range = ─
Bar with no range and high volume = ═
Best of trading!

Hide Active Candle [SteinG]Hide Active Candle
An essential tool for disciplined traders seeking to avoid making hasty decisions based on active bars that have not yet closed.
Have you ever found yourself eagerly anticipating an entry, only to be tempted by an active candle that starts to pull away? Or perhaps you've been caught in a trade where an active candle pushes against you, stirring unease and uncertainty. Fear not, for we have a solution!
"Hide Active Candle" is a simple Pine Script indicator designed to ghost the active bar on your chart, reinforcing the importance of patiently waiting for its closure before making any trading decisions. By masking the active candle, this indicator serves as a constant reminder to exercise caution and to base your actions on solid, confirmed information.
To make the most of this powerful tool, ensure that you are using a candlestick chart, as this script operates optimally within that framework. Follow these simple steps to get started:
1. Right-click on your chart and select "Settings..."
2. From the drop-down menu, choose "Symbol" under the "Chart Settings" section.
3. Disable every item in the list to fully utilize the capabilities of "Hide Active Candle."
But wait, there's more! We understand that each trader has unique preferences and requirements. That's why we've included customizable settings within the script to tailor it to your specific needs. You have the option to adjust the following parameters:
- Countdown seconds left : Specify the number of seconds before the bar closes when the current candle becomes visible.
- Bull candle color : Select the color that represents bullish candles on your chart.
- Bear candle color : Choose the color that indicates bearish candles.
- Equal candle color : Define the color for Doji star candles.
- Theme : Opt for a dark or light theme, as the active candle mask will be based on your chosen theme.
- Custom hidden color : Personalize the mask color according to your preferences.
By fine-tuning these settings, you can create a trading environment that perfectly suits your style and enhances your decision-making process.

ATR VisualizerAdvance Your Market Analysis with the True Range Indicator
The True Range Indicator is a sophisticated screener meticulously developed to bolster your trading execution by presenting an exceptional understanding of the market direction. The centerpiece of this instrument is a distinctive candle configuration depicting the Average True Range (ATR) and the Bear/Bull range. However, it traverses beyond the conventional channels to offer specific market settings to boost your trading decisions.
User-Defined Settings
Broadly, the indicator offers five dynamic settings:
Bear/Bull Range
The Bear/Bull Range outlines the ATR for each candle type - bearish and bullish - and then smartly opts for the pertinent one based on the prevalent market circumstances. This feature aids in comparing the range of bullish and bearish candlesticks, which deepens your understanding of the price action and volatility.
Bearish Range
The Bearish Range isolates and computes the ATR for bearish candles solely. Utilizing this option spots the bear-dominated periods and provides insights about potential market reversals or downward continuations.
Bullish Range
Opposite to the Bearish Range, the Bullish Range setting tabulates the ATR exclusively for bullish candles. It assists in tracking the periods when bulls control, enlightening traders about the possibility of upward continuations or trend reversals.
Average Range
The Average Range provides an unbiased measure of range without prioritizing either bull or bear trends. This model is ideal for traders looking for a holistic interpretation of market behavior, regardless of direction.
Cumulative Average Range
Equally significant is the Cumulative Average Range which calculates the aggregate moving average of the true ranges for an expressed period. This setting is extremely valuable when evaluating the long-term volatility and spotting potential breakouts.
Dual Candle Configuration
Going a step ahead, the True Range Indicator uniquely offers the possibility to incorporate more than one candle estimate on your screen. This ensures simultaneous analysis of multiple market dynamics, thereby enhancing your trading precision multifold.
Concluding Thoughts
In essence, the True Range Indicator is an indispensable companion for traders looking to not only leverage market volatility but also make educated predictions. Equipped with an array of insightful market settings and the ability to display dual candle estimates on-screen, you can customize the functionality to suit your unique trading style and magnify your market performance dramatically.
