Candle Color GeneratorCandle Color Generator:
This indicator is designed to highlight the candle colors based on the combinations of Parabolic SAR (PSAR) and 2 Hull Moving Averages (HMA).
Colors:
Yellow, Red, and Green colors are used to describe the candle colors depends on its position to PSAR and 2 HMAs.
PSAR:
PSAR position above or below candle position is differentiated by Red and Green colors
HMAs:
As default settings 20 HMA is considered as lower period and 50 HMA is considered period for the calculation
Trade What You See:
This indicator will help to see how the setup of particular instrument coming up. Users/Traders can use and trade based on what they see and interpret from it.
Disclaimer:
Idea of publishing this script is to identify the strength of the instrument using multiple confirmation.
Using this indicator, changing inputs (show/hide/change period), and trading decisions are up to the users/traders.
Courtesy:
Thanks to inventors of HMA (Alan Hull), PSAR(Welles Wilder) as these inputs are used to make some calculations
Candle

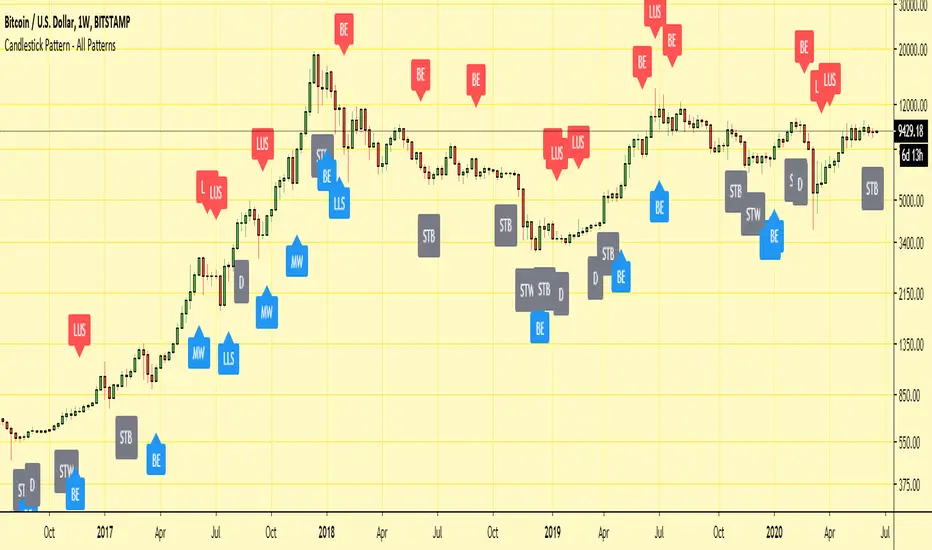
Candlestick Pattern - All PatternsHi,
Here I have collated all of the in-built TradingView candlestick patterns into one indicator.
It works on all time frames and can be useful for candlestick traders to quickly spot patterns forming on any chart.
It also allows for all individual patterns to be set up as seperate alerts within the same indicator.
Any issues/suggestions/requests let me know.
Enjoy!
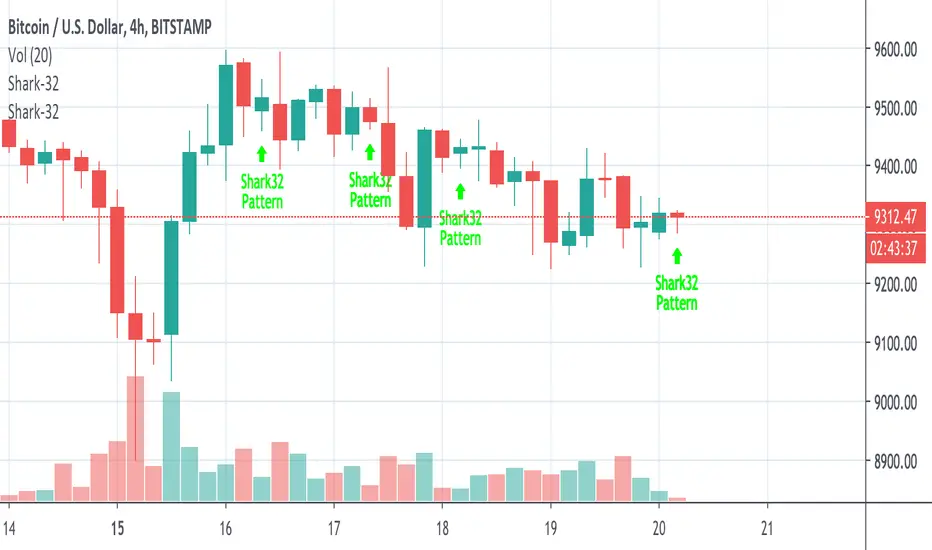
Shark-32 Pattern for Candle sticks AnalysisThis script is the perfect strategy for the all mighty shark-32 pattern.
It shows the power tussle between demand and supply before either of them finally gives up.
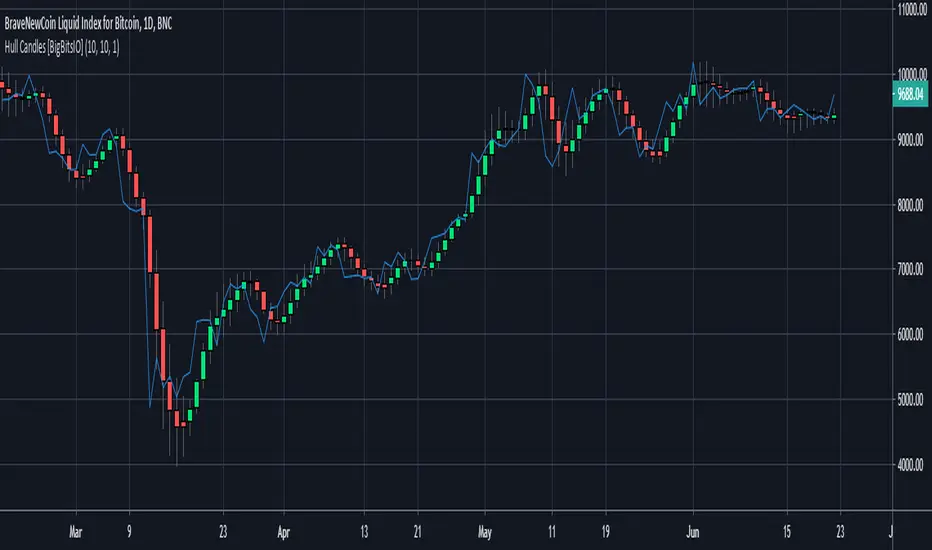
Hull Candles [BigBitsIO]This script is for custom candles based on an HMA calculation with a default period of 10 as well as an SMA of the close price, defaulted to 1 period to only show the current price. The purpose of the custom candles is to try and reduce noise from candles and help identify trends. These custom candles somewhat resemble Heikin-Ashi candles in their appearance.
Explained:
- Open, High, Low and Close (o, h, l, and c) are all calculated using an HMA calculation based on a user input length/period, defaulted at 10.
- Candle colors are determined by using the same HMA calculation on the ohcl4 and comparing it to the previous candle. Green candles have an ohlc4 greater than the previous candle, all other candles are red.
- The current price is plotted with the default blue line with an SMA calculation with 1 period to allow customization of smoothing if necessary to identify trends.
DISCLAIMER: For educational and entertainment purposes only. Nothing in this content should be interpreted as financial advice or a recommendation to buy or sell any sort of security or investment including all types of crypto. DYOR, TYOB.
Multi MA on candlestick volume indicatorUses 5 volume moving averages to change the candlestick color depending on how high above average volume is.
The volumes plotted at the bottom of the chart are set to the same settings as the indicator, you can see the volume bars that stick higher above the orange moving average are a different color on the chart to the smaller ones.
Any volume bar that is below the moving average is colored purple.

Candle counterI've created a simple red/green candle counting script with a custom number of candles to look back on.
Let me know if any bugs, issues, or suggestions.

{INDYAN} Boring and Explosive Candle -Demand & SupplyREAD:-Blue candle as boring/base candle and Black candle as explosive candle
FInd two explosive candle (Black) where two base/boring (Blue) candles are in between.
It will be marked as demand and supply zone.
Those who leant demand and supply will find this indicator usefull for findin and marking zones.
#When yuy find a Explosive candle , it become a potential demand and supply zone. It depens on second candle thou.
Thanks
Love INDYAN

Candlestick Pattern Detector - Aitch-TThis script detects the following candlestick patterns:
Bullish Patterns:
- Normal 3 Bar Fractal
- Enhanced 3 Bar Fractal
- Engulfing
- Harami ( Inside bar )
- Bullrami (Altenate Bull Harami)
Bearish Patterns:
- Normal 3 Bar Fractal
- Enhanced 3 Bar Fractal
- Engulfing
- Harami ( Inside bar )
- Bearami (Alternate Bear Harami)
- Shooting Star
How it works:
- When you add the script to your chart, green and red dots will appear at the top and the bottom of the chart.
- Red dots at the top of the chart point out the candles that have completed a bearish pattern .
- Green dots at the bottom of the chart point out the candles that have completed a bullish pattern .
How to use:
Use it in conjunction with other analysis tools ( Fibonacci Retracements, Histogram, Willy, RSI , volume , etc) to determine high probability levels.


GRAB or TrendStrength Bars with Highlights[Salty]GRAB or TrendStrength Bars with Propulsion Dots and Highlights for Squeeze Pro, CCI-Arrows, and SlowStoch
This indicator shows GRAB or TrendStrength candles and allows several moving averages to be displayed at the same time.
It has arrows and diamonds above or below the candles to show CCI values above 100 or below -100 with the arrow pointing in the direction of the momentum.
Diamonds indicate slightly weaker momentum than arrows, but still consider strong.
It has background coloring that is light green to show bullish trends and light red to show bearish trends that are derived from slow stochastics.
In general Darker colors are used for down moves and lighter colors are use to show up moves. Also, red indicates bearish, and green indicates bullish throughout.
It has yellow background to show squeezes with additional Squeeze Pro information shown at the bottom of the chart in the form of letters and momentum arrows.
L = Low compression squeeze, S = Normal Squeeze, and H = High Compression Squeeze.
It has a set of propulsion dots for each Moving Average. The trend is consider bullish when green colored dots print, and bearish when red dots print.
3 ATR Keltner channels are printed. The first two show the values used by the squeeze by default
2 Bolinger Bands are displayed based on the values used by the Squeeze by default.
1 VWAP line may be displayed.
TIP: overlaying the TICK symbol is great for confirming a bias where positive values are bullish and negative values are bearish.

Boring CandleThe indicator changes the color of boring candles to blue, this helps in identifying basing for Demand Supply Trading methodology.

Vanilla ABCD PatternPatterns makes parts of the many predictive tools available to technical analysts, the most simples ones can be easily detected by using scripts. The proposed tool detect the simple (vanilla) form of the ABCD pattern, a pattern aiming to detect potential price swings. The script can use an additional confirmation condition that aim to filter potential false signals.
ABCD PATTERN
The ABCD pattern is not meant to be detected by analyzing individuals closing price observations but by analyzing longer term movements, this is done by using tools such as zig-zag. Like any pattern the ABCD one comes in different flavors, the simplest being based on the following structures:
Once price reach D we can expect a reversal. The classical pattern has the following conditions : BC = 0.618*AB and CD = 1.618*AB , as you can see this condition is based on 0.618 which is a ratio in the Fibonacci sequence. Other conditions are for AB to equal to CD or for CD to be 161.8% longer than AB. Why these conditions ? Cause Fibonacci of course .
The ABCD pattern that the proposed tool aim to detect is not based on the zig-zag but only on individual price observations and don't make use of any of the previously described conditions, thus becoming more like a candle pattern.
When the label is blue it means that the tool has detected a bullish ABCD pattern, while a red label means that the tool has detected a bearish ABCD pattern.
We can't expect patterns based on the analysis of 1,2,3 or 4 closing price observations to predict the reversal of mid/long term movements, this can be seen on the above chart, but we can see some signals predicting short term movements.
Since the pattern is based on a noisy variation, using smoother input can result in less signals.
Above the tool on BTCUSD using closing price as input. Below the tool using ohlc4 as input:
TOOL OPTIONS
Being to early can be as devastating as being to late, therefore a confirmation point can be beneficial, the tool allow you to wait for confirmation thus having a potentially better timing. Below is a chart of AMD with no confirmation:
As we can see there are many signals with some of them occurring to early, we can fix this by checking the confirmation option:
The confirmation is simply based on the candle color, for example if a bearish ABCD pattern has been detected in the past and the closing price is greater than the opening price then the tool return a buy signal. The same apply with a bearish ABCD pattern.
The "last bar repaint" option is true by default, this in order to show the bar where the D point of the pattern has been detected, since the closing price of the last bar is constantly changing the signals on the last bar can be constantly appearing/disappearing, unchecking the option will fix this but will no longer the bar where the D point of the pattern has been detected.
SUMMARY
The pattern is simple and can sometimes be accurate when predicting the direction of future short terms movements. The tool was a request, as it seems i don't post many pattern detectors, well thats true, and the reason is that for me patterns are not super significant, and their detection can be extremely subjective, this is why simple patterns are certainly the only ones worth a look.
Don't expect me to post many pattern related indicators in the future ^^'

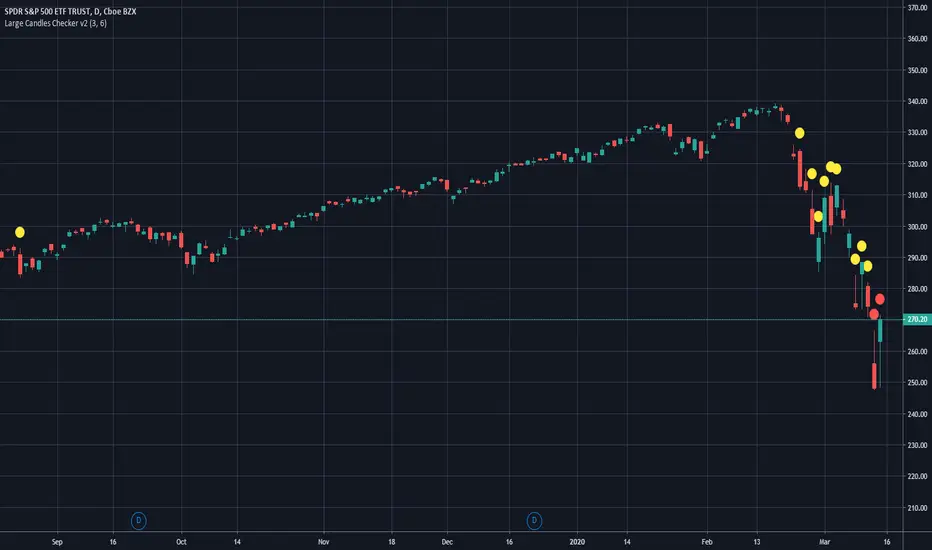
Large Candles Checker v2Using this indicator allows you to indentify large candles directly in your stock chart at first glance. The algorithm of the indicator *Large Candles Checker v2* was optimized in this new indicator as well as it using the new pine script version v4. For backwards compatibility reasons this indicator is published as v2.
Added tails and wicks (also referred to as long and short shadows) to the calculation algorithm. You will be able to configure the tails and wicks in the indicator settings. And the calculated percentage value of large candles will now also be displayed.
It uses two different sorts for large candles (yellow, e.g. larger than 3%) and for very large candles (red, e.g. larger than 6%). These values can be changed in the indicator settings.
Hope this helps many of you to be more efficient in your chart analysis - have fun!
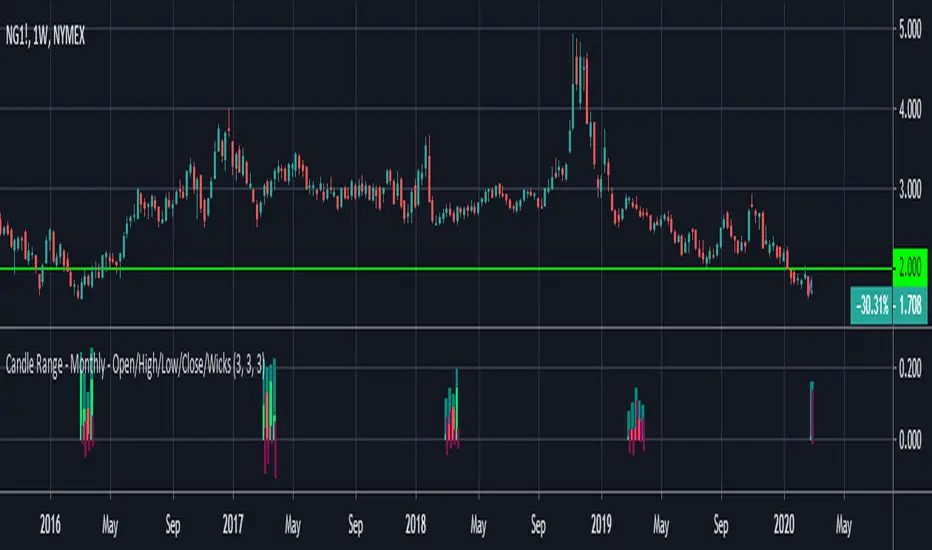
Candle Range - Monthly - Open/High/Low/Close/Wicks (Oldinvestor)This candle range comparison is similar to my original script Candle Range Compare .
This script is to compares the size of open/close high/low and wick size side by side. This version of the script allows you to only show a chosen month of each year to compare. I hadn't even thought to try and vanish the part of the chart I'm not looking at. I'll consider that later (may never happen, I am limited on time).
I have also included check boxes to turn on/off certain candles. This part is pretty self explanatory. For example: if you wish to not see wicks in front of the open/close, go to the settings for the study and uncheck the box for "Show Wicks".
Warning: The script does not work so well on monthly candles? Some of the candles are missing...
Good luck
Oldinvestor
Sequential Filter - An Original Filtering ApproachRemoving irregular variations in the closing price remain a major task in technical analysis, indicators used to this end mostly include moving averages and other kind of low-pass filters. Understanding what kind of variations we want to remove is important, irregular (noisy) variations have mostly a short term period, fully removing them can be complicated if the filter is not properly selected, for example we might want to fully remove variations with a period of 2 bars and lower, if we select an arithmetic moving average the filter output might still contain such variations because of the ripples in the frequency response passband, all it would take is a variation of high amplitude for that variation to be clearly visible.
Although all it would take for better filtering is a filter with better performance in the frequency domain (gaussian, Butterworth, Bessel...) we can design innovative approaches that does not rely on the model of classical moving averages, today a new technical indicator is proposed, the technical indicator fully remove variations lower than the selected period.
The Indicator Approach
In order for the indicator output to change the closing price need to produce length consecutive up's/down's, length control the variation threshold of the indicator, variations lower than length are fully removed. Lets see a visual example :
Here length = 3, the closing price need to make 3 consecutive up's/down's, when the sequence happen the indicator output is equal to src , here the closing price, else the indicator is equal to its precedent value, hence removing other variations. The value of 3 is the value by default, this is because i have seen in the past that the average smallest variations period where in general of 3 bars.
Because the indicator focus only on the variation sign, it totally ignore the amplitude of the movement, this provide an effective way to filter short term retracement in a fluctuation as show'n below :
The candle option of the indicator allow the indicator to only focus on the body color of a candle, thus ignoring potential gaps, below is an example with the candle option off :
If we activate the "candle" option we end up with :
Note that the candle option is based on the closing and opening price, if you use the indicator on another indicator output make sure to have the candle option off.
Length and Indicator Color
The closing price is infected by noise, and will rarely make a large sequence of consecutive up's/down's, the indicator can therefore be useful to detect consecutive sequence of length period, here 6 is selected on BTCUSD :
A consecutive up's/down's of period 6 can be considered a relatively rare event.
It is important to note that the color of the indicator used by default has nothing to do with the consecutive sequence detected, that is the indicator turning red doesn't necessarily mean that a consecutive down's sequence has occurred, but only that this sequence has occurred at a lower value than the precedent detected sequence. This is show'n below :
In order to make the indicator color based on the detected sequence check the "Color Based On Detected Sequence" option.
Conclusion
An original approach on filtering price variations has been proposed, i believe the indicator code is elegant as well as relatively efficient, and since high values of length can't really be used the indicator execution speed will remain relatively fast.
Thanks for reading !

$0 Monthly Weekly & Daily OHLC Viewer
Visualizer of current or previous month(s), week(s) & days ranges
Purpose: View last Monthly, Weekly, Daily, and/or a custom time interval OHLC, i.e. previously closed/confirmed or the ongoing higher time interval ranges
Main configurations available:
- 2 main reporting modes: View the current/ongoing M/W/D candles' OHLC (live, repaints) or report OHLC of last closed ones, i.e. previous Montly, Weekly and/or Daily
- View only latest Monthly, Weekly and/or Daily OHLC (lines) or all past ones (~channel)
- Set your own time interval for its price range(s) to be reported, e.g. last quarter '3M', 12H '720', or hide it
- View one specific day of the week OHLC reported all over the week
Graphic/visual configuration:
- Show the High & Low levels or not
- Show the Open & close levels or not
- Display a background color between top & down or lines only
- Change the background color depending if is/was rising or falling price
- Highlight the top & down breaches of higher timeframe resolution candles: Daily breaching last Weekly range, and/or the Weekly the Monthly one
- Colors & styling can be edited from the indicator's styling configuration panel
Depending on its expected usage, those configurations enable to:
- Consider previously closed candles OLHC as reference top & down ranges (support & resistance, breaches)
- Review chart's current candles evolution within their higher time interval / candle (M/W/D)
- Consider specific week days' range as a reference for the week trend
- Have a general overview of the market evolution trends
Default config is to view current candles evolving within their higher time interval / candle, while reporting last previously closed M+W is a preferred usage. Play with the config settings to find your setup.
View ongoing M+W+D OHLC with dynamic background color:
View previously closed M+W+D OHLC:
View closed H&L for M+W+D, latest only:
View Mondays' OHLC:
Feedback & support welcome.

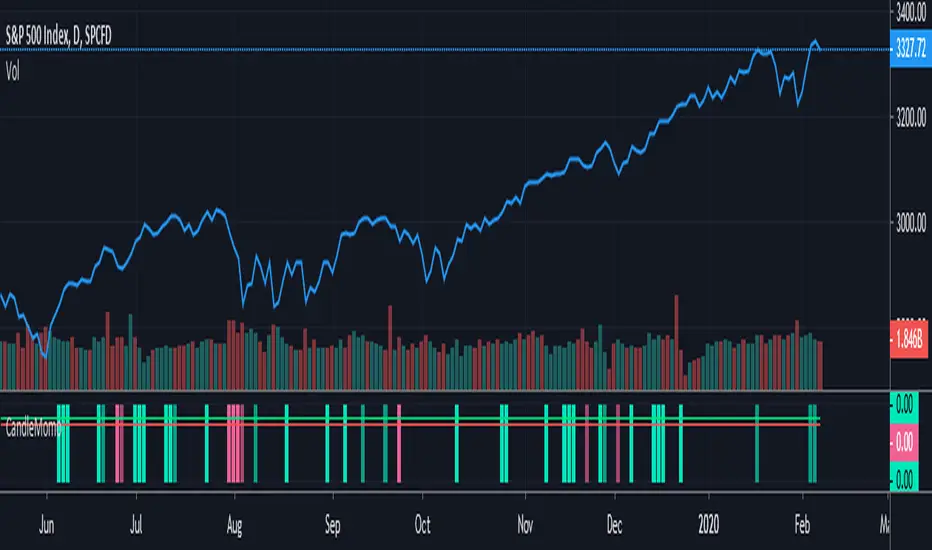
Consecutive Candle Count Momentum StrategyVery simple strategy based on consecutive candle count. Simple but can be very profitable if you know how to execute.
Example:
- Buy when consecutive up closes exceeds 3
- Sell when consecutive down closes exceeds 3
For a buy signal, if price closes higher within 5 candles, it is defined as a win.
For a sell signal, if price closes lower within 5 candles, it is defined as a win.
Win rates for buy/sell signals are calculated over history of security.
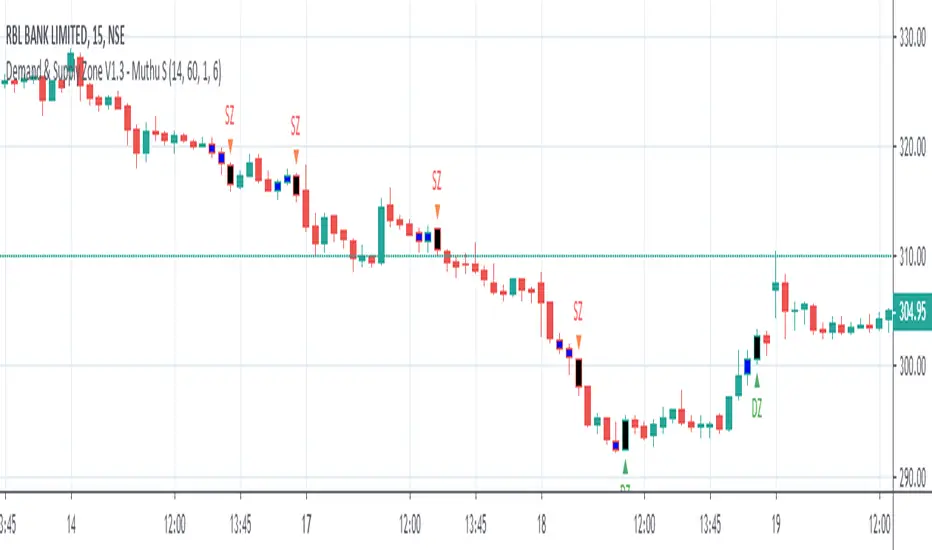
Demand & Supply Zone - Muthu SThis indicator marks Demand and Supply Zone on the chart based on various inputs. It also marks Boring candle in Blue colour & Explosive Candle in Black colour.
Prior knowledge of Demand and Supply Zone is mandatory to use this indicator effectively.
Kindly do your own math (based on your experience & knowledge) to identify the zones along with this indicator.
Boring & Explosive Candle - Muthu SThis Indicator marks Explosive candle (Black) and Boring Candle (Blue) on the chart based on various inputs like ATR Range, Legout Strength etc.

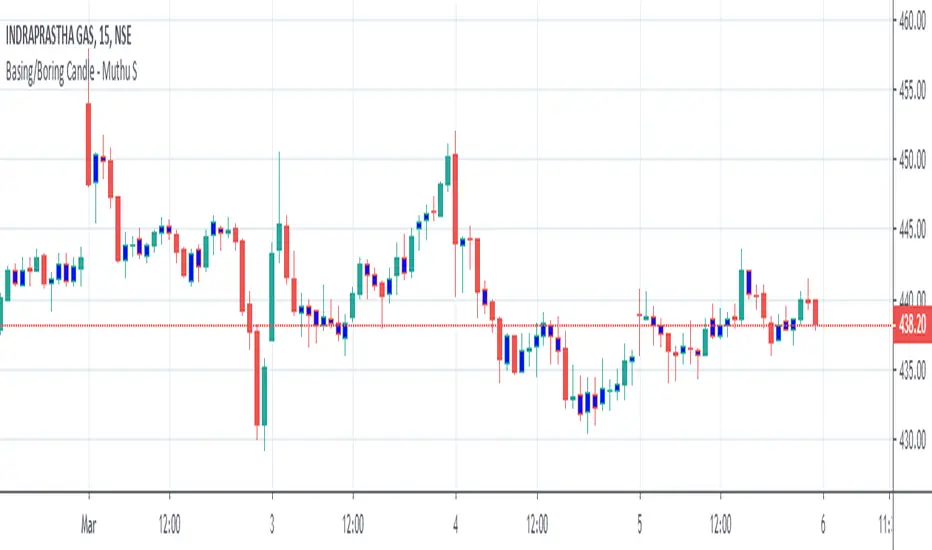
Boring Candle - Muthu SThis Indicator marks Boring Candle on the chart based on the input ATR Range.
Explosive Candle - Muthu SThis Indicator marks Explosive Candle on the chart based on various inputs like ATR Range, Legout Strength etc.

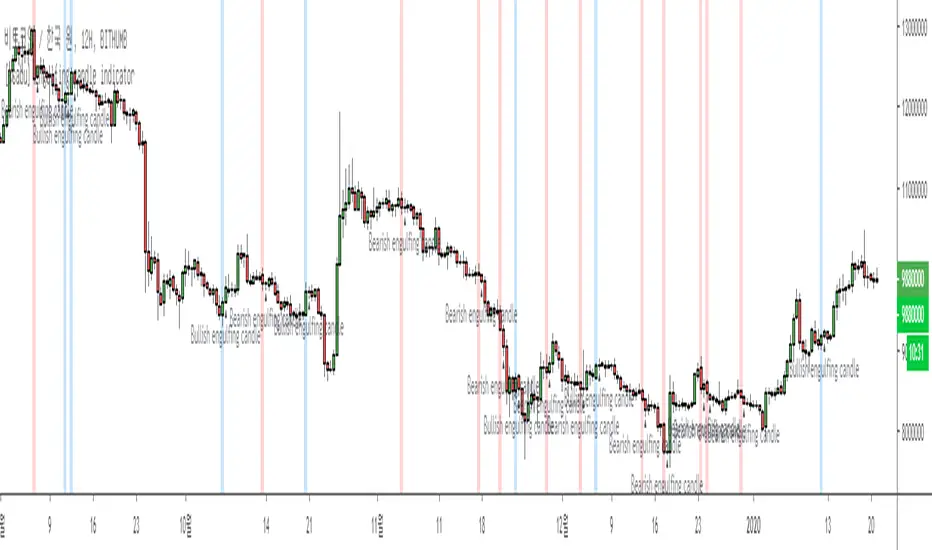
[ssabu] Engulfing candle indicatorUpload request indicator.
This is a subindex to capture a controlled can and post a message and notification when conditions are established.
Climbing control is a blue background with a Bullish Engulfing Candle.
The fall grip is on a red background and the Bearish Engulfing Candle.
요청지표 업로드 합니다.
장악형 캔들을 포착하여 조건이 성립하면 메시지 및 알림을 띄워주는 보조지표 입니다.
상승 장악형은 파란 배경에 Bullish engulfing candle
하락 장악형은 빨간 배경에 Bearish engulfing candle
메시지로 출력됩니다.
Volume Candle 4 typesThis is not my indicator, I just added one more pattern for my personal use.Credits goes to andreholanda73 .
