Institutional Execution Engine v3 [Nishith Rajwar]
Institutional Execution Engine v3
Market-Structure-Driven Execution Framework (Indicator + Strategy Hybrid)
The **Institutional Execution Engine v3** is a professional-grade execution framework designed to model **how institutional participants interact with liquidity, volatility regimes, and market structure**.
It is built for **index traders, crypto traders, and systematic intraday participants** who require **non-repainting, forward-validated signals** with strict risk control.
This is **not a mashup of indicators**.
Every module is purpose-built and interacts through a unified execution pipeline.
---
🔍 Core Concepts & Methodology
1️⃣ Market Structure & POI Engine
* Identifies **Points of Interest (POIs)** using swing structure, volatility context, and liquidity positioning
* POIs are **confirmed only after bar close** (strict non-repaint enforcement)
* Adaptive pivot sensitivity based on selected execution preset
2️⃣ Liquidity-Aware Scoring System
Each potential trade is filtered through a **multi-factor execution score**, including:
* Structural alignment
* Volatility normalization (ATR regime)
* Liquidity reaction quality
* Directional efficiency
Trades are only allowed when the **minimum institutional score threshold** is met.
3️⃣ Regime Detection (Forward-Walk Safe)
The engine dynamically classifies market conditions into execution regimes:
* Trending
* Rotational
* Mean-reverting
Regime detection is **forward-walk compatible** and does **not leak future data**.
4️⃣ Risk-First Execution Model
* ATR-normalized stop placement
* R-multiple-based take-profit targeting
* Optional **single-trade-per-session guard**
* Strategy engine includes **open-trade protection** to prevent over-execution
5️⃣ Strategy + Indicator Hybrid
This script can be used in **two ways**:
* **Indicator mode** → discretionary execution with visual POIs, signals, and context
* **Strategy mode** → systematic backtesting with full TradingView Strategy Tester support
Both modes share the **same execution logic** (no divergence).
---
⚙️ Preset-Driven Architecture
Built-in execution presets auto-configure internal parameters without changing core logic:
* **Scalp (Index)**
* **Daytrade (Index)**
* **Crypto Intraday**
* **Institutional Research (FWalk)**
Presets adjust pivot sensitivity, score thresholds, ATR behavior, and risk profile — while preserving execution integrity.
---
## 🚫 Non-Repainting & Data Integrity
* No look-ahead bias
* No future bar references
* No repainting signals
* VWAP and regime logic reset correctly per session
* Safe handling of strategy.opentrades to avoid execution errors
All signals are **bar-close confirmed**.
---
📊 Who This Is For
✔ Index traders (NIFTY / BANKNIFTY / SENSEX)
✔ Crypto intraday traders
✔ Systematic traders validating execution logic
✔ Traders who value **structure + liquidity + risk discipline** over indicators
---
⚠️ Disclaimer
This script is a **research and execution framework**, not financial advice.
Always forward-test and adapt risk parameters to your instrument and timeframe.
---
**Author:** Nishith Rajwar
**Version:** v3
**Execution Philosophy:** Trade where institutions execute — not where indicators react.
Candlestick analysis

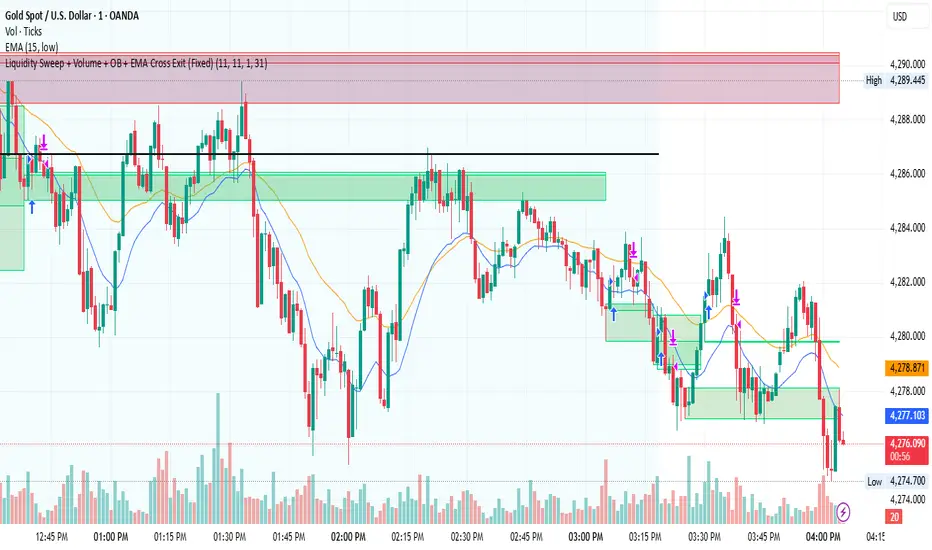
Liquidity Sweep + Volume + OB + EMA Cross Exit This strategy is a smart-money–inspired trading system designed to capture high-probability reversals after liquidity is taken from the market.
It combines liquidity sweeps, volume confirmation, order block validation, and a dynamic EMA-based exit to control risk and let profits run.
Core Concept
Institutions first take liquidity, then move price in the real direction.
This strategy aims to enter after liquidity is swept and price shows confirmation.
1️⃣ Liquidity Sweep Detection
2️⃣ Volume Confirmation
3️⃣ Order Block Identification
4️⃣ EMA Trend Filter (Optional Entry Bias)
5️⃣ Trade Entry Logic
6️⃣ Exit Strategy – EMA Cross Exit
Benefits:
Lets strong trends run
Exits automatically when momentum weakens
Adapts to different market conditions
🛡 Risk & Trade Management
One trade at a time (anti-overtrading logic)
Early exit if trade moves against position after a few bars
Opposite signal forces exit
EMA cross provides trend-based exit
Improved Candle Strategy (without daily squared)# Candle Pattern Trading Strategy
## Core Logic
Analyzes the last 5 candlesticks to identify "close at high" and "close at low" patterns, generating long/short signals.
## Trading Conditions
- **Long**: ≥2 bars closed at high in past 5 bars + current bar closes at high → Open long
- **Short**: ≥2 bars closed at low in past 5 bars + current bar closes at low → Open short
- **Filter**: If ≥3 doji patterns detected, skip trading
## Risk Management
- Stop Loss: Based on entry bar's high/low
- Take Profit: Risk × 2x multiplier
- Cooldown: No trading for 2 bars after entry
- Session Filter: No trading for first 5 bars after market open
## Configurable Parameters
- Lookback period, doji threshold, close proximity ratio, TP/SL ratio, cooldown bars, etc.
**Use Cases**: 1-minute and higher timeframes on stocks/futures

EMA 5/9 Angle + Candle Strength (SL=Open, TP=RR)EMA 5 / EMA 9 cross
Cross must have ~30° angle (approximated using slope → atan)
Entry candle must be bullish/bearish and also be Normal / 2nd Most / Most based on body-size percentile
Entry = close of signal candle
SL = open of signal candle
TP = 1:2 RR (editable input)

GOLD 5m PA ScalperXAUUSD 5-Minute Price Action Scalper with HTF Confirmation
This Pine Script is a trend-following scalping strategy designed specifically for XAUUSD (Gold) on the 1,3,5-minute timeframe.
Its main goal is to reduce noise and false signals by combining lower-timeframe price action with higher-timeframe (15-minute) structure.
CORE IDEA
Trade only in the direction of the dominant trend and only when price reacts from a strong higher-timeframe Order Block.

ARVEXV1“Failed Reversal – Opposite Candle Only (No Doji/Hammer/Hanging Man)”:
This strategy captures failed reversal attempts where the current candle is opposite to the previous candle and volume is higher. It enters long if a bearish candle fails to break a previous bullish candle’s low, and short if a bullish candle fails to break a previous bearish candle’s high. Signals are canceled for Doji, Hammer, or Hanging Man candles. Entries only, fully backtestable.

Ribbon Cross Strategy This strategy uses a simple moving-average ribbon crossover system with a customizable entry filter. You can choose whether trades trigger near the fast or slow average, allowing flexibility in capturing early or confirmed trend moves.
It’s best suited for index trading on intraday timeframes , helping identify short-term trend reversals and continuations with clear visual cues and backtestable logic.

ARVEX V1“Failed Reversal – Opposite Candle Only (No Doji/Hammer/Hanging Man)”:
This strategy captures failed reversal attempts where the current candle is opposite to the previous candle and volume is higher. It enters long if a bearish candle fails to break a previous bullish candle’s low, and short if a bullish candle fails to break a previous bearish candle’s high. Signals are canceled for Doji, Hammer, or Hanging Man candles. Entries only, fully backtestable.

MNO_2Step_Strategy_MOU_KAKU (Publish-Clear)//@version=5
strategy("MNO_2Step_Strategy_MOU_KAKU (Publish-Clear)", overlay=true, pyramiding=0,
max_labels_count=500, max_lines_count=500,
initial_capital=100000,
default_qty_type=strategy.percent_of_equity, default_qty_value=10)
// =========================
// Inputs
// =========================
emaSLen = input.int(5, "EMA Short (5)")
emaMLen = input.int(13, "EMA Mid (13)")
emaLLen = input.int(26, "EMA Long (26)")
macdFast = input.int(12, "MACD Fast")
macdSlow = input.int(26, "MACD Slow")
macdSignal = input.int(9, "MACD Signal")
macdZeroTh = input.float(0.2, "MOU: MACD near-zero threshold", step=0.05)
volLookback = input.int(5, "Volume MA days", minval=1)
volMinRatio = input.float(1.3, "MOU: Volume ratio min", step=0.1)
volStrong = input.float(1.5, "Strong volume ratio (Breakout/KAKU)", step=0.1)
volMaxRatio = input.float(3.0, "Volume ratio max (filter)", step=0.1)
wickBodyMult = input.float(2.0, "Pinbar: lowerWick >= body*x", step=0.1)
pivotLen = input.int(20, "Resistance lookback", minval=5)
pullMinPct = input.float(5.0, "Pullback min (%)", step=0.1)
pullMaxPct = input.float(15.0, "Pullback max (%)", step=0.1)
breakLookbackBars = input.int(5, "Pullback route: valid bars after break", minval=1)
// --- Breakout route (押し目なし初動ブレイク) ---
useBreakoutRoute = input.bool(true, "Enable MOU Breakout Route (no pullback)")
breakConfirmPct = input.float(0.3, "Break confirm: close > R*(1+%)", step=0.1)
bigBodyLookback = input.int(20, "Break candle body MA length", minval=5)
bigBodyMult = input.float(1.2, "Break candle: body >= MA*mult", step=0.1)
requireCloseNearHigh = input.bool(true, "Break candle: close near high")
closeNearHighPct = input.float(25.0, "Close near high threshold (% of range)", step=1.0)
allowMACDAboveZeroInstead = input.bool(true, "Breakout route: allow MACD GC above zero instead")
// 表示
showEMA = input.bool(true, "Plot EMAs")
showMouLabels = input.bool(true, "Show MOU/MOU-B labels")
showKakuLabels = input.bool(true, "Show KAKU labels")
showDebugTbl = input.bool(true, "Show debug table (last bar)")
showStatusLbl = input.bool(true, "Show status label (last bar always)")
locChoice = input.string("Below Bar", "Label location", options= )
lblLoc = locChoice == "Below Bar" ? location.belowbar : location.abovebar
// =========================
// 必ず決済が起きる設定(投稿クリア用)
// =========================
enableTPSL = input.bool(true, "Enable TP/SL")
tpPct = input.float(2.0, "Take Profit (%)", step=0.1, minval=0.1) // ←投稿クリア向けに近め
slPct = input.float(1.0, "Stop Loss (%)", step=0.1, minval=0.1) // ←投稿クリア向けに近め
maxHoldBars = input.int(30, "Max bars in trade (force close)", minval=1)
entryMode = input.string("MOU or KAKU", "Entry trigger", options= )
// ✅ 保険:トレード0件を避ける(投稿クリア用)
// 1回でもクローズトレードができたら自動で沈黙
publishAssist = input.bool(true, "Publish Assist (safety entry if 0 trades)")
// =========================
// EMA
// =========================
emaS = ta.ema(close, emaSLen)
emaM = ta.ema(close, emaMLen)
emaL = ta.ema(close, emaLLen)
plot(showEMA ? emaS : na, color=color.new(color.yellow, 0), title="EMA 5")
plot(showEMA ? emaM : na, color=color.new(color.blue, 0), title="EMA 13")
plot(showEMA ? emaL : na, color=color.new(color.orange, 0), title="EMA 26")
emaUpS = emaS > emaS
emaUpM = emaM > emaM
emaUpL = emaL > emaL
goldenOrder = emaS > emaM and emaM > emaL
above26_2days = close > emaL and close > emaL
baseTrendOK = (emaUpS and emaUpM and emaUpL) and goldenOrder and above26_2days
// =========================
// MACD
// =========================
= ta.macd(close, macdFast, macdSlow, macdSignal)
macdGC = ta.crossover(macdLine, macdSig)
macdUp = macdLine > macdLine
macdNearZero = math.abs(macdLine) <= macdZeroTh
macdGCAboveZero = macdGC and macdLine > 0 and macdSig > 0
macdMouOK = macdGC and macdNearZero and macdUp
macdBreakOK = allowMACDAboveZeroInstead ? (macdMouOK or macdGCAboveZero) : macdMouOK
// =========================
// Volume
// =========================
volMA = ta.sma(volume, volLookback)
volRatio = volMA > 0 ? (volume / volMA) : na
volumeMouOK = volRatio >= volMinRatio and volRatio <= volMaxRatio
volumeStrongOK = volRatio >= volStrong and volRatio <= volMaxRatio
// =========================
// Candle patterns
// =========================
body = math.abs(close - open)
upperWick = high - math.max(open, close)
lowerWick = math.min(open, close) - low
pinbar = (lowerWick >= wickBodyMult * body) and (lowerWick > upperWick) and (close >= open)
bullEngulf = close > open and close < open and close >= open and open <= close
bigBull = close > open and open < emaM and close > emaS and (body > ta.sma(body, 20))
candleOK = pinbar or bullEngulf or bigBull
// =========================
// Resistance / Pullback route
// =========================
res = ta.highest(high, pivotLen)
pullbackPct = res > 0 ? (res - close) / res * 100.0 : na
pullbackOK = pullbackPct >= pullMinPct and pullbackPct <= pullMaxPct
brokeRes = ta.crossover(close, res )
barsSinceBreak = ta.barssince(brokeRes)
afterBreakZone = (barsSinceBreak >= 0) and (barsSinceBreak <= breakLookbackBars)
pullbackRouteOK = afterBreakZone and pullbackOK
// =========================
// Breakout route (押し目なし初動ブレイク)
// =========================
breakConfirm = close > res * (1.0 + breakConfirmPct / 100.0)
bullBreak = close > open
bodyMA = ta.sma(body, bigBodyLookback)
bigBodyOK = bodyMA > 0 ? (body >= bodyMA * bigBodyMult) : false
rng = math.max(high - low, syminfo.mintick)
closeNearHighOK = not requireCloseNearHigh ? true : ((high - close) / rng * 100.0 <= closeNearHighPct)
mou_breakout = useBreakoutRoute and baseTrendOK and breakConfirm and bullBreak and bigBodyOK and closeNearHighOK and volumeStrongOK and macdBreakOK
mou_pullback = baseTrendOK and volumeMouOK and candleOK and macdMouOK and pullbackRouteOK
mou = mou_pullback or mou_breakout
// =========================
// KAKU (Strict): 8条件 + 最終三点
// =========================
cond1 = emaUpS and emaUpM and emaUpL
cond2 = goldenOrder
cond3 = above26_2days
cond4 = macdGCAboveZero
cond5 = volumeMouOK
cond6 = candleOK
cond7 = pullbackOK
cond8 = pullbackRouteOK
all8_strict = cond1 and cond2 and cond3 and cond4 and cond5 and cond6 and cond7 and cond8
final3 = pinbar and macdGCAboveZero and volumeStrongOK
kaku = all8_strict and final3
// =========================
// Entry (strategy)
// =========================
entrySignal = entryMode == "KAKU only" ? kaku : (mou or kaku)
canEnter = strategy.position_size == 0
newEntryKaku = canEnter and kaku and entrySignal
newEntryMouB = canEnter and (not kaku) and mou_breakout and entrySignal
newEntryMou = canEnter and (not kaku) and mou_pullback and entrySignal
// --- Publish Assist(保険エントリー) ---
// 条件が厳しすぎて「トレード0件」だと投稿時に警告が出る。
// closedtradesが0の間だけ、軽いEMAクロスで1回だけ拾う(その後は沈黙)。
assistFast = ta.ema(close, 5)
assistSlow = ta.ema(close, 20)
assistEntry = publishAssist and strategy.closedtrades == 0 and canEnter and ta.crossover(assistFast, assistSlow)
// 実エントリー
if newEntryKaku or newEntryMouB or newEntryMou or assistEntry
strategy.entry("LONG", strategy.long)
// ラベル(視認)
if showMouLabels and newEntryMou
label.new(bar_index, low, "猛(IN)", style=label.style_label_up, color=color.new(color.lime, 0), textcolor=color.black)
if showMouLabels and newEntryMouB
label.new(bar_index, low, "猛B(IN)", style=label.style_label_up, color=color.new(color.lime, 0), textcolor=color.black)
if showKakuLabels and newEntryKaku
label.new(bar_index, low, "確(IN)", style=label.style_label_up, color=color.new(color.yellow, 0), textcolor=color.black)
if assistEntry
label.new(bar_index, low, "ASSIST(IN)", style=label.style_label_up, color=color.new(color.aqua, 0), textcolor=color.black)
// =========================
// Exit (TP/SL + 強制クローズ)
// =========================
inPos = strategy.position_size > 0
tpPx = inPos ? strategy.position_avg_price * (1.0 + tpPct/100.0) : na
slPx = inPos ? strategy.position_avg_price * (1.0 - slPct/100.0) : na
if enableTPSL
strategy.exit("TP/SL", from_entry="LONG", limit=tpPx, stop=slPx)
// 最大保有バーで強制決済(これが「レポート無し」回避の最後の保険)
var int entryBar = na
if strategy.position_size > 0 and strategy.position_size == 0
entryBar := bar_index
if strategy.position_size == 0
entryBar := na
forceClose = inPos and not na(entryBar) and (bar_index - entryBar >= maxHoldBars)
if forceClose
strategy.close("LONG")
// =========================
// 利確/損切/強制クローズのラベル
// =========================
closedThisBar = (strategy.position_size > 0) and (strategy.position_size == 0)
avgPrev = strategy.position_avg_price
tpPrev = avgPrev * (1.0 + tpPct/100.0)
slPrev = avgPrev * (1.0 - slPct/100.0)
hitTP = closedThisBar and high >= tpPrev
hitSL = closedThisBar and low <= slPrev
// 同一足TP/SL両方は厳密に判断できないので、表示は「TP優先」で簡略(投稿ギリギリ版)
if hitTP
label.new(bar_index, high, "利確", style=label.style_label_down, color=color.new(color.lime, 0), textcolor=color.black)
else if hitSL
label.new(bar_index, low, "損切", style=label.style_label_up, color=color.new(color.red, 0), textcolor=color.white)
else if closedThisBar and forceClose
label.new(bar_index, close, "時間決済", style=label.style_label_left, color=color.new(color.gray, 0), textcolor=color.white)
// =========================
// Signals (猛/猛B/確)
// =========================
plotshape(showMouLabels and mou_pullback and not kaku, title="MOU_PULLBACK", style=shape.labelup, text="猛",
color=color.new(color.lime, 0), textcolor=color.black, location=lblLoc, size=size.tiny)
plotshape(showMouLabels and mou_breakout and not kaku, title="MOU_BREAKOUT", style=shape.labelup, text="猛B",
color=color.new(color.lime, 0), textcolor=color.black, location=lblLoc, size=size.tiny)
plotshape(showKakuLabels and kaku, title="KAKU", style=shape.labelup, text="確",
color=color.new(color.yellow, 0), textcolor=color.black, location=lblLoc, size=size.small)
// =========================
// Alerts
// =========================
alertcondition(mou, title="MNO_MOU", message="MNO: MOU triggered")
alertcondition(mou_breakout, title="MNO_MOU_BREAKOUT", message="MNO: MOU Breakout triggered")
alertcondition(mou_pullback, title="MNO_MOU_PULLBACK", message="MNO: MOU Pullback triggered")
alertcondition(kaku, title="MNO_KAKU", message="MNO: KAKU triggered")
alertcondition(assistEntry, title="MNO_ASSIST_ENTRY", message="MNO: ASSIST ENTRY (publish safety)")
// =========================
// Status label(最終足に必ず表示)
// =========================
var label status = na
if showStatusLbl and barstate.islast
label.delete(status)
statusTxt =
"MNO RUNNING " +
"ClosedTrades: " + str.tostring(strategy.closedtrades) + " " +
"BaseTrend: " + (baseTrendOK ? "OK" : "NO") + " " +
"MOU: " + (mou ? "YES" : "no") + " (猛=" + (mou_pullback ? "Y" : "n") + " / 猛B=" + (mou_breakout ? "Y" : "n") + ") " +
"KAKU: " + (kaku ? "YES" : "no") + " " +
"VolRatio: " + (na(volRatio) ? "na" : str.tostring(volRatio, format.mintick)) + " " +
"Pull%: " + (na(pullbackPct) ? "na" : str.tostring(pullbackPct, format.mintick)) + " " +
"Pos: " + (inPos ? "IN" : "OUT")
status := label.new(bar_index, high, statusTxt, style=label.style_label_left, textcolor=color.white, color=color.new(color.black, 0))
// =========================
// Debug table(最終足のみ)
// =========================
var table t = table.new(position.top_right, 2, 14, border_width=1, border_color=color.new(color.white, 60))
fRow(_name, _cond, _r) =>
bg = _cond ? color.new(color.lime, 70) : color.new(color.red, 80)
tx = _cond ? "OK" : "NO"
table.cell(t, 0, _r, _name, text_color=color.white, bgcolor=color.new(color.black, 0))
table.cell(t, 1, _r, tx, text_color=color.white, bgcolor=bg)
if showDebugTbl and barstate.islast
table.cell(t, 0, 0, "MNO Debug", text_color=color.white, bgcolor=color.new(color.black, 0))
table.cell(t, 1, 0, "", text_color=color.white, bgcolor=color.new(color.black, 0))
fRow("BaseTrend", baseTrendOK, 1)
fRow("MOU Pullback", mou_pullback, 2)
fRow("MOU Breakout", mou_breakout, 3)
fRow("Break confirm", breakConfirm, 4)
fRow("Break big body", bigBodyOK, 5)
fRow("Break close high", closeNearHighOK, 6)
fRow("Break vol strong", volumeStrongOK, 7)
fRow("Break MACD", macdBreakOK, 8)
fRow("KAKU all8", all8_strict, 9)
fRow("KAKU final3", final3, 10)
fRow("AssistEntry", assistEntry, 11)
fRow("ClosedTrades>0", strategy.closedtrades > 0, 12)

just takesi TimeMNO_2Step_Strategy_MOU_KAKU (Publish-Clear)//@version=5
strategy("MNO_2Step_Strategy_MOU_KAKU (Publish-Clear)", overlay=true, pyramiding=0,
max_labels_count=500, max_lines_count=500,
initial_capital=100000,
default_qty_type=strategy.percent_of_equity, default_qty_value=10)
// =========================
// Inputs
// =========================
emaSLen = input.int(5, "EMA Short (5)")
emaMLen = input.int(13, "EMA Mid (13)")
emaLLen = input.int(26, "EMA Long (26)")
macdFast = input.int(12, "MACD Fast")
macdSlow = input.int(26, "MACD Slow")
macdSignal = input.int(9, "MACD Signal")
macdZeroTh = input.float(0.2, "MOU: MACD near-zero threshold", step=0.05)
volLookback = input.int(5, "Volume MA days", minval=1)
volMinRatio = input.float(1.3, "MOU: Volume ratio min", step=0.1)
volStrong = input.float(1.5, "Strong volume ratio (Breakout/KAKU)", step=0.1)
volMaxRatio = input.float(3.0, "Volume ratio max (filter)", step=0.1)
wickBodyMult = input.float(2.0, "Pinbar: lowerWick >= body*x", step=0.1)
pivotLen = input.int(20, "Resistance lookback", minval=5)
pullMinPct = input.float(5.0, "Pullback min (%)", step=0.1)
pullMaxPct = input.float(15.0, "Pullback max (%)", step=0.1)
breakLookbackBars = input.int(5, "Pullback route: valid bars after break", minval=1)
// --- Breakout route (押し目なし初動ブレイク) ---
useBreakoutRoute = input.bool(true, "Enable MOU Breakout Route (no pullback)")
breakConfirmPct = input.float(0.3, "Break confirm: close > R*(1+%)", step=0.1)
bigBodyLookback = input.int(20, "Break candle body MA length", minval=5)
bigBodyMult = input.float(1.2, "Break candle: body >= MA*mult", step=0.1)
requireCloseNearHigh = input.bool(true, "Break candle: close near high")
closeNearHighPct = input.float(25.0, "Close near high threshold (% of range)", step=1.0)
allowMACDAboveZeroInstead = input.bool(true, "Breakout route: allow MACD GC above zero instead")
// 表示
showEMA = input.bool(true, "Plot EMAs")
showMouLabels = input.bool(true, "Show MOU/MOU-B labels")
showKakuLabels = input.bool(true, "Show KAKU labels")
showDebugTbl = input.bool(true, "Show debug table (last bar)")
showStatusLbl = input.bool(true, "Show status label (last bar always)")
locChoice = input.string("Below Bar", "Label location", options= )
lblLoc = locChoice == "Below Bar" ? location.belowbar : location.abovebar
// =========================
// 必ず決済が起きる設定(投稿クリア用)
// =========================
enableTPSL = input.bool(true, "Enable TP/SL")
tpPct = input.float(2.0, "Take Profit (%)", step=0.1, minval=0.1) // ←投稿クリア向けに近め
slPct = input.float(1.0, "Stop Loss (%)", step=0.1, minval=0.1) // ←投稿クリア向けに近め
maxHoldBars = input.int(30, "Max bars in trade (force close)", minval=1)
entryMode = input.string("MOU or KAKU", "Entry trigger", options= )
// ✅ 保険:トレード0件を避ける(投稿クリア用)
// 1回でもクローズトレードができたら自動で沈黙
publishAssist = input.bool(true, "Publish Assist (safety entry if 0 trades)")
// =========================
// EMA
// =========================
emaS = ta.ema(close, emaSLen)
emaM = ta.ema(close, emaMLen)
emaL = ta.ema(close, emaLLen)
plot(showEMA ? emaS : na, color=color.new(color.yellow, 0), title="EMA 5")
plot(showEMA ? emaM : na, color=color.new(color.blue, 0), title="EMA 13")
plot(showEMA ? emaL : na, color=color.new(color.orange, 0), title="EMA 26")
emaUpS = emaS > emaS
emaUpM = emaM > emaM
emaUpL = emaL > emaL
goldenOrder = emaS > emaM and emaM > emaL
above26_2days = close > emaL and close > emaL
baseTrendOK = (emaUpS and emaUpM and emaUpL) and goldenOrder and above26_2days
// =========================
// MACD
// =========================
= ta.macd(close, macdFast, macdSlow, macdSignal)
macdGC = ta.crossover(macdLine, macdSig)
macdUp = macdLine > macdLine
macdNearZero = math.abs(macdLine) <= macdZeroTh
macdGCAboveZero = macdGC and macdLine > 0 and macdSig > 0
macdMouOK = macdGC and macdNearZero and macdUp
macdBreakOK = allowMACDAboveZeroInstead ? (macdMouOK or macdGCAboveZero) : macdMouOK
// =========================
// Volume
// =========================
volMA = ta.sma(volume, volLookback)
volRatio = volMA > 0 ? (volume / volMA) : na
volumeMouOK = volRatio >= volMinRatio and volRatio <= volMaxRatio
volumeStrongOK = volRatio >= volStrong and volRatio <= volMaxRatio
// =========================
// Candle patterns
// =========================
body = math.abs(close - open)
upperWick = high - math.max(open, close)
lowerWick = math.min(open, close) - low
pinbar = (lowerWick >= wickBodyMult * body) and (lowerWick > upperWick) and (close >= open)
bullEngulf = close > open and close < open and close >= open and open <= close
bigBull = close > open and open < emaM and close > emaS and (body > ta.sma(body, 20))
candleOK = pinbar or bullEngulf or bigBull
// =========================
// Resistance / Pullback route
// =========================
res = ta.highest(high, pivotLen)
pullbackPct = res > 0 ? (res - close) / res * 100.0 : na
pullbackOK = pullbackPct >= pullMinPct and pullbackPct <= pullMaxPct
brokeRes = ta.crossover(close, res )
barsSinceBreak = ta.barssince(brokeRes)
afterBreakZone = (barsSinceBreak >= 0) and (barsSinceBreak <= breakLookbackBars)
pullbackRouteOK = afterBreakZone and pullbackOK
// =========================
// Breakout route (押し目なし初動ブレイク)
// =========================
breakConfirm = close > res * (1.0 + breakConfirmPct / 100.0)
bullBreak = close > open
bodyMA = ta.sma(body, bigBodyLookback)
bigBodyOK = bodyMA > 0 ? (body >= bodyMA * bigBodyMult) : false
rng = math.max(high - low, syminfo.mintick)
closeNearHighOK = not requireCloseNearHigh ? true : ((high - close) / rng * 100.0 <= closeNearHighPct)
mou_breakout = useBreakoutRoute and baseTrendOK and breakConfirm and bullBreak and bigBodyOK and closeNearHighOK and volumeStrongOK and macdBreakOK
mou_pullback = baseTrendOK and volumeMouOK and candleOK and macdMouOK and pullbackRouteOK
mou = mou_pullback or mou_breakout
// =========================
// KAKU (Strict): 8条件 + 最終三点
// =========================
cond1 = emaUpS and emaUpM and emaUpL
cond2 = goldenOrder
cond3 = above26_2days
cond4 = macdGCAboveZero
cond5 = volumeMouOK
cond6 = candleOK
cond7 = pullbackOK
cond8 = pullbackRouteOK
all8_strict = cond1 and cond2 and cond3 and cond4 and cond5 and cond6 and cond7 and cond8
final3 = pinbar and macdGCAboveZero and volumeStrongOK
kaku = all8_strict and final3
// =========================
// Entry (strategy)
// =========================
entrySignal = entryMode == "KAKU only" ? kaku : (mou or kaku)
canEnter = strategy.position_size == 0
newEntryKaku = canEnter and kaku and entrySignal
newEntryMouB = canEnter and (not kaku) and mou_breakout and entrySignal
newEntryMou = canEnter and (not kaku) and mou_pullback and entrySignal
// --- Publish Assist(保険エントリー) ---
// 条件が厳しすぎて「トレード0件」だと投稿時に警告が出る。
// closedtradesが0の間だけ、軽いEMAクロスで1回だけ拾う(その後は沈黙)。
assistFast = ta.ema(close, 5)
assistSlow = ta.ema(close, 20)
assistEntry = publishAssist and strategy.closedtrades == 0 and canEnter and ta.crossover(assistFast, assistSlow)
// 実エントリー
if newEntryKaku or newEntryMouB or newEntryMou or assistEntry
strategy.entry("LONG", strategy.long)
// ラベル(視認)
if showMouLabels and newEntryMou
label.new(bar_index, low, "猛(IN)", style=label.style_label_up, color=color.new(color.lime, 0), textcolor=color.black)
if showMouLabels and newEntryMouB
label.new(bar_index, low, "猛B(IN)", style=label.style_label_up, color=color.new(color.lime, 0), textcolor=color.black)
if showKakuLabels and newEntryKaku
label.new(bar_index, low, "確(IN)", style=label.style_label_up, color=color.new(color.yellow, 0), textcolor=color.black)
if assistEntry
label.new(bar_index, low, "ASSIST(IN)", style=label.style_label_up, color=color.new(color.aqua, 0), textcolor=color.black)
// =========================
// Exit (TP/SL + 強制クローズ)
// =========================
inPos = strategy.position_size > 0
tpPx = inPos ? strategy.position_avg_price * (1.0 + tpPct/100.0) : na
slPx = inPos ? strategy.position_avg_price * (1.0 - slPct/100.0) : na
if enableTPSL
strategy.exit("TP/SL", from_entry="LONG", limit=tpPx, stop=slPx)
// 最大保有バーで強制決済(これが「レポート無し」回避の最後の保険)
var int entryBar = na
if strategy.position_size > 0 and strategy.position_size == 0
entryBar := bar_index
if strategy.position_size == 0
entryBar := na
forceClose = inPos and not na(entryBar) and (bar_index - entryBar >= maxHoldBars)
if forceClose
strategy.close("LONG")
// =========================
// 利確/損切/強制クローズのラベル
// =========================
closedThisBar = (strategy.position_size > 0) and (strategy.position_size == 0)
avgPrev = strategy.position_avg_price
tpPrev = avgPrev * (1.0 + tpPct/100.0)
slPrev = avgPrev * (1.0 - slPct/100.0)
hitTP = closedThisBar and high >= tpPrev
hitSL = closedThisBar and low <= slPrev
// 同一足TP/SL両方は厳密に判断できないので、表示は「TP優先」で簡略(投稿ギリギリ版)
if hitTP
label.new(bar_index, high, "利確", style=label.style_label_down, color=color.new(color.lime, 0), textcolor=color.black)
else if hitSL
label.new(bar_index, low, "損切", style=label.style_label_up, color=color.new(color.red, 0), textcolor=color.white)
else if closedThisBar and forceClose
label.new(bar_index, close, "時間決済", style=label.style_label_left, color=color.new(color.gray, 0), textcolor=color.white)
// =========================
// Signals (猛/猛B/確)
// =========================
plotshape(showMouLabels and mou_pullback and not kaku, title="MOU_PULLBACK", style=shape.labelup, text="猛",
color=color.new(color.lime, 0), textcolor=color.black, location=lblLoc, size=size.tiny)
plotshape(showMouLabels and mou_breakout and not kaku, title="MOU_BREAKOUT", style=shape.labelup, text="猛B",
color=color.new(color.lime, 0), textcolor=color.black, location=lblLoc, size=size.tiny)
plotshape(showKakuLabels and kaku, title="KAKU", style=shape.labelup, text="確",
color=color.new(color.yellow, 0), textcolor=color.black, location=lblLoc, size=size.small)
// =========================
// Alerts
// =========================
alertcondition(mou, title="MNO_MOU", message="MNO: MOU triggered")
alertcondition(mou_breakout, title="MNO_MOU_BREAKOUT", message="MNO: MOU Breakout triggered")
alertcondition(mou_pullback, title="MNO_MOU_PULLBACK", message="MNO: MOU Pullback triggered")
alertcondition(kaku, title="MNO_KAKU", message="MNO: KAKU triggered")
alertcondition(assistEntry, title="MNO_ASSIST_ENTRY", message="MNO: ASSIST ENTRY (publish safety)")
// =========================
// Status label(最終足に必ず表示)
// =========================
var label status = na
if showStatusLbl and barstate.islast
label.delete(status)
statusTxt =
"MNO RUNNING " +
"ClosedTrades: " + str.tostring(strategy.closedtrades) + " " +
"BaseTrend: " + (baseTrendOK ? "OK" : "NO") + " " +
"MOU: " + (mou ? "YES" : "no") + " (猛=" + (mou_pullback ? "Y" : "n") + " / 猛B=" + (mou_breakout ? "Y" : "n") + ") " +
"KAKU: " + (kaku ? "YES" : "no") + " " +
"VolRatio: " + (na(volRatio) ? "na" : str.tostring(volRatio, format.mintick)) + " " +
"Pull%: " + (na(pullbackPct) ? "na" : str.tostring(pullbackPct, format.mintick)) + " " +
"Pos: " + (inPos ? "IN" : "OUT")
status := label.new(bar_index, high, statusTxt, style=label.style_label_left, textcolor=color.white, color=color.new(color.black, 0))
// =========================
// Debug table(最終足のみ)
// =========================
var table t = table.new(position.top_right, 2, 14, border_width=1, border_color=color.new(color.white, 60))
fRow(_name, _cond, _r) =>
bg = _cond ? color.new(color.lime, 70) : color.new(color.red, 80)
tx = _cond ? "OK" : "NO"
table.cell(t, 0, _r, _name, text_color=color.white, bgcolor=color.new(color.black, 0))
table.cell(t, 1, _r, tx, text_color=color.white, bgcolor=bg)
if showDebugTbl and barstate.islast
table.cell(t, 0, 0, "MNO Debug", text_color=color.white, bgcolor=color.new(color.black, 0))
table.cell(t, 1, 0, "", text_color=color.white, bgcolor=color.new(color.black, 0))
fRow("BaseTrend", baseTrendOK, 1)
fRow("MOU Pullback", mou_pullback, 2)
fRow("MOU Breakout", mou_breakout, 3)
fRow("Break confirm", breakConfirm, 4)
fRow("Break big body", bigBodyOK, 5)
fRow("Break close high", closeNearHighOK, 6)
fRow("Break vol strong", volumeStrongOK, 7)
fRow("Break MACD", macdBreakOK, 8)
fRow("KAKU all8", all8_strict, 9)
fRow("KAKU final3", final3, 10)
fRow("AssistEntry", assistEntry, 11)
fRow("ClosedTrades>0", strategy.closedtrades > 0, 12)

Wavelet Candlestick Slope Follower-Master Edition Here is a short description of this script:
This is a **Trend Following strategy** that utilizes advanced mathematics—the **Wavelet Transform**—to filter out market noise.
**Key Features:**
1. **Synthetic Candles:** The script does not analyze raw prices. Instead, it constructs "Wavelet Candles"—smoothed candles created through mathematical convolution of prices with a specific wavelet "kernel" (e.g., Mexican Hat, Morlet, Haar).
2. **Auto-Correction (Normalization):** This is the most critical technical feature of this code. The script automatically normalizes the weights. This ensures that even when using complex mathematical shapes (like the Mexican Hat), the output price remains accurate to the real chart scale and is not distorted.
3. **Strategy Logic:** The logic is very straightforward—the system enters a **Long** position when the smoothed closing price (`w_close`) is rising, and closes the position when it starts to fall.
4. **Visualization:** It draws new, cleaner candles (green/red) on the chart, revealing the "true" trend structure after filtering out temporary fluctuations.
This is a example of use idea of wavelet candle

Hammer/Inv Hammer + ema and other settings + stratok, so thrown everything at this one as the previous only had longs.
so we have all the options, but main feature is the ema to divide up the longs and short, shorts above, longs below, we all know price ends up back to the ema at some point.
I have added a volume filter, this calculates the average volume from the last "20" candles (which can be adjusted) then when a hammer appears it has to be larger than the average volume to be valid.
Also added trading hours in, if you are switching between RTH and ETH it can cause issue if it enters a position EOD then you get an anomaly trade as we can hold positions past certain times.
Also added some trading strategy, so after 2 wins it wont trade again that day or after 1 loss. you decide.
So much to play with now.

Smart Money Bot [MTF Confluence Edition]Uses multi-time frame analysis and supply and demand strategy.
Best used when swing trading.

Crypto LONG PYThis trading approach is a powerful combination of technical tools aimed at taking advantage of market fluctuations with precision and reliability. By integrating Bollinger Bands (BB), the Relative Strength Index (RSI), Exponential Moving Averages (EMA), and Fibonacci retracement levels (Fib), we create a strategy that captures key market moves and helps identify optimal entry and exit points, all within the context of the New York market conditions (NY).
Bollinger Bands provide insight into market volatility, offering signals about potential extreme price movements. The RSI is used to measure momentum and assess overbought or oversold conditions, indicating when the market might be nearing a reversal. Meanwhile, EMAs add a layer of smoothing, allowing us to observe short- and medium-term trends, helping filter out false signals and providing a clearer view of the overall market direction.
Additionally, Fibonacci retracements are integrated to identify key support and resistance levels, pinpointing potential areas of price retracement and continuation. When combined, these indicators offer a holistic approach to navigating the markets, enabling traders to make data-driven, informed decisions.
This approach is ideal for traders looking for a meticulous methodology for trading during the NY session, where liquidity and volatility tend to be at their highest. Leverage the synergy between these indicators to optimize your trading strategy and maximize your market performance.

Simple ICT Sweep + FVG (LuxAlgo Swings FIXED)something i created if anyone can improve it or change for better visual

Hammer Strategy (CLOSE ON NEXT BAR) [WORKING]Adjustable hammer and inverted hammer candle
Ham? INV? is the hammer
Entry on HAM, INV OR HAM?, INV? close next bar

Hammer Breakout (Adjustable RR)Hammer candle detection and strat for back testing.
diamond indicates a detected hammer candle, the position is entered at the hammer candle close.
Stop loss below the hammer candle wick.
Adjustbale rr based on the distance to the stop (bottom of wick)

Multi-MA + RSI Pullback Strategy (Jordan)1️⃣ Strategy logic I’ll code
From your screenshots:
Indicators
• EMAs: 600 / 200 / 100 / 50
• RSI: length 6, levels 80 / 20
Rules (simplified so a script can handle them):
• Use a higher-timeframe trend filter (15m or 1h) using the EMAs.
• Take entries on the chart timeframe (you can use 1m or 5m).
• Long:
• Higher-TF trend is up.
• Price is pulling back into a zone (between 50 EMA and 100 EMA on the entry timeframe – this approximates your 50–61% retrace).
• RSI crosses below 20 (oversold).
• Short:
• Higher-TF trend is down.
• Price pulls back between 50 & 100 EMAs.
• RSI crosses above 80 (overbought).
• Exits: ATR-based stop + take-profit with adjustable R:R (2:1 or 3:1).
• Max 4 trades per day.
News filter & “only trade gold” you handle manually (run it on XAUUSD and avoid news times yourself – TradingView can’t read the economic calendar from code).

Trend Following $ZEC - Multi-Timeframe Structure Filter + Revers# Trend Following CRYPTOCAP:ZEC - Strategy Guide
## 📊 Strategy Overview
Trend Following CRYPTOCAP:ZEC is an enhanced Turtle Trading system designed for cryptocurrency spot trading, combining Donchian Channel breakouts, multi-timeframe structure filtering, and ATR-based dynamic risk management for both long and short positions.
---
## 🎯 Core Features
1. Multi-Timeframe Structure Filtering
- Uses Swing High/Low to identify market structure
- Customizable structure timeframe (default: 1 minute)
- Only enters trades in the direction of the trend, avoiding counter-trend positions
2. Reverse Signal Exit
- No fixed stop-loss or fixed-period exits
- Exits only when a reverse entry signal triggers
- Maximizes trend profits, reduces premature exits
3. ATR Dynamic Pyramiding
- Adds positions when price moves 0.5 ATR in favorable direction
- Supports up to 2 units maximum (adjustable)
- Pyramid scaling to enhance profitability
4. Complete Risk Management
- Fixed position size (5000 USD per unit)
- Commission fee 0.06% (Binance spot rate)
- Initial capital 10,000 USD
---
## 📈 Trading Logic
Entry Conditions
✅ Long Entry:
- Close price breaks above 20-period high
- Structure trend is bullish (price breaks above Swing High)
✅ Short Entry:
- Close price breaks below 20-period low
- Structure trend is bearish (price breaks below Swing Low)
Add Position Conditions
- Long: Price rises ≥ 0.5 ATR
- Short: Price falls ≥ 0.5 ATR
- Maximum 2 units including initial entry
Exit Conditions
- Long Exit: When short entry signal triggers (price breaks 20-period low + structure turns bearish)
- Short Exit: When long entry signal triggers (price breaks 20-period high + structure turns bullish)
---
## ⚙️ Parameter Settings
Channel Settings
- Entry Channel Period: 20 (Donchian Channel breakout period)
- Exit Channel Period: 10 (reserved parameter, actually uses reverse signal exit)
ATR Settings
- ATR Period: 20
- Stop Loss ATR Multiplier: 2.0 (reserved parameter)
- Add Position ATR Multiplier: 0.5
Structure Filter
- Swing Length: 160 (Swing High/Low calculation period)
- Structure Timeframe: 1 minute (can change to 5/15/60, etc.)
Position Management
- Maximum Units: 2 (including initial entry)
- Capital Per Unit: 5000 USD
---
## 🎨 Visualization Features
Background Colors
- Light Green: Bullish structure
- Light Red: Bearish structure
- Dark Green: Long entry
- Dark Red: Short entry
Optional Display (Default: OFF)
- Entry/exit channel lines
- Structure high/low lines
- ATR stop-loss line
- Next add position indicator
- Entry/exit labels
---
## 📱 Alert Message Format
Strategy sends notifications on entry/exit with the following format:
- Entry: `1m Long EP:428.26`
- Add Position: `15m Add Long 2/2 EP:429.50`
- Exit: `1m Close Long Reverse Signal`
Where:
- `1m`/`15m` = Current chart timeframe
- `EP` = Entry Price
---
## 💰 Backtest Settings
Capital Allocation
- Initial Capital: 10,000 USD
- Per Entry: 5,000 USD (split into 2 entries)
- Leverage: 0x (spot trading)
Trading Costs
- Commission: 0.06% (Binance spot VIP0)
- Slippage: 0
---
## 🎯 Use Cases
✅ Best Scenarios
- Trending markets
- Moderate volatility assets
- 1-minute to 4-hour timeframes
⚠️ Not Suitable For
- Highly volatile choppy markets
- Low liquidity small-cap coins
- Extreme market conditions (black swan events)
---
## 📊 Usage Recommendations
Timeframe Suggestions
| Timeframe | Trading Style | Suggested Parameter Adjustment |
|-----------|--------------|-------------------------------|
| 1-5 min | Scalping | Swing Length 100-160 |
| 15-30 min | Short-term | Swing Length 50-100 |
| 1-4 hour | Swing Trading | Swing Length 20-50 |
Optimization Tips
1. Adjust swing length based on backtest results
2. Different coins may require different parameters
3. Recommend backtesting on 1-minute chart first before live trading
4. Enable labels to observe entry/exit points
---
## ⚠️ Risk Disclaimer
1. Past Performance Does Not Guarantee Future Results
- Backtest data is for reference only
- Live trading may be affected by slippage, delays, etc.
2. Market Condition Changes
- Strategy performs better in trending markets
- May experience frequent stops in ranging markets
3. Capital Management
- Do not invest more than you can afford to lose
- Recommend setting total capital stop-loss threshold
4. Commission Impact
- Frequent trading accumulates commission fees
- Recommend using exchange discounts (BNB fee reduction, etc.)
---
## 🔧 Troubleshooting
Q: No entry signals?
A: Check if structure filter is too strict, adjust swing length or timeframe
Q: Too many labels displayed?
A: Turn off "Show Labels" option in settings
Q: Poor backtest performance?
A:
1. Check if the coin is suitable for trend-following strategies
2. Adjust parameters (swing length, channel period)
3. Try different timeframes
Q: How to set alerts?
A:
1. Click "Alert" in top-right corner of chart
2. Condition: Select "Strategy - Trend Following CRYPTOCAP:ZEC "
3. Choose "Order filled"
4. Set notification method (Webhook/Email/App)
---
## 📞 Contact Information
Strategy Name: Trend Following CRYPTOCAP:ZEC
Version: v1.0
Pine Script Version: v6
Last Updated: December 2025
---
## 📄 Copyright Notice
This strategy is for educational and research purposes only.
All risks of using this strategy for live trading are borne by the user.
Commercial use without authorization is prohibited.
---
## 🎓 Learning Resources
To understand the strategy principles in depth, recommended reading:
- "The Complete TurtleTrader" - Curtis Faith
- "Trend Following" - Michael Covel
- TradingView Pine Script Official Documentation
---
Happy Trading! Remember to manage your risk 📈

Strategia S&P 500 vs US10Y Yield (od 2000)This strategy explores the macroeconomic relationship between the equity market (S&P 500) and the debt market (10-Year Treasury Yield). Historically, rapid spikes in bond yields often exert downward pressure on equity valuations, leading to corrections or bear markets.
The goal of this strategy is capital preservation. It attempts to switch to cash when yields are rising too aggressively and re-enter the stock market when the bond market stabilizes.

Strategia S&P 500 vs US10Y YieldThis strategy explores the macroeconomic relationship between the equity market (S&P 500) and the debt market (10-Year Treasury Yield). Historically, rapid spikes in bond yields often exert downward pressure on equity valuations, leading to corrections or bear markets.
The goal of this strategy is capital preservation. It attempts to switch to cash when yields are rising too aggressively and re-enter the stock market when the bond market stabilizes.

Keltner Channels Strategy NewThe strategy is chenging the same as an original copy, but this one is for tests, so I will publish it and check results

2 Dip/Tepe + Destek/Direnç + Tek Sinyal Stratejisi⭐ A Brief Summary of What the Strategy Does
🎯 1) Market analysis is being released (bottom-top analysis)
It automatically finds pivot bottoms and pivot tops on the strategic chart. Then:
If the bottoms are rising (HL – High Low): the trend is upward
If the tops are falling (LH – Lower High): the trend is downward
it interprets this.
🎯 2) Support and resistance lines are formed
Last pivot top = resistance line
Last pivot bottom = support line
These lines are automatically drawn on the chart.
🎯 3) Breakout is expected according to the trend structure
For LONG:
The last two bottoms will be rising bottoms
The price will rise above the last resistance line
This gives a single LONG signal.
For SHORT:
The last two peaks will be falling peaks
The price will fall below the support line
This gives a single SHORT signal.
