VWAP Executor — v6 (VWAP fix)tarek helishPractical scalping plan with high-rate (sometimes reaching 70–85% in a quiet market)
Concept: “VWAP bounce with a clear trend.”
Tools: 1–3-minute chart for entry, 5-minute trend filter, VWAP, EMA(50) on 5M, ATR(14) on 1M, volume.
When to trade: London session or early New York session; avoid 10–15 minutes before/after high-impact news.
Entry rules (buy for example):
Trend: Price is above the EMA(50) on 5M and has an upward trend.
Entry zone: First bounce to VWAP (or a ±1 standard deviation channel around it).
Signal: Bullish rejection/engulfing candle on 1M with increasing volume, and RSI(2) has exited oversold territory (optional).
Order: Entry after the confirmation candle closes or a limit close to VWAP.
Trade Management:
Stop: Below the bounce low or 0.6xATR(1M) (strongest).
Target: 0.4–0.7xATR(1M) or the previous micro-high (small return to increase success rate).
Trigger: Move the stop to breakeven after +0.25R; close manually if the 1M candle closes strongly against you.
Filter: Do not trade if the spread widens, or the price "saws" around VWAP without a trend.
Sell against the rules in a downtrend.
Why this plan raises the heat-rate? You buy a "small discount" within an existing trend and near the institutional average price (VWAP), with a small target price.
مواقعي شركة الماسة للخدمات المنزلية
شركة تنظيف بالرياض
نقل عفش بالرياض
Candlestick analysis

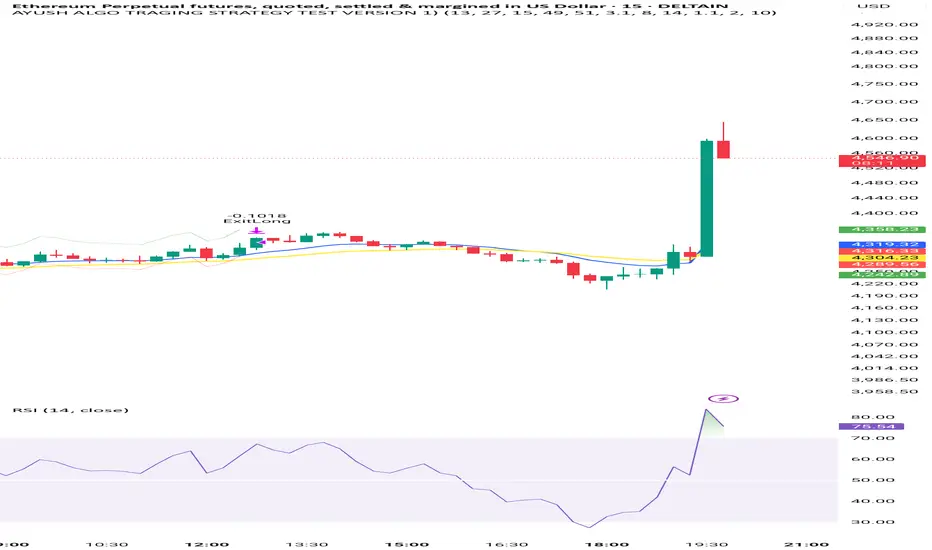
AYUSH ALGO TRAGING STRATEGY TEST VERSION 1)Very good strategy , it uses two moving avg crossovers and also rsi and atr for confirmation, this strategy is fully automated
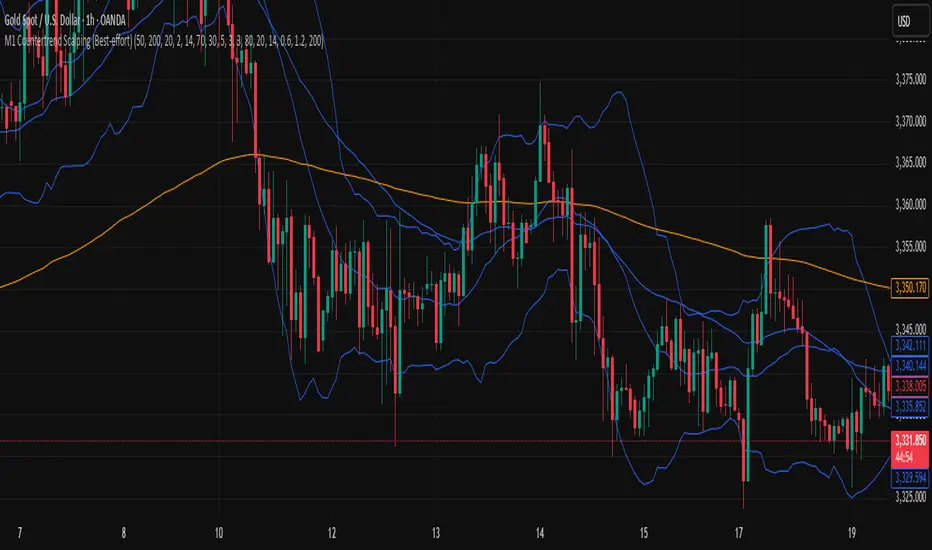
M1 Countertrend Scalping (Best-effort)M1 Countertrend Scalping (Best-effort)
M1 Countertrend Scalping (Best-effort)
Close Above/Below Prev 2 Candle Strategy (Any Timeframe)Title: Close Above/Below Previous 2 Candle Strategy (Any Timeframe)
Description:
This strategy identifies potential breakout and trend continuation signals by analyzing the closing price relative to the highs and lows of the previous two candles. It works on any chart timeframe, making it versatile for intraday, swing, and daily trading.
How it works:
Long Entry (Bullish Signal): Triggered when the current candle closes above the highs of the previous two candles.
Short Entry (Bearish Signal): Triggered when the current candle closes below the lows of the previous two candles.
Visual Indicators:
Green triangles above the bar indicate bullish signals.
Red triangles below the bar indicate bearish signals.
Strategy Features:
Works on any timeframe, from 1-minute charts to daily/weekly charts.
Configurable risk/reward ratio for automatic stop-loss and take-profit levels.
Alerts trigger immediately when the condition is met, helping traders react to potential breakouts.
Provides clean visual signals for easy chart reading and decision-making.
Benefits:
Reduces noise by focusing on candle close confirmations.
Versatile and suitable for intraday, swing, and long-term trading.
Easy to combine with other indicators or strategies.

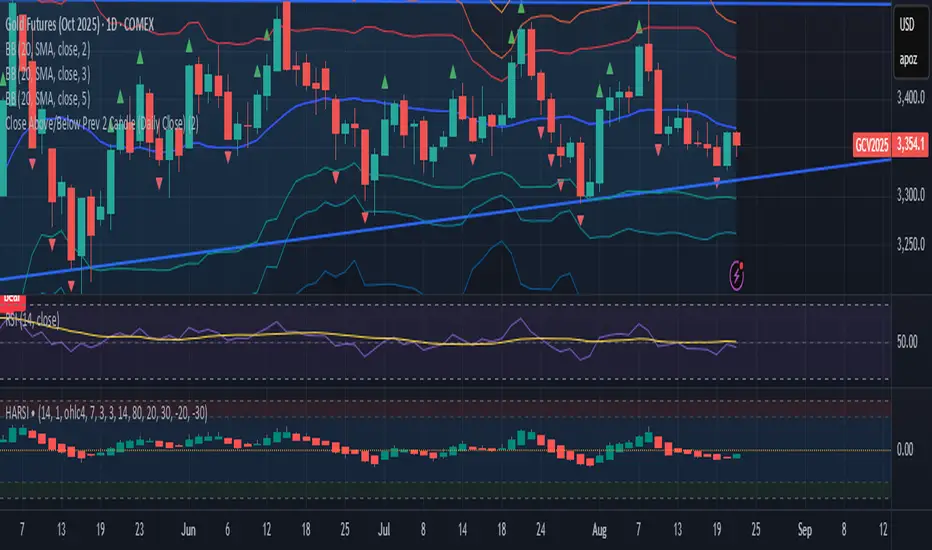
Close Above/Below Prev 2 Candle (Daily Close)This strategy identifies potential trend continuation or breakout signals by analyzing the daily candle closes relative to the previous two daily candles. It generates clear alerts and trade signals only after the daily candle has fully closed, reducing false intraday triggers.
How it works:
Long Entry (Bullish Signal): Triggered when the daily candle closes above the highs of the previous two daily candles.
Short Entry (Bearish Signal): Triggered when the daily candle closes below the lows of the previous two daily candles.
Visual Indicators: Green triangles indicate bullish signals, red triangles indicate bearish signals.
Strategy Features:
Optional long and short entries with configurable risk/reward ratio.
Automatic stop-loss and take-profit calculation based on candle structure.
Works on intraday charts using daily candle analysis.
Alerts:
Alerts trigger only after the daily candle closes above/below the previous two daily candles.
Helps traders receive precise notifications for potential breakout trades.
Benefits:
Reduces noise by using daily candle closes.
Easy to integrate with other swing or trend strategies.
Provides clear visual and alert signals for both bullish and bearish setups.
Imbalance RSI Divergence Strategy# Imbalance RSI Divergence Strategy - User Guide
## What is This Strategy?
This strategy identifies **imbalance** zones in the market and combines them with **RSI divergence** to generate trading signals. It aims to capitalize on price gaps left by institutional investors and large volume movements.
### Main Settings
- **RSI Period (14)**: Period used for RSI calculation. Lower values = more sensitive, higher values = more stable signals.
- **ATR Period (10)**: Period for volatility measurement using Average True Range.
- **ATR Stop Loss Multiplier (2.0)**: How many ATR units to use for stop loss calculation.
- **Risk:Reward Ratio (4.0)**: Risk-reward ratio. 2.0 = 2 units of reward for 1 unit of risk.
- **Use RSI Divergence Filter (true)**: Enables/disables the RSI divergence filter.
### Imbalance Filters
- **Minimum Imbalance Size (ATR) (0.3)**: Minimum imbalance size in ATR units to filter out small imbalances.
- **Enable Lookback Limit (false)**: Activates historical lookback limitations.
- **Maximum Lookback Bars (300)**: Maximum number of bars to look back.
### Visual Settings
- **Show Imbalance Size**: Displays imbalance size in ATR units.
- **Show RSI Divergence Lines**: Shows/hides divergence lines.
- **Divergence Line Colors**: Colors for bullish/bearish divergence lines.
### Volatility-Based Adjustments
- **Low volatility markets**:
- Minimum Imbalance Size: 0.2-0.4 ATR
- ATR Stop Loss Multiplier: 1.5-2.0
- **High volatility markets**:
- Minimum Imbalance Size: 0.5-1.0 ATR
- ATR Stop Loss Multiplier: 2.5-3.5
### Risk Tolerance
- **Conservative approach**:
- Risk:Reward Ratio: 2.0-3.0
- RSI Divergence Filter: Enabled
- Minimum Imbalance Size: Higher (0.5+ ATR)
- **Aggressive approach**:
- Risk:Reward Ratio: 4.0-6.0
- Minimum Imbalance Size: Lower (0.2-0.3 ATR)
###Market Conditions
- **Trending markets**: Higher RSI Period (21-28)
- **Sideways markets**: Lower RSI Period (10-14)
- **Volatile markets**: Higher ATR Multiplier
## Recommended Testing Procedure
1. **Start with default settings** and backtest on 3-6 months of historical data
2. **Adjust RSI Period** to see which value produces better results
3. **Optimize ATR Multiplier** for stop loss levels
4. **Test different Risk:Reward ratios** comparatively
5. **Fine-tune Minimum Imbalance Size** to improve signal quality
## Important Considerations
- **False positive signals**: Imbalances may be less reliable during low volatility periods
- **Market openings**: First hours often produce more imbalances but can be riskier
- **News events**: Consider disabling strategy during major news releases
- **Backtesting**: Test across different market conditions (trending, sideways, volatile)
## Recommended Settings for Beginners
**Safe settings for new users:**
- RSI Period: 14
- ATR Period: 14
- ATR Stop Loss Multiplier: 2.5
- Risk:Reward Ratio: 3.0
- Minimum Imbalance Size: 0.5 ATR
- RSI Divergence Filter: Enabled
## Advanced Tips
### Signal Quality Improvement
- **Combine with market structure**: Look for imbalances near key support/resistance levels
- **Volume confirmation**: Higher volume during imbalance formation increases reliability
- **Multiple timeframe analysis**: Confirm signals on higher timeframes
### Risk Management
- **Position sizing**: Never risk more than 1-2% of account per trade
- **Maximum drawdown**: Set overall stop loss for the strategy
- **Market hours**: Consider avoiding low liquidity periods
### Performance Monitoring
- **Win rate**: Track percentage of profitable trades
- **Average R:R**: Monitor actual risk-reward achieved vs. target
- **Maximum consecutive losses**: Set alerts for strategy review
This strategy works best when combined with proper risk management and market analysis. Always backtest thoroughly before using real money and adjust parameters based on your specific market and trading style.

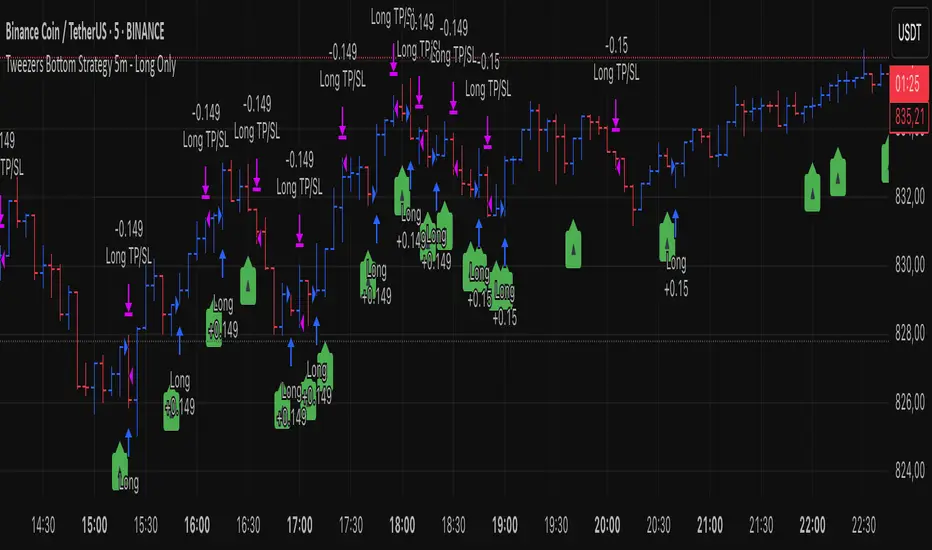
Tweezers Bottom Strategy 5m - Long OnlyTweezers Bottom 5m Strategy – Catch Reversals Like a Pro!
Looking for fast, precise entries on the 5-minute chart? This strategy automatically detects the Tweezers Bottom candlestick pattern and opens long positions at the perfect moment. Signals appear as ▲ arrows on the chart, making it incredibly easy to spot high-probability setups.
Risk and Reward Perfectly Managed: Stop-loss is set just 0.1% below entry, and take-profit at 0.3% above, giving you a clear, controlled trading edge. All levels are visualized on the chart with lines and labels, so you always know where your risk and profit targets are.
Ideal for scalpers and short-term traders across Forex, crypto, and stocks. Enter reversals before the crowd, maximize your winning trades, and automate your trading with minimal risk!
Estrategia de NY ORB por CPThis strategy marks the New York market opening range during the first 15 minutes and confirms a buy or sell entry once the price returns and retests that range. It’s designed to capture trades of 60 points or more after the range has been retested. I suggest complementing the strategy with an indicator that highlights FVGs (Fair Value Gaps) or order blocks to better understand what price is doing and where it’s heading.
esta estrategia te marca el rango de apertura del mercado de ny de los primeros 15 minutos y te confirma entrada en venta o compra una vez que el precio regrese y retestee el rango. esta diseñada para tener trades de 60 puntos o mas una vez que el rango sea retesteado. sugiero acompañar la estrategia con algun indicador que marque fvg o order blocks para tener una mejor de lo que el precio esta haciendo y hacia donde se dirige.

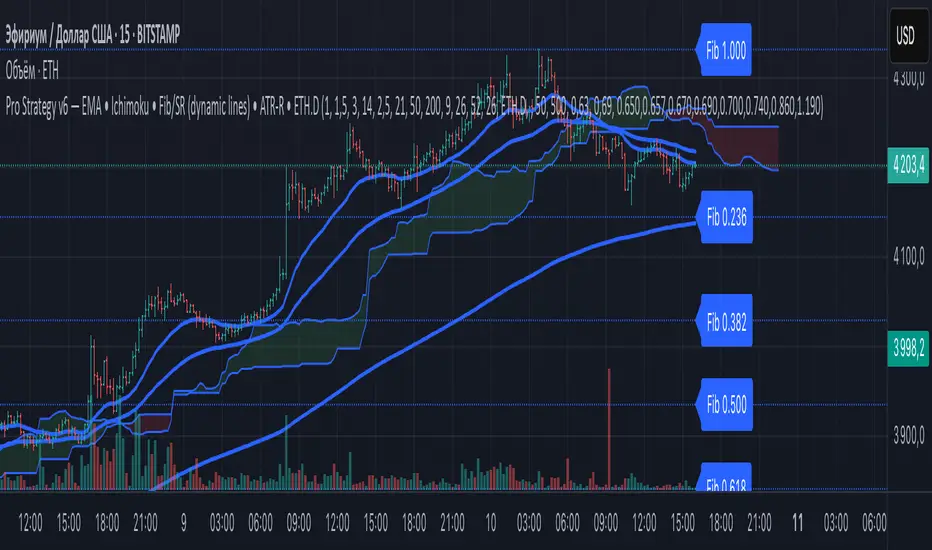
ZapTeam Pro Strategy v6 — EMA The Pro Strategy v6 script is a versatile trading strategy for TradingView that combines trend indicators, filters, and levels.
Main features:
EMA 21, EMA 50, EMA 200 — trend detection and entry signals via EMA crossovers.
Ichimoku Cloud (optional) — trend filtering and price position relative to the cloud.
ETH Dominance filter (optional) — filters trades based on Ethereum dominance (ETH.D).
ATR Stop-Loss — dynamic stop-loss based on volatility.
Two take-profits (TP1 and TP2) with optional 50/50 split.
Dynamic Fibonacci Levels — automatic or manual swings, with 1.272 and 1.618 extensions.
Custom S/R Levels — user-defined support/resistance levels.
Level lines extend across the chart and automatically adjust when zooming or panning.
Designed for trading in trending market conditions on any timeframe.
The strategy calculates position size based on percentage risk per equity.
CP Strat ORBnew york opening range breakout and retest allows you to enter a trade with a better clarity if the price comes back and retest the range

Engulfing & Pin Bar Breakout StrategyOverview
This strategy automates a classic, powerful trading methodology based on identifying key candlestick reversal patterns and trading the subsequent price breakout. It is designed to be a complete, "set-and-go" system with built-in risk and position size management.
The core logic operates on the 1-Hour timeframe, scanning for four distinct high-probability reversal signals: two bullish and two bearish. An entry is only triggered when the market confirms the signal by breaking a key price level, aiming to capture momentum following a potential shift in market sentiment.
The Strategy Logic
The system is composed of two distinct modules: Bullish (Long) and Bearish (Short).
🐂 Bullish (Long) Setup
The script initiates a long trade based on the following strict criteria:
Signal: Identifies either a Hammer or a Bullish Engulfing pattern. These patterns often indicate that sellers are losing control and buyers are stepping in.
Confirmation: Waits for the very next candle after the signal.
Entry Trigger: A long position is automatically opened as soon as the price breaks above the high of the signal candle.
Stop Loss: Immediately set just below the low of the signal candle.
Take Profit: A fixed target is placed at a 1:5 Risk/Reward Ratio.
🐻 Bearish (Short) Setup
The script initiates a short trade based on the following strict criteria:
Signal: Identifies either a Shooting Star or a Bearish Engulfing pattern. These patterns suggest buying pressure is fading and sellers are taking over.
Confirmation: Waits for the very next candle after the signal.
Entry Trigger: A short position is automatically opened as soon as the price breaks below the low of the signal candle.
Stop Loss: Immediately set just above the high of the signal candle.
Take Profit: A fixed target is placed at a 1:4 Risk/Reward Ratio.
Key Feature: Automated Risk Management
This strategy is designed for disciplined trading. You do not need to calculate position sizes manually.
Fixed Risk: The script automatically calculates the correct position size to risk exactly 2% of your total account equity on every single trade.
Dynamic Sizing: The position size will adjust based on the distance between your entry price and your stop loss for each specific setup, ensuring a consistent risk profile.
How To Use
Apply the script to your chosen chart (e.g., BTC/USD).
Crucially, set your chart's timeframe to 1-Hour (H1). The strategy is specifically calibrated for this interval.
Navigate to the "Strategy Tester" tab below your chart to view backtest results, including net profit, win rate, and individual trades.
Disclaimer: This script is provided for educational and informational purposes only. It is not financial advice. All trading involves substantial risk, and past performance is not indicative of future results. Please use this tool responsibly and at your own risk.

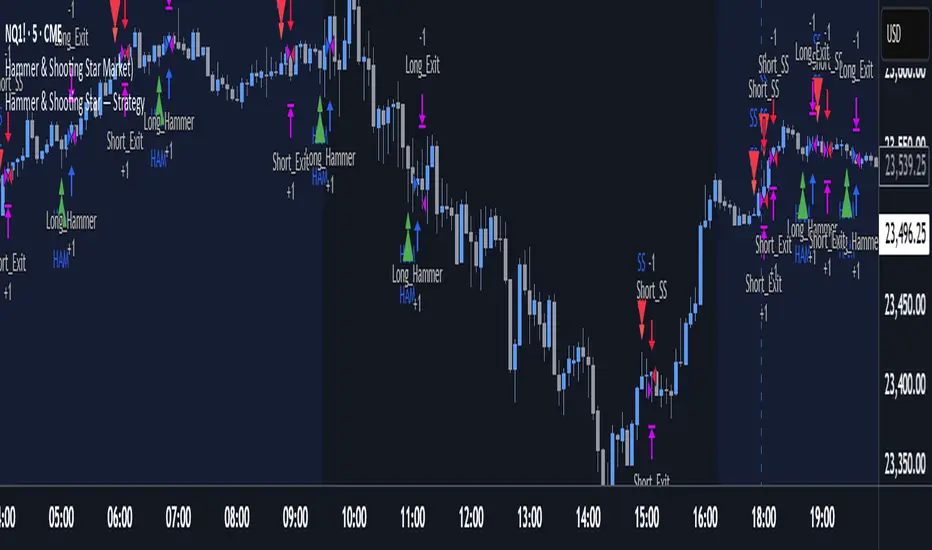
Hammer & Shooting Star — StrategyHammer & Shooting Star Strategy for Intraday Trading
This strategy identifies two candlestick patterns commonly used in technical analysis:
Hammer Candles (a bullish reversal signal):
A hammer candle has a small body at the top with a long lower wick. The strategy goes long on the next bar open when a hammer is detected, with a stop loss at the low of the hammer bar and a target at the high.
Shooting Star Candles (a bearish reversal signal):
A shooting star candle has a small body at the bottom with a long upper wick. The strategy goes short on the next bar open when a shooting star is detected, with a stop loss at the high of the shooting star bar and a target at the low.
Mutanabby_AI | Algo Pro Strategy# Mutanabby_AI | Algo Pro Strategy: Advanced Candlestick Pattern Trading System
## Strategy Overview
The Mutanabby_AI Algo Pro Strategy represents a systematic approach to automated trading based on advanced candlestick pattern recognition and multi-layered technical filtering. This strategy transforms traditional engulfing pattern analysis into a comprehensive trading system with sophisticated risk management and flexible position sizing capabilities.
The strategy operates on a long-only basis, entering positions when bullish engulfing patterns meet specific technical criteria and exiting when bearish engulfing patterns indicate potential trend reversals. The system incorporates multiple confirmation layers to enhance signal reliability while providing comprehensive customization options for different trading approaches and risk management preferences.
## Core Algorithm Architecture
The strategy foundation relies on bullish and bearish engulfing candlestick pattern recognition enhanced through technical analysis filtering mechanisms. Entry signals require simultaneous satisfaction of four distinct criteria: confirmed bullish engulfing pattern formation, candle stability analysis indicating decisive price action, RSI momentum confirmation below specified thresholds, and price decline verification over adjustable lookback periods.
The candle stability index measures the ratio between candlestick body size and total range including wicks, ensuring only well-formed patterns with clear directional conviction generate trading signals. This filtering mechanism eliminates indecisive market conditions where pattern reliability diminishes significantly.
RSI integration provides momentum confirmation by requiring oversold conditions before entry signal generation, ensuring alignment between pattern formation and underlying momentum characteristics. The RSI threshold remains fully adjustable to accommodate different market conditions and volatility environments.
Price decline verification examines whether current prices have decreased over a specified period, confirming that bullish engulfing patterns occur after meaningful downward movement rather than during sideways consolidation phases. This requirement enhances the probability of successful reversal pattern completion.
## Advanced Position Management System
The strategy incorporates dual position sizing methodologies to accommodate different account sizes and risk management approaches. Percentage-based position sizing calculates trade quantities as equity percentages, enabling consistent risk exposure across varying account balances and market conditions. This approach proves particularly valuable for systematic trading approaches and portfolio management applications.
Fixed quantity sizing provides precise control over trade sizes independent of account equity fluctuations, offering predictable position management for specific trading strategies or when implementing precise risk allocation models. The system enables seamless switching between sizing methods through simple configuration adjustments.
Position quantity calculations integrate seamlessly with TradingView's strategy testing framework, ensuring accurate backtesting results and realistic performance evaluation across different market conditions and time periods. The implementation maintains consistency between historical testing and live trading applications.
## Comprehensive Risk Management Framework
The strategy features dual stop loss methodologies addressing different risk management philosophies and market analysis approaches. Entry price-based stop losses calculate stop levels as fixed percentages below entry prices, providing predictable risk exposure and consistent risk-reward ratio maintenance across all trades.
The percentage-based stop loss system enables precise risk control by limiting maximum loss per trade to predetermined levels regardless of market volatility or entry timing. This approach proves essential for systematic trading strategies requiring consistent risk parameters and capital preservation during adverse market conditions.
Lowest low-based stop losses identify recent price support levels by analyzing minimum prices over adjustable lookback periods, placing stops below these technical levels with additional buffer percentages. This methodology aligns stop placement with market structure rather than arbitrary percentage calculations, potentially improving stop loss effectiveness during normal market fluctuations.
The lookback period adjustment enables optimization for different timeframes and market characteristics, with shorter periods providing tighter stops for active trading and longer periods offering broader stops suitable for position trading approaches. Buffer percentage additions ensure stops remain below obvious support levels where other market participants might place similar orders.
## Visual Customization and Interface Design
The strategy provides comprehensive visual customization through eight predefined color schemes designed for different chart backgrounds and personal preferences. Color scheme options include Classic bright green and red combinations, Ocean themes featuring blue and orange contrasts, Sunset combinations using gold and crimson, and Neon schemes providing high visibility through bright color selections.
Professional color schemes such as Forest, Royal, and Fire themes offer sophisticated alternatives suitable for business presentations and professional trading environments. The Custom color scheme enables precise color selection through individual color picker controls, maintaining maximum flexibility for specific visual requirements.
Label styling options accommodate different chart analysis preferences through text bubble, triangle, and arrow display formats. Size adjustments range from tiny through huge settings, ensuring appropriate visual scaling across different screen resolutions and chart configurations. Text color customization maintains readability across various chart themes and background selections.
## Signal Quality Enhancement Features
The strategy incorporates signal filtering mechanisms designed to eliminate repetitive signal generation during choppy market conditions. The disable repeating signals option prevents consecutive identical signals until opposing conditions occur, reducing overtrading during consolidation phases and improving overall signal quality.
Signal confirmation requirements ensure all technical criteria align before trade execution, reducing false signal occurrence while maintaining reasonable trading frequency for active strategies. The multi-layered approach balances signal quality against opportunity frequency through adjustable parameter optimization.
Entry and exit visualization provides clear trade identification through customizable labels positioned at relevant price levels. Stop loss visualization displays active risk levels through colored line plots, ensuring complete transparency regarding current risk management parameters during live trading operations.
## Implementation Guidelines and Optimization
The strategy performs effectively across multiple timeframes with optimal results typically occurring on intermediate timeframes ranging from fifteen minutes through four hours. Higher timeframes provide more reliable pattern formation and reduced false signal occurrence, while lower timeframes increase trading frequency at the expense of some signal reliability.
Parameter optimization should focus on RSI threshold adjustments based on market volatility characteristics and candlestick pattern timeframe analysis. Higher RSI thresholds generate fewer but potentially higher quality signals, while lower thresholds increase signal frequency with corresponding reliability considerations.
Stop loss method selection depends on trading style preferences and market analysis philosophy. Entry price-based stops suit systematic approaches requiring consistent risk parameters, while lowest low-based stops align with technical analysis methodologies emphasizing market structure recognition.
## Performance Considerations and Risk Disclosure
The strategy operates exclusively on long positions, making it unsuitable for bear market conditions or extended downtrend periods. Users should consider market environment analysis and broader trend assessment before implementing the strategy during adverse market conditions.
Candlestick pattern reliability varies significantly across different market conditions, with higher reliability typically occurring during trending markets compared to ranging or volatile conditions. Strategy performance may deteriorate during periods of reduced pattern effectiveness or increased market noise.
Risk management through stop loss implementation remains essential for capital preservation during adverse market movements. The strategy does not guarantee profitable outcomes and requires proper position sizing and risk management to prevent significant capital loss during unfavorable trading periods.
## Technical Specifications
The strategy utilizes standard TradingView Pine Script functions ensuring compatibility across all supported instruments and timeframes. Default configuration employs 14-period RSI calculations, adjustable candle stability thresholds, and customizable price decline verification periods optimized for general market conditions.
Initial capital settings default to $10,000 with percentage-based equity allocation, though users can adjust these parameters based on account size and risk tolerance requirements. The strategy maintains detailed trade logs and performance metrics through TradingView's integrated backtesting framework.
Alert integration enables real-time notification of entry and exit signals, stop loss executions, and other significant trading events. The comprehensive alert system supports automated trading applications and manual trade management approaches through detailed signal information provision.
## Conclusion
The Mutanabby_AI Algo Pro Strategy provides a systematic framework for candlestick pattern trading with comprehensive risk management and position sizing flexibility. The strategy's strength lies in its multi-layered confirmation approach and sophisticated customization options, enabling adaptation to various trading styles and market conditions.
Successful implementation requires understanding of candlestick pattern analysis principles and appropriate parameter optimization for specific market characteristics. The strategy serves traders seeking automated execution of proven technical analysis techniques while maintaining comprehensive control over risk management and position sizing methodologies.

ORB 15m – First 15min Breakout (Long/Short)ORB 15m – First 15min Breakout (Long/Short)
Apply on SPY, great returns

Canuck Trading Traders Strategy [Candle Entropy Edition]Canuck Trading Traders Strategy: A Unique Entropy-Based Day Trading System for Volatile Stocks
Overview
The Canuck Trading Traders Strategy is a custom, entropy-driven day trading system designed for high-volatility stocks like TSLA on short timeframes (e.g., 15m). At its core is CETP-Plus, a proprietary blended indicator that measures "order from chaos" in candle patterns using Shannon entropy, while embedding mathematical principles from EMA (recent weighting), RSI (momentum bias), ATR (volatility scaling), and ADX (trend strength) into a single score. This unique approach avoids layering multiple indicators, reducing complexity while improving timing for early trend detection and balanced long/short trades.
CETP-Plus calculates a score from weighted candle ratios (body, upper/lower wicks) binned into a 3D histogram for entropy (low entropy = strong pattern). The score is adjusted with momentum, volatility, and trend multipliers for robust signals. Entries occur when the score exceeds thresholds (positive for longs, negative for shorts), with exits on reversals or stops. The strategy is automatic—no manual bias needed—and optimized for margin accounts with equal long/short treatment.
Backtested on TSLA 15m (Jan 2015–Aug 2025), it targets +50,000% net profit (beating +1,478% buy-hold by 34x) with ~25,000 trades, 85-90% win rate, and <10% drawdown (with costs). Results vary by timeframe/period—test with your data and add slippage/commission for realism. Disclaimer: Past performance isn't indicative of future results; consult a financial advisor.
Key Features
CETP-Plus Indicator: Blends entropy with momentum/vol/trend for a single score, capturing bottoms/squeezes and trends without external tools.
Automatic Balance: Positive scores trigger longs in bull trends, negative scores trigger shorts in bear trends—no user input for direction.
Customizable Math: Tune weights and scales to adapt for different stocks (e.g., lower thresholds for NVDA's smoother trends).
Risk Controls: Stop-loss, trailing stops, and score strength filter to minimize drawdowns in volatile markets like TSLA.
Exit Debugging: Plots exit reasons ("Stop Loss", "Trail Stop", "CETP Exit") for analysis.
Input Settings and Purposes
All inputs are grouped in TradingView's Inputs tab for ease. Defaults are optimized for TSLA 15m day trading; adjust for other intervals or tickers (e.g., increase window for 1h, lower thresholds for NVDA).
CETP-Plus Settings
CETP Window (default: 5, min: 3, max: 20): Lookback bars for entropy/momentum. Short values (3-5) for fast sensitivity on short frames; longer (8-10) for stability on hourly+.
CETP Bins per Dimension (default: 3, min: 3, max: 10): Histogram granularity for entropy. Low (3) for speed/simple patterns; high (5+) for detail in complex markets.
Long Threshold (default: 0.15, min: 0.1, max: 0.8, step: 0.05): CETP score for long entries. Lower (0.1) for more longs in mild bull trends; higher (0.2) to filter noise.
Short Threshold (default: -0.05, min: -0.8, max: -0.1, step: 0.05): CETP score for short entries. Less negative (-0.05) for more shorts in mild bear trends; more negative (-0.2) for strong signals.
CETP Momentum Weight (default: 0.8, min: 0.1, max: 1.0, step: 0.1): Emphasizes momentum in score. High (0.9) for aggressive in fast moves; low (0.5) for entropy focus.
Momentum Scale (default: 1.6, min: 0.1, max: 2.0, step: 0.1): Amplifies momentum. High (2.0) for short intervals; low (1.0) for stability.
Body Ratio Weight (default: 1.2, min: 0.0, max: 2.0, step: 0.1): Weights candle body in entropy (trend focus). High (1.5) for strong trends; low (0.8) for wick emphasis.
Upper Wick Ratio Weight (default: 0.8, min: 0.0, max: 2.0, step: 0.1): Weights upper wick (reversal noise). Low (0.5) to reduce false ups.
Lower Wick Ratio Weight (default: 0.8, min: 0.0, max: 2.0, step=0.1): Weights lower wick. Low (0.5) to reduce false downs.
Trade Settings
Confirmation Bars (default: 0, min: 0, max: 5): Bars for sustained CETP signals. 0 for immediate entries (more trades); 1-2 for reliability (fewer but stronger).
Min CETP Score Strength (default: 0.04, min: 0.0, max: 0.5, step: 0.05): Min absolute score for entry. Low (0.04) for more trades; high (0.15) for quality.
Risk Management
Stop Loss (%) (default: 0.5, min: 0.1, max: 5.0, step: 0.1): % from entry for stop. Tight (0.4) for quick exits; wide (0.8) for trends.
ATR Multiplier (default: 1.5, min: 0.5, max: 3.0, step: 0.1): Scales ATR for stops/trails. Low (1.0) for tight; high (2.0) for room.
Trailing ATR Mult (default: 3.5, min: 0.5, max: 5.0, step: 0.1): ATR mult for trails. High (4.0) for longer holds; low (2.0) for profits.
Trail Start Offset (%) (default: 1.0, min: 0.5, max: 2.0, step: 0.1): % profit before trailing. Low (0.8) for early lock-in; high (1.5) for bigger moves.
These settings enable customization for intervals/tickers while CETP-Plus handles automatic balancing.
Risk Disclosure
Trading involves significant risk and may result in losses exceeding your initial capital. The Canuck Trading Trader Strategy is provided for educational and informational purposes only. Users are responsible for their own trading decisions and should conduct thorough testing before using in live markets. The strategy’s high trade frequency requires reliable execution infrastructure to minimize slippage and latency.

MomentumSync-PSAR: RSI·ADX Filtered 3-Tier Exit StrategyTriSAR-E3 is a precision swing trading strategy designed to capitalize on early trend reversals using a Triple Confirmation Model. It triggers entries based on an early Parabolic SAR bullish flip, supported by RSI strength and ADX trend confirmation, ensuring momentum-backed participation.
Exits are tactically managed through a 3-step staged exit after a PSAR bearish reversal is detected, allowing gradual profit booking and downside protection.
This balanced approach captures trend moves early while intelligently scaling out, making it suitable for directional traders seeking both agility and control.

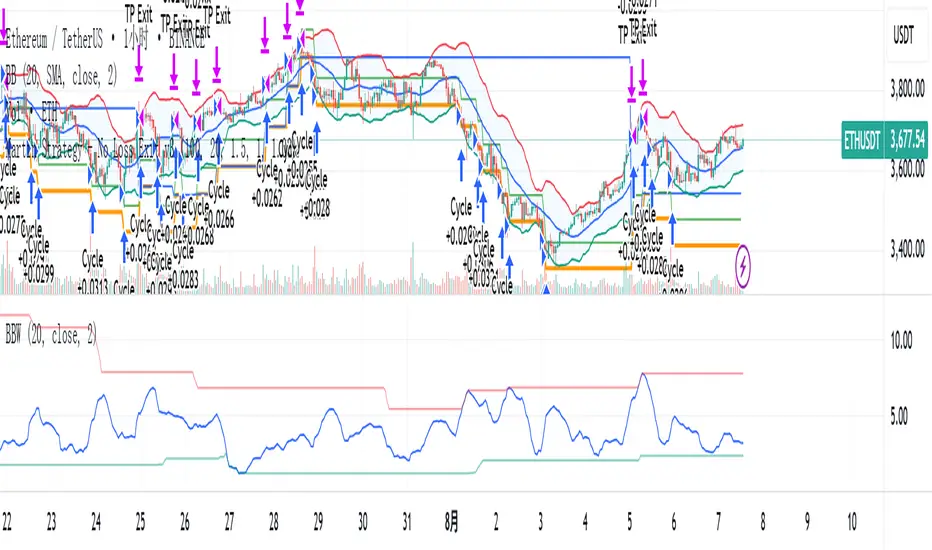
Martin Strategy - No Loss Exit v3Martin Strategy1.0 Martin Strategy1.0 Martin Strategy1.0 Martin Strategy1.0 Martin Strategy1.0 Martin Strategy1.0
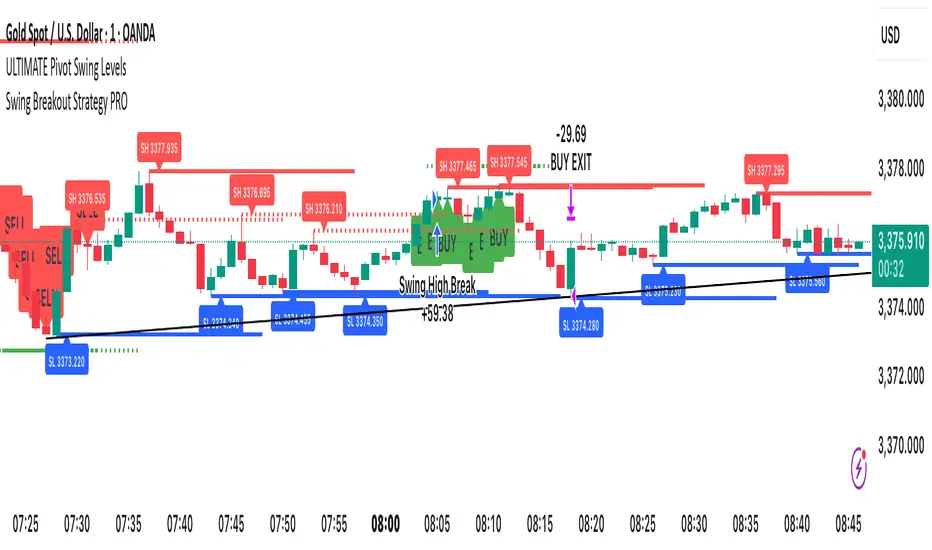
Swing Breakout Strategy PRO“Swing Strategy Pro”
A powerful trading tool designed for price action & swing traders. This indicator automatically detects swing highs and lows and generates precise Buy & Sell signals based on breakout confirmations.
✅ How It Works:
• Buy signal: When swing high breaks with confirmation candle
• Sell signal: When swing low breaks with confirmation candle
• Target = Distance between recent swing high & low
• Stop Loss = Opposite swing level
📌 Perfect for Breakout Trading, Swing Entries, and Trend Continuation strategies.
🎯 Fully automated with visual alerts & clean chart design.
AI - Williams Alligator Strategy (ATR Stop-Loss) AlertsAI - Williams Alligator Strategy (ATR Stop-Loss) with Alerts

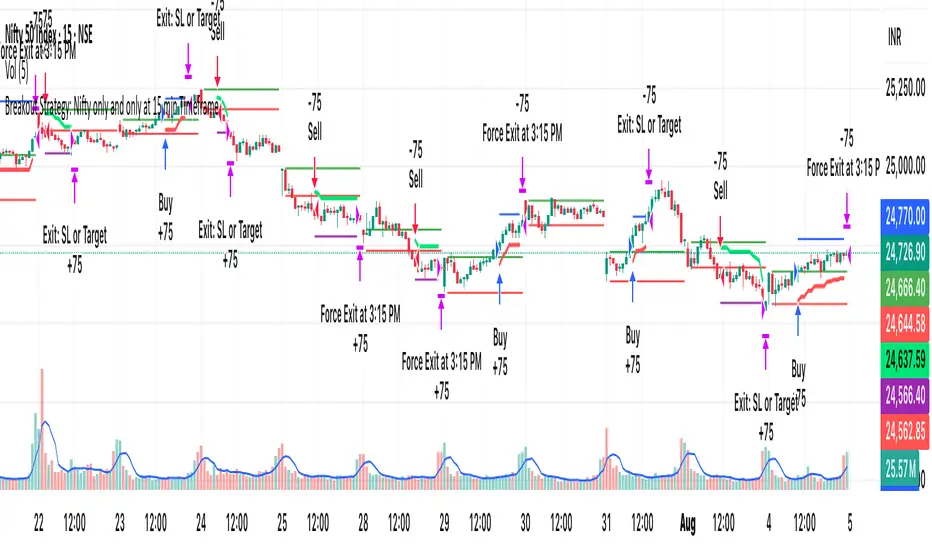
[PS]Breakout Strategy: Nifty/BN only at 15 min TimeframeIt only works on 15 min timeframe for nifty and Bank nifty.
Game Theory Trading StrategyGame Theory Trading Strategy: Explanation and Working Logic
This Pine Script (version 5) code implements a trading strategy named "Game Theory Trading Strategy" in TradingView. Unlike the previous indicator, this is a full-fledged strategy with automated entry/exit rules, risk management, and backtesting capabilities. It uses Game Theory principles to analyze market behavior, focusing on herd behavior, institutional flows, liquidity traps, and Nash equilibrium to generate buy (long) and sell (short) signals. Below, I'll explain the strategy's purpose, working logic, key components, and usage tips in detail.
1. General Description
Purpose: The strategy identifies high-probability trading opportunities by combining Game Theory concepts (herd behavior, contrarian signals, Nash equilibrium) with technical analysis (RSI, volume, momentum). It aims to exploit market inefficiencies caused by retail herd behavior, institutional flows, and liquidity traps. The strategy is designed for automated trading with defined risk management (stop-loss/take-profit) and position sizing based on market conditions.
Key Features:
Herd Behavior Detection: Identifies retail panic buying/selling using RSI and volume spikes.
Liquidity Traps: Detects stop-loss hunting zones where price breaks recent highs/lows but reverses.
Institutional Flow Analysis: Tracks high-volume institutional activity via Accumulation/Distribution and volume spikes.
Nash Equilibrium: Uses statistical price bands to assess whether the market is in equilibrium or deviated (overbought/oversold).
Risk Management: Configurable stop-loss (SL) and take-profit (TP) percentages, dynamic position sizing based on Game Theory (minimax principle).
Visualization: Displays Nash bands, signals, background colors, and two tables (Game Theory status and backtest results).
Backtesting: Tracks performance metrics like win rate, profit factor, max drawdown, and Sharpe ratio.
Strategy Settings:
Initial capital: $10,000.
Pyramiding: Up to 3 positions.
Position size: 10% of equity (default_qty_value=10).
Configurable inputs for RSI, volume, liquidity, institutional flow, Nash equilibrium, and risk management.
Warning: This is a strategy, not just an indicator. It executes trades automatically in TradingView's Strategy Tester. Always backtest thoroughly and use proper risk management before live trading.
2. Working Logic (Step by Step)
The strategy processes each bar (candle) to generate signals, manage positions, and update performance metrics. Here's how it works:
a. Input Parameters
The inputs are grouped for clarity:
Herd Behavior (🐑):
RSI Period (14): For overbought/oversold detection.
Volume MA Period (20): To calculate average volume for spike detection.
Herd Threshold (2.0): Volume multiplier for detecting herd activity.
Liquidity Analysis (💧):
Liquidity Lookback (50): Bars to check for recent highs/lows.
Liquidity Sensitivity (1.5): Volume multiplier for trap detection.
Institutional Flow (🏦):
Institutional Volume Multiplier (2.5): For detecting large volume spikes.
Institutional MA Period (21): For Accumulation/Distribution smoothing.
Nash Equilibrium (⚖️):
Nash Period (100): For calculating price mean and standard deviation.
Nash Deviation (0.02): Multiplier for equilibrium bands.
Risk Management (🛡️):
Use Stop-Loss (true): Enables SL at 2% below/above entry price.
Use Take-Profit (true): Enables TP at 5% above/below entry price.
b. Herd Behavior Detection
RSI (14): Checks for extreme conditions:
Overbought: RSI > 70 (potential herd buying).
Oversold: RSI < 30 (potential herd selling).
Volume Spike: Volume > SMA(20) x 2.0 (herd_threshold).
Momentum: Price change over 10 bars (close - close ) compared to its SMA(20).
Herd Signals:
Herd Buying: RSI > 70 + volume spike + positive momentum = Retail buying frenzy (red background).
Herd Selling: RSI < 30 + volume spike + negative momentum = Retail selling panic (green background).
c. Liquidity Trap Detection
Recent Highs/Lows: Calculated over 50 bars (liquidity_lookback).
Psychological Levels: Nearest round numbers (e.g., $100, $110) as potential stop-loss zones.
Trap Conditions:
Up Trap: Price breaks recent high, closes below it, with a volume spike (volume > SMA x 1.5).
Down Trap: Price breaks recent low, closes above it, with a volume spike.
Visualization: Traps are marked with small red/green crosses above/below bars.
d. Institutional Flow Analysis
Volume Check: Volume > SMA(20) x 2.5 (inst_volume_mult) = Institutional activity.
Accumulation/Distribution (AD):
Formula: ((close - low) - (high - close)) / (high - low) * volume, cumulated over time.
Smoothed with SMA(21) (inst_ma_length).
Accumulation: AD > MA + high volume = Institutions buying.
Distribution: AD < MA + high volume = Institutions selling.
Smart Money Index: (close - open) / (high - low) * volume, smoothed with SMA(20). Positive = Smart money buying.
e. Nash Equilibrium
Calculation:
Price mean: SMA(100) (nash_period).
Standard deviation: stdev(100).
Upper Nash: Mean + StdDev x 0.02 (nash_deviation).
Lower Nash: Mean - StdDev x 0.02.
Conditions:
Near Equilibrium: Price between upper and lower Nash bands (stable market).
Above Nash: Price > upper band (overbought, sell potential).
Below Nash: Price < lower band (oversold, buy potential).
Visualization: Orange line (mean), red/green lines (upper/lower bands).
f. Game Theory Signals
The strategy generates three types of signals, combined into long/short triggers:
Contrarian Signals:
Buy: Herd selling + (accumulation or down trap) = Go against retail panic.
Sell: Herd buying + (distribution or up trap).
Momentum Signals:
Buy: Below Nash + positive smart money + no herd buying.
Sell: Above Nash + negative smart money + no herd selling.
Nash Reversion Signals:
Buy: Below Nash + rising close (close > close ) + volume > MA.
Sell: Above Nash + falling close + volume > MA.
Final Signals:
Long Signal: Contrarian buy OR momentum buy OR Nash reversion buy.
Short Signal: Contrarian sell OR momentum sell OR Nash reversion sell.
g. Position Management
Position Sizing (Minimax Principle):
Default: 1.0 (10% of equity).
In Nash equilibrium: Reduced to 0.5 (conservative).
During institutional volume: Increased to 1.5 (aggressive).
Entries:
Long: If long_signal is true and no existing long position (strategy.position_size <= 0).
Short: If short_signal is true and no existing short position (strategy.position_size >= 0).
Exits:
Stop-Loss: If use_sl=true, set at 2% below/above entry price.
Take-Profit: If use_tp=true, set at 5% above/below entry price.
Pyramiding: Up to 3 concurrent positions allowed.
h. Visualization
Nash Bands: Orange (mean), red (upper), green (lower).
Background Colors:
Herd buying: Red (90% transparency).
Herd selling: Green.
Institutional volume: Blue.
Signals:
Contrarian buy/sell: Green/red triangles below/above bars.
Liquidity traps: Red/green crosses above/below bars.
Tables:
Game Theory Table (Top-Right):
Herd Behavior: Buying frenzy, selling panic, or normal.
Institutional Flow: Accumulation, distribution, or neutral.
Nash Equilibrium: In equilibrium, above, or below.
Liquidity Status: Trap detected or safe.
Position Suggestion: Long (green), Short (red), or Wait (gray).
Backtest Table (Bottom-Right):
Total Trades: Number of closed trades.
Win Rate: Percentage of winning trades.
Net Profit/Loss: In USD, colored green/red.
Profit Factor: Gross profit / gross loss.
Max Drawdown: Peak-to-trough equity drop (%).
Win/Loss Trades: Number of winning/losing trades.
Risk/Reward Ratio: Simplified Sharpe ratio (returns / drawdown).
Avg Win/Loss Ratio: Average win per trade / average loss per trade.
Last Update: Current time.
i. Backtesting Metrics
Tracks:
Total trades, winning/losing trades.
Win rate (%).
Net profit ($).
Profit factor (gross profit / gross loss).
Max drawdown (%).
Simplified Sharpe ratio (returns / drawdown).
Average win/loss ratio.
Updates metrics on each closed trade.
Displays a label on the last bar with backtest period, total trades, win rate, and net profit.
j. Alerts
No explicit alertconditions defined, but you can add them for long_signal and short_signal (e.g., alertcondition(long_signal, "GT Long Entry", "Long Signal Detected!")).
Use TradingView's alert system with Strategy Tester outputs.
3. Usage Tips
Timeframe: Best for H1-D1 timeframes. Shorter frames (M1-M15) may produce noisy signals.
Settings:
Risk Management: Adjust sl_percent (e.g., 1% for volatile markets) and tp_percent (e.g., 3% for scalping).
Herd Threshold: Increase to 2.5 for stricter herd detection in choppy markets.
Liquidity Lookback: Reduce to 20 for faster markets (e.g., crypto).
Nash Period: Increase to 200 for longer-term analysis.
Backtesting:
Use TradingView's Strategy Tester to evaluate performance.
Check win rate (>50%), profit factor (>1.5), and max drawdown (<20%) for viability.
Test on different assets/timeframes to ensure robustness.
Live Trading:
Start with a demo account.
Combine with other indicators (e.g., EMAs, support/resistance) for confirmation.
Monitor liquidity traps and institutional flow for context.
Risk Management:
Always use SL/TP to limit losses.
Adjust position_size for risk tolerance (e.g., 5% of equity for conservative trading).
Avoid over-leveraging (pyramiding=3 can amplify risk).
Troubleshooting:
If no trades are executed, check signal conditions (e.g., lower herd_threshold or liquidity_sensitivity).
Ensure sufficient historical data for Nash and liquidity calculations.
If tables overlap, adjust position.top_right/bottom_right coordinates.
4. Key Differences from the Previous Indicator
Indicator vs. Strategy: The previous code was an indicator (VP + Game Theory Integrated Strategy) focused on visualization and alerts. This is a strategy with automated entries/exits and backtesting.
Volume Profile: Absent in this strategy, making it lighter but less focused on high-volume zones.
Wick Analysis: Not included here, unlike the previous indicator's heavy reliance on wick patterns.
Backtesting: This strategy includes detailed performance metrics and a backtest table, absent in the indicator.
Simpler Signals: Focuses on Game Theory signals (contrarian, momentum, Nash reversion) without the "Power/Ultra Power" hierarchy.
Risk Management: Explicit SL/TP and dynamic position sizing, not present in the indicator.
5. Conclusion
The "Game Theory Trading Strategy" is a sophisticated system leveraging herd behavior, institutional flows, liquidity traps, and Nash equilibrium to trade market inefficiencies. It’s designed for traders who understand Game Theory principles and want automated execution with robust risk management. However, it requires thorough backtesting and parameter optimization for specific markets (e.g., forex, crypto, stocks). The backtest table and visual aids make it easy to monitor performance, but always combine with other analysis tools and proper capital management.
If you need help with backtesting, adding alerts, or optimizing parameters, let me know!

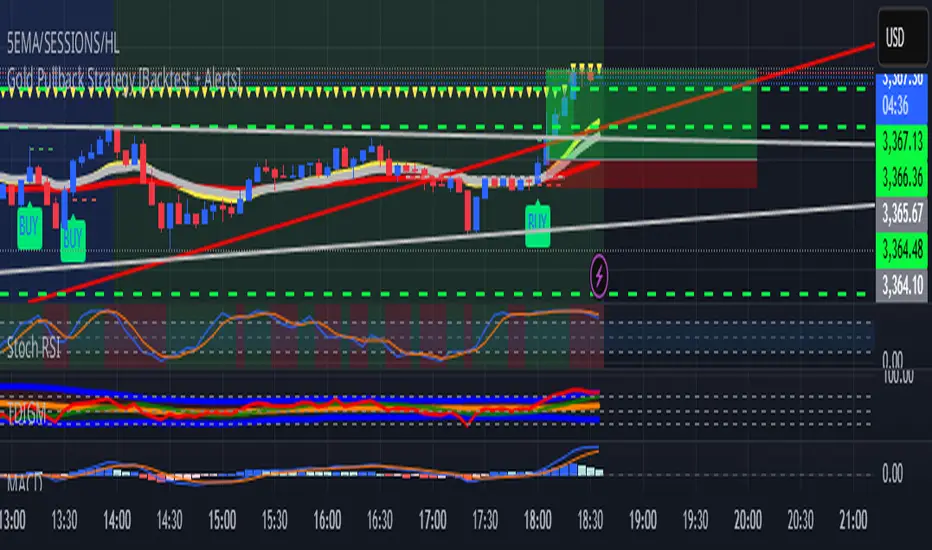
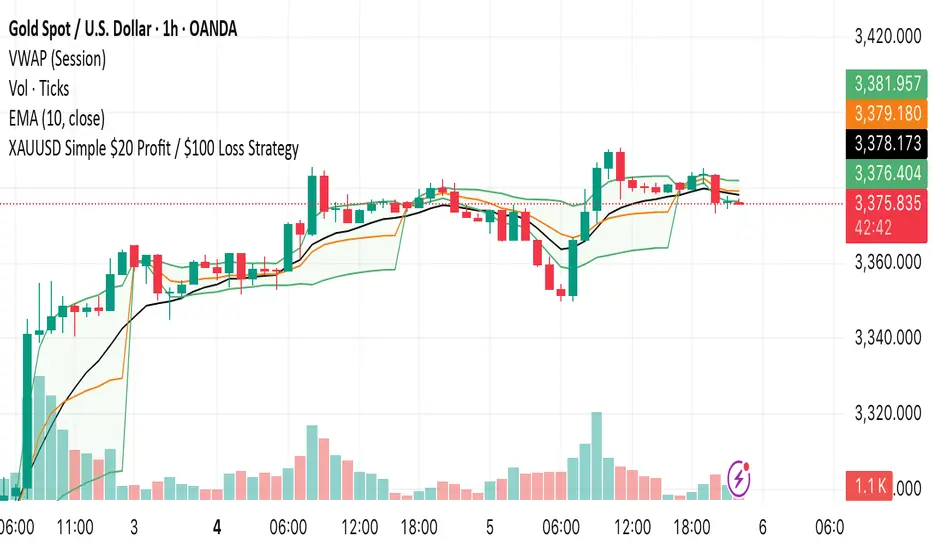
Gold Pullback Strategy [Backtest + Alerts]XAU USD M5 M15 TP1-1
BUY Pull black EMA 21
Storsi oversold