C3 Pattern Trigger-DhirenFawxThis indicator is a highly streamlined and immediate signal generator based on a specific 3-Candle (3C) pattern used to quickly identify potential demand and supply exhaustion points.
Unlike traditional zone-based indicators that wait for a price breakout after the pattern forms, the 3C Pattern Trigger signals the moment the pattern completes, offering an early entry/alert opportunity.
Connect - DhirenFawx
Candlestickpattern

Moving Average + Count Candles Number - DiLeViThis indicator can add Moving Averages and candles number within same indicator and can be personalised.

SNP420/TRCS_MASTERMicro Body Candle Highlighter is a visual tool for TradingView that continuously scans the active timeframe and highlights all candles with an extremely small body.
For every bar (including the currently forming one), the indicator compares the absolute distance between Open and Close to a user-defined threshold in ticks (default: 1 tick, based on syminfo.mintick).
If the candle’s body size is less than or equal to this threshold, the indicator draws a red frame around the candle – either around the body only or the full high-to-low range, depending on user settings.
Optionally, the indicator can also trigger alerts whenever such a “micro body” candle is detected, allowing traders to react immediately to potential indecision, pauses, or micro-reversals in price action.
author: SNP_420
project: FNXS
ps: Piece and love

Engulfing Detector by RWBTradeLabEngulfing Detector by RWBTradeLab
A clean, non-repainting engulfing pattern detector designed for traders who rely on price action and candle confirmation.
What this indicator does
This script automatically identifies and highlights two types of engulfing patterns on closed candles only:
1. Regular Engulfing (R EG)
* Regular Buy EG: A bullish candle fully engulfs the previous bearish candle’s high.
* Regular Sell EG: A bearish candle fully engulfs the previous bullish candle’s low.
2. E-Regular Engulfing (ER EG)
* Detects “extended” engulfing setups where a strong base candle is followed by 2 or more opposite-color candles and then a confirming engulf close.
* Useful for spotting delayed but powerful reversals.
Visuals on chart
* A rectangle (box) is drawn from the base candle to the confirmation candle.
* Optional text labels appear above/below the box (offset adjustable).
* Separate color controls for:
- Regular Buy / Regular Sell
- E-Regular Buy / E-Regular Sell
Alerts
Built-in alerts trigger only at candle close:
* R Buy EG
* R Sell EG
* ER Buy EG
* ER Sell EG
Each alert includes price and time in the message.
Key settings
* Candle Length: Scans last N closed candles (running candle excluded).
* On/Off toggles: Enable/disable each engulfing type and labels individually.
* Text Offset (%): Controls label distance from the box.
Non-repainting confirmation
All signals and alerts are calculated using confirmed bars only.
No running-bar signals → no repainting.
Best use
Works on any market and timeframe. For higher reliability, combine with:
* Key S/R zones
* Trend direction
* Volume or structure confirmation
Disclaimer:
This indicator is a pattern-detection tool, not financial advice. Trading involves risk; always use proper risk management and confirm signals with your own analysis.
Creator: RWBTradeLab
If you find this useful, please leave a like ⭐ and share your feedback.

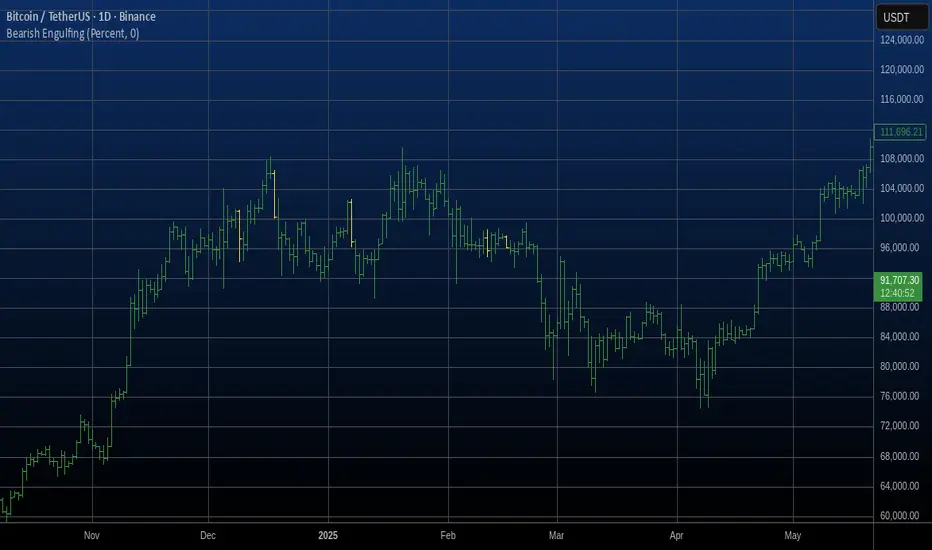
Bearish Engulfing Automatic Finding Script This is a bearish pattern formed by three candlesticks.
The pattern is based on the fact that the last candlestick must
completely engulf the previous two and be downward. The two preceding
candlesticks must also be upward. Candlestick wicks are not taken
into account.
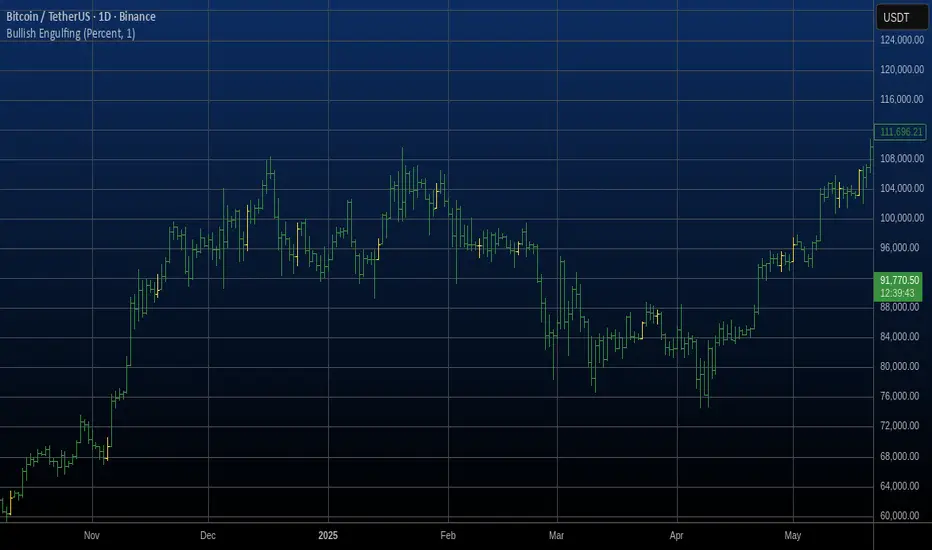
Bullish Engulfing Automatic Finding Script This is a bullish pattern formed by three candlesticks.
The pattern is based on the fact that the last candlestick must
completely engulf the previous two and be upward. The two preceding
candlesticks must also be downward. Candlestick wicks are not taken
into account.
Bullish Candlestick Pattern Tracker (21 Patterns)Script Title: Bullish Candlestick Pattern Tracker (21 Patterns)
Overview
This script is a comprehensive tool designed to automatically detect and track the lifecycle of 21 distinct bullish candlestick patterns.
It identifies a pattern upon the close of a bar and then monitors its status over a user-defined period. The primary goal is to provide traders with clear, automated signals for potential bullish reversals, complete with pre-calculated confirmation and stop-loss levels based on established technical analysis definitions.
This indicator is built in Pine Script v6 and uses a stateful tracking system to manage each detected pattern.
Key Features
21 Bullish Patterns: Detects a wide array of patterns, from single-bar formations (e.g., Bullish Hammer) to complex three-bar formations (e.g., Bullish Morning Star, Bullish Three White Soldiers).
Stateful Lifecycle Tracking: This is not just a pattern detector. It monitors each pattern's status in real-time after detection:
Not Confirmed: The pattern has formed, but the price has not yet closed above the confirmation level.
Confirmed: The price has successfully closed above the confirmation level.
Failed: The price has closed below the stop-loss level (either before or after confirmation).
Customizable Confirmation Period: Users can define how many bars the script should wait for a pattern to be confirmed or to fail (via the confBarCount input).
Clear Visual Labels: Displays a detailed label under each unconfirmed pattern, showing:
Pattern Name (e.g., "Bullish Engulfing")
Status: "Not Confirmed"
Confirmation Level (Teyit): The price that must be breached (on close) for the pattern to be considered valid.
Stop-Loss Level (S/L): The price level that invalidates the pattern.
Modular Inputs: Each of the 21 patterns can be individually toggled on or off from the settings menu, allowing you to focus only on the patterns you trust.
Methodology & Logic
The logic for pattern detection, as well as the specific rules for each pattern's Confirmation Level and Stop-Loss Level, is strictly based on the definitions provided in the "Mum Formasyonları (Kasım 2015 Versiyon 7.1.4)" guide by Matriks Bilgi Dağıtım Hizmetleri A.Ş.
This script serves as a Pine Script v6 implementation of those specific rules, designed for stock market analysis (Bullish signals only).
How to Use (Parameters Explained)
Teyit Bar Sayısı (Conf. Bar Count): This is the most important input. It defines the "expiration" for a pattern. For example, if set to 3, the script will monitor a new pattern for 3 bars. If it is not confirmed or failed within those 3 bars, the label will disappear.
Status Toggles (e.g., showNotConfirmed): Allows you to filter which pattern statuses are visible on the chart. It is recommended to keep all three active.
Pattern Toggles (e.g., 1. Bullish Hammer Göster): Use these 21 checkboxes to activate or deactivate the detection for specific patterns.
Disclaimer
This indicator is provided for educational and informational purposes only. It does not constitute financial advice or a recommendation to buy or sell any asset. All trading involves significant risk, and past performance is not indicative of future results. Please conduct your own research and backtesting before making any trading decisions.

Actionable Signals: Hammers, Shooters, and Inside Bars#TheStrat Actionable Signals
This indicator automatically detects hammers, shooters, and inside bars, which are key reversal and continuation patterns that can signal actionable trading opportunities. These 'Actionable Signals' are based on #TheStrat methodology developed by Rob Smith.
This indicator allows you to use a 'Classic' hammer/shooter definition as well as to customize hammer/shooter candle proportions to your liking.
Pattern Types
Classic Hammer/Shooter - Traditional pin bar pattern featuring a small body (≤30% of range) positioned at the extreme with a long dominant wick (3x+ body ratio). The most widely recognized reversal signal.
Custom Hammer/Shooter - Fully adjustable pattern parameters allowing you to fine-tune detection criteria for your specific trading strategy and timeframe preferences.
Paddle - Strong momentum bar with a large body (up to 85%) closing within 5% of the extreme. Identifies continuation moves with conviction. Color-validated (green hammers, red shooters).
Rejection - Wick-dominant pattern showing price rejection at extremes. Features moderate body (≤60%) with strong rejection wick (≥40%). Color-agnostic for flexibility.
Inside Bar - Bar contained entirely within the previous bar's range, signaling consolidation and potential breakout setups.
Key Features
Multi-Pattern Detection: Enable multiple pattern types simultaneously to capture different market structures
Pivot Validation: Optional swing high/low requirement ensures patterns occur at meaningful inflection points
Session Filtering: Restrict signals to specific trading sessions across multiple timezones
Visual Clarity: Color-coded markers distinguish between pattern types (customize via Style settings)
Testing Panel: Built-in debugging tool displays detailed bar analysis for fine-tuning detection parameters
How to Use
Default Settings: Start with Classic, Paddle, and Rejection patterns enabled for balanced signal generation
Pivot Filter: Keep "Require Swing High/Low" enabled to focus on patterns at key support/resistance levels
Customization: Adjust pattern strictness parameters based on your timeframe and trading style
Colors: Modify marker colors and styles through the Style tab for optimal chart visibility
Testing Panel: Enable to see why patterns are or aren't triggering on specific bars
Please share any issues you encounter, it will help improve the script for everyone!
Note: This indicator displays historical patterns and should be used as part of a comprehensive trading strategy. Past performance does not guarantee future results.

GainzAlgo Suite⭐ GainzAlgo Suite — Multi-Model Analytical Framework
GainzAlgo Suite consolidates five independently developed analytical methodologies into a single, unified framework.
Each configuration represents a distinct internal calculation model created at different stages of the project’s evolution.
The Suite provides traders with a structured way to explore multiple evaluation styles without requiring separate script publications, while ensuring legacy configurations remain intact.
All configurations share the same visual interface and non-repainting, bar-close confirmation behavior.
Their differences lie entirely in how they process market information—through sequencing, weighting, structural evaluation, volatility context modeling, and multi-layer confirmation logic.
Access instructions are available in the Author’s Notes panel.
A License Key field is included to enable the configuration assigned to each user; configurations not assigned will display a neutral “Configuration Locked” message.
📘 Why the Suite Exists (Versioning & Originality Justification)
Over the course of GainzAlgo’s development, several internal analytical frameworks were created—each using its own rule-set, evaluation sequence, and structural logic.
Publishing each model as a separate script would conflict with TradingView’s versioning guidelines.
Instead, the Suite consolidates all methodologies into one script while preserving the integrity of earlier, widely-used configurations.
This design allows traders to access multiple conceptual approaches in a single workspace and ensures each model remains available without overwriting existing tools.
The Suite is closed-source because the internal calculation logic—sequencing, weighting interactions, volatility normalization behavior, and structural confirmation processes—constitutes proprietary research developed specifically for this project.
🧠 How GainzAlgo Suite Works (General Logic)
While each configuration uses its own methodology, they all follow a structured, multi-stage evaluation pipeline:
1. Structural Pattern Evaluation
The system identifies relevant structural signals such as directional shifts, exhaustion patterns, pressure asymmetries, or micro-cycle transitions.
2. Volatility Context Modeling
Each model interprets volatility differently—through dynamic ranges, percentile comparisons, or contextual thresholds—to validate whether conditions meet its internal criteria.
3. Momentum Alignment
Momentum behavior is interpreted through slope, acceleration, mid-range transitions, and structural momentum flow depending on the configuration.
4. Directional Bias Compatibility
Trend context, structural flow, or cycle alignment is evaluated to ensure the potential signal is compatible with the broader directional environment.
5. Multi-Layer Confirmation or Threshold Evaluation
Depending on the configuration, signals appear only when the internal rule-sets or dynamic thresholds indicate a cohesive shift.
Signals are evaluated on bar close, which avoids mid-bar repainting behavior.
🔷 Standard — Structured Multi-Filter Logic
Standard uses a four-layer sequential confirmation model:
• candlestick-based reversal structure
• volatility & range validation
• momentum confirmation
• short-term trend context filtering
Each layer must agree before a signal is plotted, forming a strict conditional progression designed to reduce noise and isolate meaningful shifts.
Its design is lightweight, visually clear, and optimized for traders who prefer structured reversal confirmation.
🔷 Pro — Multi-Layer Confidence-Scoring Engine
Pro implements a confidence-scoring architecture that transforms pattern strength, volatility conditions, momentum behavior, and trend modeling into weighted numeric scores.
Key conceptual elements include:
• percentile-ranked volatility normalization
• dynamic scoring dependencies
• cycle-slope trend analysis (CSTA)
• momentum acceleration modeling (SAMSM)
• candle-structure micro-reversal evaluation (CSMRM)
A signal appears only when the combined confidence score exceeds an adaptive threshold derived from recent market conditions.
This framework represents a separate analytical category from Standard, focusing on scoring-based evaluation rather than binary confirmation.
🔷 V2 Essential — Expanded Structural Evaluation Model
V2 Essential applies a broadened structural-evaluation methodology designed to interpret slower, higher-timeframe behavioral shifts.
It uses extended condition windows, macro-level directional context, and wider structural transitions, making it suitable for traders who prefer multi-bar trend flows and broader analytical horizons.
Its sequencing prioritizes structural stability over rapid fluctuation, providing a high-level contextual interpretation of market transitions.
🔷 V2 Proficient — Balanced Adaptive Filtering Framework
V2 Proficient uses a mid-range analytical approach combining:
• adaptive structural alignment
• momentum-shift modeling
• conditional layering
• moderate-pace validation sequences
This configuration is designed to respond to medium-duration transitions by balancing reactivity with contextual filtering.
Its methodology provides versatile analytical behavior across typical intraday and multi-hour environments.
🔷 V2 Alpha — Multi-Phase Micro-Cycle Evaluation Model
V2 Alpha contains the widest internal rule-set of all configurations.
Its multi-phase evaluation process interprets:
• rapid structural shifts
• micro-cycle variations
• localized momentum surges
• high-resolution transition behavior
• dynamic condition interactions
This configuration is designed for traders who prefer detailed, fast-reacting analytical logic while maintaining bar-close confirmation and non-repainting behavior.
It does not signify superiority; it simply represents the most intricate internal methodology developed in the project.
🔒 Vendor Justification
GainzAlgo Suite’s value lies in the originality of its internal architectures:
• state-based evaluation sequences
• volatility-normalized thresholds
• multi-layer structural filtering
• dynamic scoring systems
• proprietary sequencing & weighting interactions
• conceptual models not reproducible using public indicators
Although the components (trend, volatility, momentum, structural analysis) are familiar concepts in trading literature,
the way they interact through custom decision flows, rule-sets, and evaluation phases is unique to this project and cannot be replicated through standard mashups or built-ins.
This originality justifies its invite-only nature.
📘 How to Use
1. Apply the Suite to any chart.
2. Choose the configuration you want to evaluate.
3. When enabled, signals will appear automatically at bar close.
4. Combine signals with independent analysis and risk management.
5. Use Author’s Notes to learn how to request configuration access.
⚠️ Disclaimer
GainzAlgo Suite is an analytical tool for educational purposes.
It does not guarantee accuracy or trading performance.
Users are responsible for their own trading decisions.

HTF Control Shift + Prev Candle Break Sequence 🧭 HTF Control Shift + Previous Candle Break Sequence
Overview
The HTF Control Shift + Previous Candle Break Sequence indicator identifies high-probability shift candles that suggest a potential change in market control — from sellers to buyers or vice versa — and then tracks whether price confirms that shift by breaking the previous candle’s high or low.
This tool is designed to help traders detect institutional control shifts and confirm them with price structure breaks, providing a framework for spotting early trend reversals or strong continuation moves.
How It Works
Control Shift Candle Detection
A Bullish Control Shift occurs when a candle shows:
A long lower wick (≥ Wick % Threshold of total range).
A close near the high (within Body % Threshold of the top).
A Bearish Control Shift occurs when a candle shows:
A long upper wick (≥ Wick % Threshold of total range).
A close near the low (within Body % Threshold of the bottom).
These candles are highlighted in green (bullish) or red (bearish), and optionally labeled on the chart.
Previous Candle High/Low Tracking
The script automatically plots horizontal lines at the previous candle’s high (green) and low (red).
These act as key reference levels for breakout confirmation.
Breakout Confirmation Sequence
A Bullish Sequence triggers when a Bullish Control Shift candle is followed by a break above the previous candle’s high.
A Bearish Sequence triggers when a Bearish Control Shift candle is followed by a break below the previous candle’s low.
When either sequence completes, the indicator can send a TradingView alert confirming the directional breakout.
How to Use
Timeframe:
Optimized for higher timeframes (1H, 4H, Daily) to filter out intraday noise and identify structural market shifts.
Trend Reversal Identification:
Watch for Control Shift candles at major highs/lows, order blocks, or liquidity zones — a confirmed breakout often signals a trend reversal or new directional push.
Continuation Confirmation:
In trending markets, a Control Shift candle that breaks in the direction of trend can validate a strong continuation setup.
Alert Usage:
Set alerts for:
Bullish Control Shift Confirmed Breakout
Bearish Control Shift Confirmed Breakdown
Optional: raw Control Shift or Break alerts.
Customization
Wick % Threshold: Adjusts the required wick size to define a control shift.
Body % Threshold: Controls how close the close must be to the high/low for confirmation.
Label Toggle: Optionally display labels only on control shift candles.
Best Practices
Combine with higher-timeframe trend filters.
Avoid using it alone in tight consolidation zones.
Strongest signals occur when:
Control Shift appears at key structure levels.
The breakout bar closes firmly beyond the previous high/low.
Volume supports the breakout.
Summary
✅ Detects when market control flips (buyers ↔ sellers).
✅ Confirms shift with breakout above/below previous candle.
✅ Ideal for 1H–4H swing or position trading.
✅ Provides visual, structural, and alert-based confirmation.

HTF CandlesThis Indicator allows you to display up to 10 higher timeframe candles.
One of them will always be the currently last candle (realtime candle if session is active). So if you choose to display only one candle it will be the current HTF candle. If you choose to display more than 1 candle it will be the current HTF candle plus the number of total candles minus one as historic candles (maximum 9 historic candles).
The goal is to simplify HTF analysis without the need to switch timeframes and detect HTF candle patterns while seeing the lower timeframe develop in realtime.
This is especially useful if you trade concepts like liquidity grabs/sweeps or any candle stick patterns and you want to utilize lower timeframe entries to maximize your risk to reward.
Setting Explanation
General Settings
# of Bars: Choose how many HTF candles you want to be displayed (maximum is 10).
Timeframe: Choose the timeframe that you want to be displayed.
Offset: Put in the number of bars you want to shift the HTF candles to the right (minimum is 0 which will result in a shift 3 bars to the right, to separate it from the current LTF candle). This way you can as well see 2 higher timeframes by applying the indicator twice to your chart and just shifting one timeframe so far to the right that it does not overlap the first HTF.
HTF Lines
Mark Start Of HTF Candles: If checked this will display lines according to the start of your HTF candles.
HTF Label
Show HTF Label: If checked you will see a label above the plotted HTF candles that tells you which timeframe it is.
Automatic Label Positioning: If checked your HTF Label will be 1 ATR above the highest HTF bar. This avoids putting in an absolute number which can be useful if you trade assets with vastly different prices (for example a 10 point distance will not sufficiently separate the label from the candles if trading BTC whereas a 100/500 point difference would put the label out of your screen if trading MNQ). By using the ATR the label will automatically be efficiently separated from the candles but not to far away.
Appearance
Body: Choose fill color for your bullish (left) and bearish (right) HTF candles.
Wick: Choose Wick/Border color for your HTF candles.
HTF Line: Choose color and line style for your HTF Lines (marking the start of a new HTF candle)
Label Position: Adjust the vertical distance of the label in regard to the highest high of the displayed HTF candles (This will be full points, not ticks, and is only used whenever "Automatic Label Positioning" is deselected).
Label Size: Adjust the font size of your HTF label.

GOLDSNIPERThe Gold Sniper Indicator is a precision trading tool designed specifically for scalping and intraday trading Gold (XAUUSD) on TradingView.
It automatically plots institutional key levels, detects breakout & retest opportunities, and provides trade management levels (Stop Loss & Take Profit) for structured, disciplined trading.
Aug 6
Release Notes
The Gold Sniper Indicator is a precision trading tool designed specifically for scalping and intraday trading Gold (XAUUSD) on TradingView.
It automatically plots institutional key levels, detects breakout & retest opportunities, and provides trade management levels (Stop Loss & Take Profit) for structured, disciplined trading
Aug 13
Release Notes
The Gold Sniper Indicator is a precision trading tool designed specifically for scalping and intraday trading Gold (XAUUSD) on TradingView.
It automatically plots institutional key levels, detects breakout & retest opportunities, and provides trade management levels (Stop Loss & Take Profit) for structured, disciplined trading.
3 days ago
Release Notes
The Gold Sniper Indicator is a precision TradingView tool for scalping and intraday trading Gold (XAUUSD).
It is built around a break-and-retest strategy with clear trade management: 10 pip Stop Loss, 20 pip TP1, and 35 pip TP2.
The indicator automatically:
• Plots institutional key levels and supply & demand zones
• Detects breakout and retest opportunities in real time
• Provides stop loss and take profit levels for structured, disciplined trading
Whether you’re a scalper or day trader, Gold Sniper helps you catch high-probability setups on XAUUSD with precise risk-to-reward ratios (1:1 and 1:3).

Cycle-Synced Channel Breakout📌 Cycle-Synced Channel Breakout – Detect Breakouts Confirmed by Candles and Momentum Cycles
📖 Overview
The Cycle-Synced Channel Breakout indicator is a precision breakout detection tool that combines the power of:
• Adaptive Keltner Channels
• Dominant Cycle Period Analysis (Ehlers-inspired)
• Candlestick Pattern Recognition (Engulfing)
This multi-layered approach helps identify true breakout opportunities by filtering out noise and false signals, making it ideal for swing traders and intraday traders seeking high-probability directional moves.
⚙️ How It Works
1. Keltner Channel Envelope
A dynamic volatility channel based on the EMA and ATR defines the upper and lower bounds of price movement.
2. Engulfing Candle Detection
The script detects strong bullish and bearish engulfing patterns, which often signal trend reversals or momentum continuations.
3. Dominant Cycle Momentum (Ehlers-inspired)
Using a smoothed power oscillator derived from a detrended price series, the indicator assesses whether momentum is accelerating during the breakout — filtering out weak moves.
4. Signal Confirmation Logic
A signal is only shown when:
• An engulfing pattern is detected, and
• Price breaks out of the Keltner Channel, and
• Momentum (cycle power) is rising
5. Visual Feedback
• Breakout signals are plotted with “BUY” or “SELL” labels
• Faded green/red background highlights confirmed breakouts
• Optional display of engulfing candles with triangle markers
⸻
🛠️ Key Features
• ✅ Adaptive Keltner Channels
• ✅ Bullish/Bearish Engulfing Candle Recognition
• ✅ Ehlers-style Cycle Momentum Confirmation
• ✅ Background highlights for confirmed breakouts
• ✅ Optional candle pattern visualization
• ✅ Lightweight and Pine v6 compatible
⸻
🧪 Inputs
• Keltner Length – EMA period for channel basis
• Multiplier – Multiplied with ATR to determine band width
• Cycle Lookback – Used to calculate smoothed cycle power
• Show Engulfing Candles? – Toggles candlestick signals
• Show Breakout Signals? – Toggles breakout labels and backgrounds
⸻
🧠 How to Use
• Look for “BUY” or “SELL” labels when:
• An engulfing candle breaks through the Keltner Channel
• Cycle momentum confirms strength behind the move
• The background color will faintly highlight the breakout direction.
• Use in combination with other trend or volume indicators for added confluence.
🔒 Notes
• This indicator is not repainting.
• It is designed for educational and research purposes only.
• Works across all timeframes and asset classes (stocks, crypto, forex, etc.)

CFR - Candle Formation RatioDescription
This indicator is designed to detect candles with small bodies and significant wick-to-body ratios, often useful for identifying doji-like structures and potential accumulation areas.
Features
Filter candles by maximum body size (% of the total candle range).
Require that wicks are at least X times larger than the body.
Define the position of the body within the candle (e.g., body must be between 40% and 60% of the candle height).
Visual output: a single arrow marker when conditions are met.
Fully customizable marker color and size.
⚠️ Note: The settings of this version are currently in Turkish. An English version of the settings will be released in the future.

CNagda Anchor2EntryCNagda Anchor2Entry Pine Script v6 overlay indicator pulls higher-timeframe (HTF) signal events to define anchor high/low levels and then projects visual entry labels on the lower-timeframe (LTF). It also draws auto-oriented Fibonacci retracement/extension levels for context, but it does not execute orders, stops, or targets—only visual guidance.
Inputs
Key inputs include Lookback Length for HTF scanning and a Signal Timeframe used with request.security to import HTF events onto the active chart.
Entry behavior can be set to “Confirm only” or “Wait candle,” trade side can be restricted to Buy/Sell/Both, and individual strategies (Buy WAIT/S1; Sell REV/S1/S2/S3) can be toggled.
HTF logic
The script defines WAIT/BUY setup and confirmation, SELL reversal on breaking the WAIT BUY low, and several volume/candle-based patterns (Sell S1/S2/S3, Buy S1).
It captures the associated highs/lows at those events with ta.valuewhen and imports them via request.security to form anchors (anc_hi/anc_lo) and “new trigger” booleans that gate label creation on the LTF.
Flip entries
When enabled, “Flip entries” generate contrarian labels based on breaking or confirming HTF anchors: crossing above anc_hi can trigger a flip-to-sell label, and crossing below anc_lo can trigger a flip-to-buy label.
The flip mode supports Immediate (on cross) or Confirm (on sustained break) to control how strict the trigger is.
Fibonacci drawing
User-specified Fib levels are parsed from a string, safely converted to floats, and drawn as dotted horizontal lines only when they fall inside an approximate visible viewport. Orientation (up or down) is decided automatically from pending signal direction and a simple context score (candle bias, trend, and price vs. mid), with efficient redraw/clear guards to avoid clutter.
Dynamic anchors
If HTF anchors are missing or too far from current price (checked with an ATR-based threshold), the script falls back to local swing highs/lows to keep the reference range relevant. This dynamic switch helps Fib levels and labels remain close to current market structure without manual intervention.
Signal labels
Labels are created only on confirmed bars to avoid repainting noise, with one “latest” label kept by deleting the previous one. The script places BUY/SELL labels for WAIT/CONFIRM, direct HTF patterns (Buy S1, Sell S1/S2/S3), and contrarian flip events, offset slightly from highs/lows with clear coloring and configurable sizes.
Visual context
Bars are softly colored (lime tint for bullish, orange tint for bearish) for quick context, and everything renders as an overlay on the price chart. Fib labels include a Δ readout (distance from current close), and line extension length, label sizes, and viewport padding are adjustable.
How to use
Set the Signal Timeframe and Lookback Length to establish which HTF structures and ranges will drive the anchors and entry conditions. Choose entry flow (Wait vs Confirm), enable Flip if contrarian triggers are desired, select the trade side, toggle strategies, and customize Fibonacci levels plus dynamic-anchor fallback for practical on-chart guidance.
Notes
This is a visual decision-support tool; it does not place trades, stops, or targets and should be validated on charts before live use. It is written for Pine Script v6 and relies heavily on request.security for HTF-to-LTF transfer of signals and anchors.

Swing Failure Pattern (SFP) with AlertsSwing Failure Pattern (SFP) — Indicator Overview
Detects classic Swing Failure Patterns and their confirmations, with optional volume validation and EMA-based trend/reversal filters. Includes convenient alert categories.
1) What are SFPs?
Price briefly breaks a prior swing high/low (liquidity grab), fails to continue, and snaps back inside the range — often a potential reversal from trapped breakout participants.
2) What the indicator plots
SFP candle: wick extending beyond the previous swing (bearish above a swing high, bullish below a swing low).
Opposite/confirmation level: dotted level derived from the opposite side of the swing structure.
Confirmation: a later close beyond the opposite level; optional ▲/▼ triangles can appear with the “SFP” labels.
Two moving averages: fast/slow MAs for context (plot type selectable); style (color/width) set in the Style tab.
3) Volume validation (optional)
Uses a lower timeframe to compare the share of volume outside the swing level (wick area) against a threshold.
None: Use when volume data is questionable (CFDs/FX) or when you want maximum SFP visibility and rely on price confirmation only.
Volume outside swing < Threshold: Default for ranges/quiet phases. Idea: thin volume outside the level suggests a liquidity sweep rather than a true breakout. Start with 20–30%. Fewer but cleaner setups; works well near HTF zones (Daily/4H).
Volume outside swing > Threshold: For news/volatility/capitulation spikes. Idea: heavy pressure beyond the level was absorbed (long wick) — strong reversals possible but more false signals. Start with 50–60%. Always wait for price confirmation.
You can auto-select a lower timeframe or set one manually for the volume check.
4) EMA filter: Trend vs. Reversal
Filtering uses EMAs of the chosen fast/slow lengths (independent of the plotted MA type).
NO MA-Filter: no EMA condition; all SFPs allowed.
Reversal Signal: bullish SFP only if fast EMA < slow EMA ; bearish SFP only if fast EMA > slow EMA .
Trend Follow: bullish SFP only if fast EMA > slow EMA ; bearish SFP only if fast EMA < slow EMA .
Tip: MA colors/widths are controlled in the Style tab; the EMA filter logic isn’t affected by the plotted MA type.
5) Alerts
Multiple alert categories let you react to events like any bullish/bearish signal, SFP detected, and confirmation occurred — without listing each individual condition. Create an alert on the indicator and pick what fits your workflow.
Always trade without risk management.
Reminder: Backtest, align with HTF context and sessions, and use solid risk management.

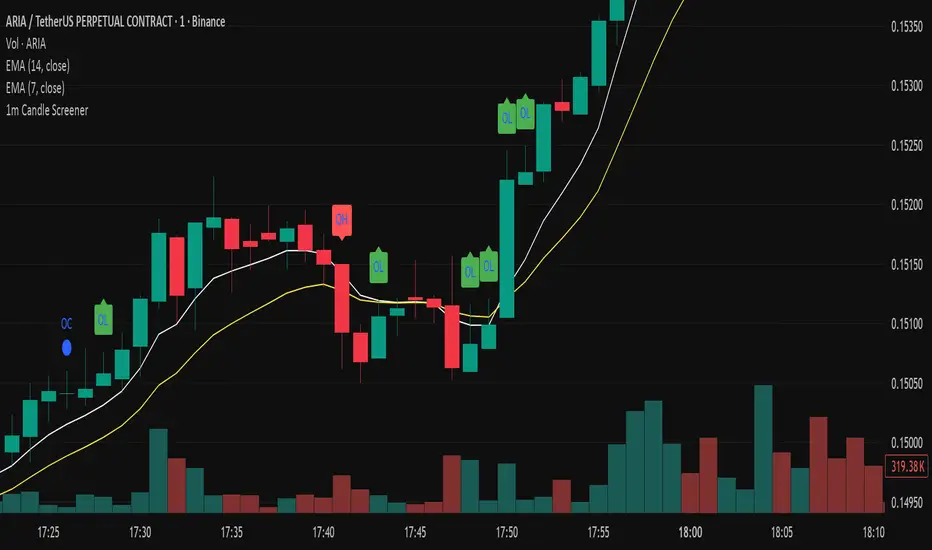
Precision Candle Marker – OL/OH/OC ScreenerThis indicator highlights high-probability precision candles on any perpetual contract, designed especially for scalpers and short-term traders.
It marks three unique candle setups on the 1-minute chart (works on other timeframes too):
🟢 Open = Low (OL) → Strong bullish momentum, buyers took control instantly.
🔴 Open = High (OH) → Strong bearish momentum, sellers took control instantly.
🔵 Open = Close (OC) → Doji / indecision candle, potential reversal or continuation signal.
Use cases:
Identify breakout entry points in uptrend/downtrend.
Filter noise and focus on precision candles.
Combine with trend indicators (EMA, VWAP, RSI) for confirmation.
This tool is best suited for scalping perpetual contracts (e.g., BTCUSDT, ETHUSDT) but works on any symbol and timeframe.
Intraday Buy/Sell/Average Zones by Chaitu50cIntraday Buy/Sell/Average Zones by chaitu50c
Timeframe:
Tested on the 5-minute chart.
Recommended timeframe: 5-minute
What it does
This indicator marks intraday Buy (green) and Sell (red) zones made by strong close-confirmed breakouts. These zones act as support/resistance. If price later closes through a zone, the zone changes color from that bar forward (support ↔ resistance). It can flip more than once.
How zones form
Single breakout: an opposite-type candle closes beyond the previous candle’s high/low.
Double breakout: a base candle, then two opposite-type candles, and the second one closes beyond the base high/low.
Zone size
Buy zone: from the combo lowest low up to the nearest open/close of the combo.
Sell zone: from the combo highest high down to the nearest open/close of the combo.
Color shift (optional)
If price closes through a zone, it flips color at that bar and behaves as the other side (support ↔ resistance). Flips can happen again later.
Overlap control
When a new zone overlaps an existing same-color zone in the same session, choose:
Merge (combine), or
Suppress (ignore the new one).
Flipped zones use their current color for this.
Right edge & session
All zones extend to the right (your offset). Detection is limited to your chosen session, and you can show only the last N sessions.
---
How to trade (simple)
A) Initial breakout trade
When a new zone forms, that breakout itself can be a trade idea in the breakout direction, The stoploss will be the zone.
B) Zone breakout trade (flip)
If price later closes out of a zone and it changes color, that breakout is another trade opportunity in the new direction.
C) Retrace & average trade
When price retests a zone, wait for a confirmation candle in the zone’s favor
— bullish close for a green zone, bearish close for a red zone — then average entries inside/near the zone.
Place stops just beyond the opposite edge of the zone.
If the zone flips color, stop averaging; bias changed.
---
Key settings
Breakout type: Single and/or Double
Confirm on Close: strict mode (no intrabar preview) or allow intrabar preview that auto-removes if fail
Color Shift on Breaks: on/off
Same-Type Overlap: Merge/Suppress
Session, Sessions to Display, Right Offset, Colors, Max Zones
Reminder: Best results on the 5-minute timeframe (tested and recommended).

Bionic Candlestick IndikatorBionic Candlestick Indicator for TradingViewOverviewThe Bionic Candlestick Indicator is a customizable Pine Script Version 6 indicator designed for TradingView. It visually highlights key candlestick patterns to identify bullish, bearish, and Doji signals, helping traders analyze market trends and potential reversals. The indicator offers flexible display options, allowing users to plot custom candlesticks or color the chart background based on detected patterns, with optimized performance for large charts.FeaturesCandlestick Patterns:Strong Bullish: Close = High and Close > Open (e.g., strong buying pressure).
Strong Bearish: Close = Low and Close < Open (e.g., strong selling pressure).
Bullish Pullback: Close > Open with a larger High-to-Close distance.
Bearish Pullback: Close < Open with a larger Low-to-Close distance.
Doji Patterns: Bullish Doji, Bearish Doji, Equilibrium Doji (Open = Close with balanced wicks), and Empty Doji (High = Low and Open = Close).
Customizable Colors: Choose colors for each pattern (e.g., yellow/green for bullish, blue/red for bearish, purple for Equilibrium Doji).
Display Options:Plot custom candlesticks over the chart or color the background.
Toggle visibility of specific patterns (bullish, bearish, Doji, Equilibrium).
Performance Optimization: Limits calculations to a user-defined number of bars (max_bars) to reduce lag on large charts.
How to UseAdd the Indicator:Copy the provided Pine Script code into TradingView’s Pine Editor.
Click “Add to Chart” to apply the indicator.
Adjust Visual Order:To ensure the indicator displays correctly, go to the indicator list in TradingView, click the gear icon next to “Bionic Candlestick Indikator,” and select “Visual Order > Bring to Front.”
If “Draw Above Chart” is enabled, hide the chart’s default candlesticks:Go to Chart Settings > Symbol > uncheck “Candles” to avoid overlap.
Configure Settings:Open the indicator’s settings and adjust the following:Bullish/Bearish/Doji/Equilibrium Signals: Enable or disable specific candlestick patterns.
Candlestick Colors: Select colors for each pattern (e.g., yellow, green, blue, red, purple, gray).
Draw Above Chart: Check to plot custom candlesticks; uncheck to color the chart background.
Maximum Bars to Calculate: Set to a value like 2000–5000 to limit calculations and improve performance (set to 0 for no limit).
Save the settings.
Interpretation:Bullish Signals (Yellow/Green): Indicate potential buying opportunities or upward momentum.
Bearish Signals (Blue/Red): Suggest selling pressure or downward momentum.
Doji Patterns (Dark Green/Dark Red/Purple/Gray): Highlight market indecision or potential reversals.
Combine with other indicators (e.g., RSI, moving averages) for confirmation.
Performance Tips:Set “Maximum Bars to Calculate” to a lower value (e.g., 2000) to reduce lag on charts with many bars.
Use TradingView’s Pine Profiler to identify performance bottlenecks.
Test on smaller timeframes or chart ranges to ensure smooth rendering.
NotesVisual Order: If the indicator only appears after clicking the chart, ensure it is set to “Bring to Front” in the visual order, and disable default candlesticks if plotting custom ones.
Performance: Lowering “Maximum Bars to Calculate” reduces computational load but may skip older signals. Adjust based on your chart size and needs.
Compatibility: The indicator uses Pine Script Version 6. If TradingView does not support Version 6, change @version=6 to @version=5 and retest.
Debugging: If issues persist, check for conflicts with other indicators or chart settings, and ensure the chart is refreshed.
This indicator is ideal for traders looking to visually identify key candlestick patterns with customizable options, optimized for performance on TradingView charts. For support or further customization, refer to TradingView’s documentation or community forums.

Rally Base Drop Signals [LuxAlgo]The Rally Base Drop indicator is built around the Supply and Demand (SND) concept known as "Rally, Base & Drop" Candles. These candle types are commonly used in this trading approach to identify price structure.
This indicator highlights bars by labeling them as "Rally," "Drop," or "Base" candles. It also identifies specific sequence patterns formed by these candles.
🔶 USAGE
The Rally, Base, Drop candlestick approach is a straightforward method for identifying price action structure.
Candles are categorized into three types, which are then analyzed to understand market structure and Supply/Demand levels.
Rally: Two or more consecutive bullish candles.
Drop: Two or more consecutive bearish candles.
Base: A single bullish or bearish candle that breaks the previous trend.
🔹 Rally & Drop Candles
These candles show clear directional momentum and signal whether demand or supply is dominating. They are helpful when identifying trends, as they highlight strong price movement.
🔹 Base Candles
In most SND strategies, "Base" can have several interpretations.
Typically, base candles represent short periods of consolidation that test the trend before continuation. They can also be found at turning points (tops or bottoms).
For this indicator, a base candle is simply one that does not follow the direction of nearby candles or is where a Drop and Rally meet. Multiple base candles often reflect indecision in the market, suggesting a temporary balance between buyers and sellers.
🔹 Reversal Sequences
Rally-Base-Drop (RBD)
Drop-Base-Rally (DBR)
In Supply and Demand analysis, these sequences are considered reversals. They mark zones where buyer and seller activity has shifted, which can lead to future price reactions. These areas are known as "Supply or Demand Zones" and are often revisited by price, making them useful for trade setups.
🔹 Continuation Sequences
Rally-Base-Rally (RBR)
Drop-Base-Drop (DBD)
Continuation sequences show a brief pause in the trend, followed by further movement in the same direction. In SND terms, they represent zones where orders accumulate before a continuation move. These are typically used to join ongoing trends, as they indicate sustained interest from buyers or sellers.
🔶 DETAILS
🔹 Color Modes
The script includes three color modes. "No Color" is self-explanatory, while the other two options relate to how candles are detected.
A Rally or Drop requires at least two candles to be successfully identified. As a result, detection occurs on the second candle. However, the full Rally or Drop includes both candles.
Two coloring methods are available:
Full Color: Once a Rally or Drop is detected (on the second bar), both candles are colored, starting from the first. This reflects the full pattern.
Color on Detection: Only the second candle (where detection occurs) is colored. This avoids changing past bars and may be useful for live analysis.
🔶 SETTINGS
Sequences: Select which sequences to display on the chart.
Bar Color Logic: Choose the preferred bar coloring method.

Engulfing Pro v1Engulfing Pro v1 — Pro Inside (C2-in-wick) signals
Engulfing Pro v1 finds a precise three-bar sequence designed to catch clean continuations or turns after an impulsive move. The signal—called Pro Inside—fires when price closes back inside the wick of a prior engulfing bar, often indicating a controlled pullback into freshly swept liquidity.
What it detects
Engulfing pre-condition (Bars -2 → -1):
A strict bullish or bearish body engulfing occurs one bar before the signal (larger body, full body containment).
Pro Inside signal (Bar 0 / C2):
The current bar (C2) closes inside the wick of the engulfing bar (C1):
Bullish: C2 closes inside C1’s upper wick
Bearish: C2 closes inside C1’s lower wick
Optional C3 confirmation (info only):
The next bar closes beyond C2’s extreme (above for bullish, below for bearish).
Why it matters
The “close-inside-wick” structure frequently marks a measured pullback after momentum just flipped (engulfing), offering a clear, rules-based entry with defined invalidation.
Inputs
Show Pro Inside (Bullish) — toggle bullish signals
Show Pro Inside (Bearish) — toggle bearish signals
Change bar color on signal (C2) — color C2 (lime/red)
Plot markers — C2 triangles and ✔ on C3 confirmations
Boundary padding (ticks) — nudge wick bounds to reduce marginal touches
Visuals & Alerts
Markers:
“C2” triangle up/down on qualifying bars
“✔” circle on C3 confirmations
Alert names:
Pro Inside (Bullish)
Pro Inside (Bearish)
Pro Inside — Bullish C3 confirmation
Pro Inside — Bearish C3 confirmation
How to use (ideas, not advice)
Entry: Aggressive at/after C2 close; conservative on C3 confirmation.
Stops: Common placements beyond the opposite side of C2, or beyond C1’s wick.
Confluence: Pair with market structure, higher-timeframe bias, or Supply & Demand zones for selectivity.
Timeframes/markets: Works on any symbol/TF; adapt padding for volatility.
Notes
Evaluates on bar close (no look-ahead).
Visual/alert tool for study and workflow—not financial advice.
Always forward-test and risk-manage appropriately.

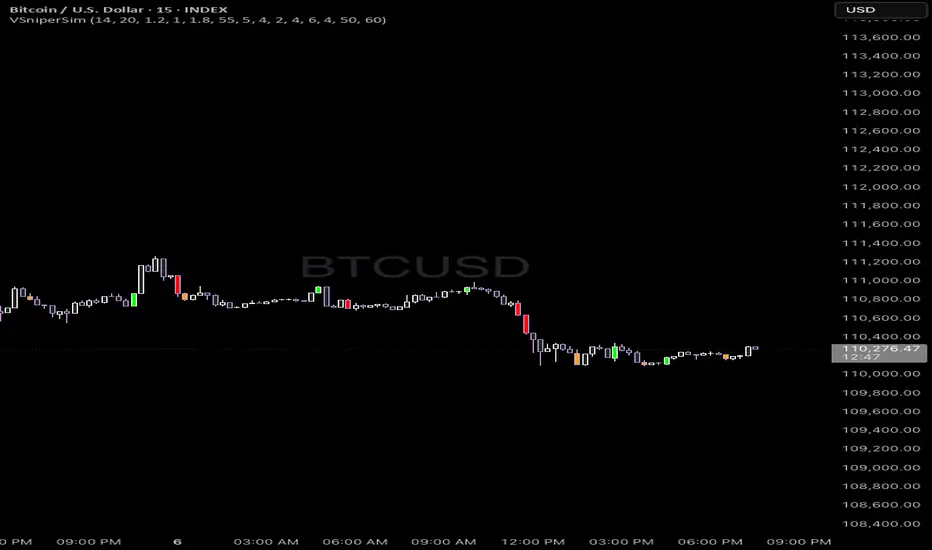
Vector Sniper Pro What it is
Vector Sniper (Simplified) is a single, original algorithm that flags impulsive “vector” moves only when volatility, volume, and structure align. It is not a mashup of other indicators; everything below is computed from raw OHLCV with a small, transparent ruleset.
⸻
Core idea (signal = force × participation × context)
1. Force (Volatility):
• We z-score true range: trZ = (ATR(1) - SMA(ATR(1), N)) / StDev(ATR(1), N).
• A move must exceed a user-set Volatility Z-Score.
2. Participation (Volume):
• We z-score raw volume: volZ = (Vol - SMA(Vol, N)) / StDev(Vol, N).
• Volume must also exceed a Volume Z-Score.
3. Context (Structure, Body, Imbalance, Traps):
• Body% filter: real body / range ≥ Min Body %.
• Delta-volume proxy: (bullVol − bearVol) / volume, where bullVol = volume*(close−low)/range and bearVol = volume*(high−close)/range. We require positive imbalance for bulls, negative for bears.
• Structure break (optional): price must take out the prior N-bar high/low.
• Trap detection (optional): spring/upthrust patterns defined by lower-low/upper-high followed by a close back inside.
If the above align, you get a Bull Vector (green) or Bear Vector (red). “Extreme” vectors require the same conditions at a higher multiple (Ext Mult).
⸻
Noise control (pre-signal gate)
Before a vector is allowed, a pre-signal score (0–7) must pass:
• Checks include spring/upthrust, no-supply/no-demand, imbalance, volume > average, VWAP side alignment, EMA trend alignment, proximity to structure break, and candle direction.
• You choose a minimum score, persistence (must occur ≥N times inside last M bars), cooldown after a pass, and hysteresis vs the opposite side.
This prevents one-off blips and keeps signals directional.
⸻
Optional confluence
• VWAP alignment: require price on the correct side and VWAP slope with it.
• EMA filter: require EMA trend agreement.
• HTF bias (optional): compare HTF close vs HTF EMA on a selected timeframe.
• Implemented with request.security and no look-ahead; bias updates when the higher timeframe bar closes.
⸻
Visuals & alerts
• Candle colors (5 total):
• Green = Bull Vector, Red = Bear Vector.
• Blue = Pre-Bull, Orange = Pre-Bear.
• Gray = Neutral.
• Markers (optional): diamonds = “Extreme” vectors; small triangles = pre-signals.
• Built-in alerts: Bull Vector, Bear Vector, Extreme Bull/Bear, Pre-Bull, Pre-Bear.
• Add from: Alerts → Condition → this script → choose event.
⸻
How to use (practical)
1. Start with defaults. Turn on VWAP and EMA filters; add HTF bias if you want fewer but cleaner signals.
2. Hunt for alignment: Pre-signal (blue/orange) → Vector (green/red) in the same direction.
3. Use your own risk model for entries/exits; the script does not place orders or compute stops/targets.
⸻
Inputs (plain English)
• ATR/Volume Periods & Z-Scores: sensitivity to volatility/participation.
• Extreme Multiplier: threshold for “Extreme” vectors.
• Structure Break (bars) & Traps: contextual confirms.
• Pre-signal gate: Min Score, Persistence (N in last M), Cooldown, Opposite-side lockout.
• Confluence: VWAP side, EMA trend, optional HTF bias (timeframe + EMA length).
• Visuals: candle painting and markers.
⸻
Design notes / limitations
• Signals evaluate on bar close. Intrabar they can form and cancel; for consistency, trade on closed bars.
• HTF bias is derived from closed HTF bars; no future data is used.
• This is an indicator, not financial advice. Backtest forward and manage risk.
⸻
Why this isn’t a “mashup”:
All components are purposeful and documented: z-score volatility + z-score volume (force & participation), body% and delta-volume (quality), structure & traps (context), and a scored, persistent pre-filter with VWAP/EMA/HTF alignment (noise control).
Balanced Big Wicks (50/50) HighlighterThis open-source indicator highlights candles with balanced long wicks (50/50 style)—that is, candles where both upper and lower shadows are each at least 30–60% of the full range and within ~8% of each other, while retaining a substantial body. This specific structure often reflects indecision or liquidity sweeps and can precede strong breakout moves.
How It Works (Inputs and Logic)
Min wick % (each side): 30–60% of candle range
Max body %: up to 60% of range (preserves strong body presence)
Equality tolerance: wicks within 8% of each other
ATR filter (multiples of ATR14): ensures only significant-range candles are flagged
When a “50/50” candle forms, it’s visually colored and labeled; audibly alertable.
How to Use It
Long setup: price closes above the wick-high → potential long entry (SL below wick-low, TP = 1:1).
Short setup: price closes below wick-low → potential short entry (SL above wick-high, TP = 1:1).
Especially effective on 5–15 minute scalping charts when aligned with high-volume sessions or HTF trend context.
Why This Indicator Is Unique
Unlike standard wick or doji voters, this script specifically filters for candles with a strong body and symmetrical wicks, paired with a range filter, reducing noise significantly.
Important Notes
No unrealistic claims: backtested setups indicate high occurrence of clean breakouts, though performance depends on market structure.
Script built responsibly: uses real-time calculations only, no future-data lookahead.
Visuals on the published chart reflect default input values exactly.
