Morning & Evening Star Pro (Candle Pattern)Hello Traders!
The Morning & Evening Star Pro indicator often catches the absolute top or bottom of a move and is a reliable reversal indicator. It also provides excellent entries in a strong trending market. For example, in an uptrend you can use a morning star as a pullback entry signal.
The indicator is an advanced tool for identifying powerful reversal patterns in the market. It combines traditional candlestick analysis with modern technical indicators to provide traders with high-probability entry and exit signals.
Key features:
Accurate pattern detection:
Utilizes sophisticated algorithms to identify genuine Morning Star and Evening Star patterns, filtering out false signals.
Trend filter:
Incorporates a customizable Simple Moving Average (SMA) to align signals with the overall market trend, enhancing trade quality.
Volatility awareness:
Integrates Average True Range (ATR) calculations to ensure detected patterns are significant relative to recent price action.
Visual clarity:
Highlights Morning Star and Evening Star patterns with customizable colors and shapes, making them easy to spot on the chart.
Flexible customization:
Offers a wide range of user inputs to tailor the indicator to various trading styles and preferences.
Filtered signal display:
Option to show filtered-out signals, providing insight into the indicator's decision-making process.
Morning Star
Is a bearish reversal (or continuation) pattern consisting of three candles:
A large bearish candle
A small-bodied candle like a Doji or Pin bar
A bullish candle
Evening Star
Is a bullish reversal (or continuation) pattern consisting of three candles:
A large bullish candle
A small-bodied candle like a Doji or Pin bar
A bearish candle
Key differences in this implementation
The middle candle can be either a Doji or a Pin bar, expanding the traditional definition.
The second candle can be a Pin bar, and the third candle can be an outside bar reversal, allowing for more flexibility in pattern recognition.
What makes this indicator unique
Comprehensive pattern analysis:
Goes beyond simple price action by considering multiple factors such as candle body ratios, wick lengths, and relative positions to previous candles.
Adaptive to market conditions:
Uses dynamic thresholds based on recent volatility (ATR) to adjust pattern detection criteria.
Educational value:
The option to display filtered signals helps traders understand why some patterns are rejected, aiding in skill development.
How to Trade with this Indicator:
This indicator often catches the absolute top or bottom of a move and is a reliable reversal indicator. It also provides excellent entries in a trending market. For example, in a strong uptrend you can use morning star signals to enter in a pullback.
Bullish Opportunities:
Look for Morning Star patterns (aqua-colored candles and labels) as potential buy signals.
Bearish Opportunities:
Watch for Evening Star patterns (orange-colored candles and labels) as potential sell signals.
Entry: At next bar open (after the aqua-colored candle for bullish or orange-colored candle for bearish completes)
Stop loss: 2 ticks below/above the pattern's low/high.
Stop loss alternative: If the colored candle is a very strong candle (e.g. for morning star a candle with almost no down wick and a close near the top) the stop goes 2 ticks below/above the colored candle.
Take profit: 3R or use a trailing stop.
Trend Alignment:
For conservative trading, only take trades in the direction of the overall trend as indicated by the SMA.
Note: if you want to see candle coloring of the morning and evening star, you must put the indicator to the top of the object tree.
Candlestickpattern

Big Candle HighlighterBig Candle Highlighter
The Big Candle Highlighter indicator highlights significant candles based on their percentage difference between the open and close prices. This tool helps traders quickly identify candles with substantial price movements, which can be crucial for spotting key price action, potential reversals, or significant market events.
Key Features:
Percentage Threshold : Customize the minimum percentage difference from open to close required to mark a candle as "big."
Bullish and Bearish Markers : Bullish big candles are marked with a label below the bar in green, while bearish big candles are marked with a label above the bar in red.
Background Highlighting : Optionally highlight the background of big candles for better visual emphasis.
Inputs:
Percentage Threshold (% ): Set the percentage threshold to define what constitutes a "big" candle. For example, a threshold of 2.0 means that only candles with a 2% or more difference between open and close will be marked.
Color for Big Bullish Candle : Choose the color for labeling and highlighting bullish big candles.
Color for Big Bearish Candle : Choose the color for labeling and highlighting bearish big candles.
Usage :
This indicator is useful for traders looking to identify significant price movements and potential trading opportunities. By focusing on candles that show substantial changes from open to close, you can better understand market dynamics and make more informed trading decisions.
Add the Big Candle Marker to your charts to enhance your technical analysis and stay ahead of market trends.

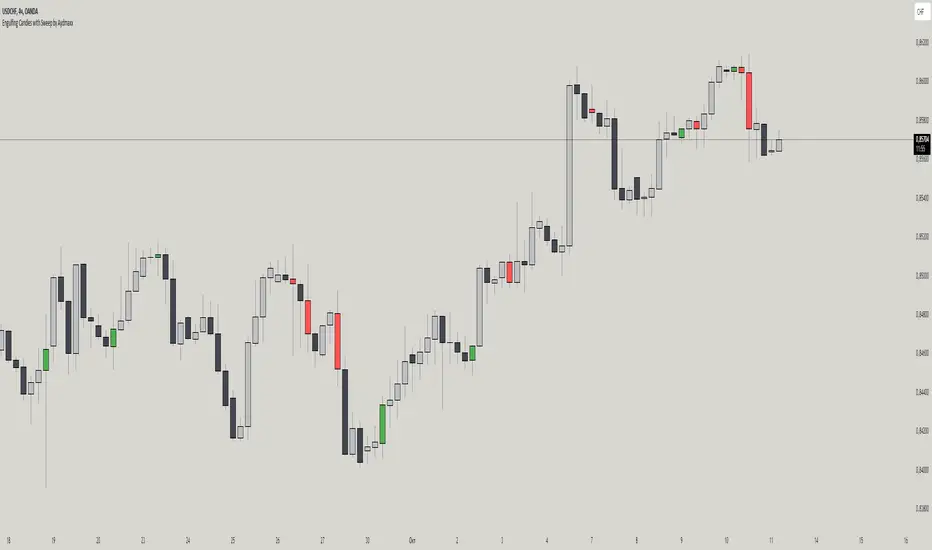
Engulfing Candles with Sweep by AydmaxxEngulfing Candles with Sweep Indicator
The "Engulfing Candles with Sweep" indicator identifies bullish and bearish engulfing candles that exhibit liquidity sweeps. It marks these significant candlestick patterns and draws a 50% Fibonacci retracement line from the high to low of the engulfing candle. The indicator helps traders spot potential reversal points where large market players might be accumulating or distributing positions.
Key Features:
Bullish Engulfing Candle with Sweep:
Identifies when a bullish candle (closing higher than it opened) engulfs the previous bearish candle (closing lower than it opened).
Ensures that the bullish candle’s low is lower than the previous candle’s low, indicating a sweep of liquidity.
Marks the identified bullish candle with a symbol below the candlestick.
Draws a 50% Fibonacci retracement line from the high to the low of the bullish engulfing candle.
Bearish Engulfing Candle with Sweep:
Identifies when a bearish candle (closing lower than it opened) engulfs the previous bullish candle (closing higher than it opened).
Ensures that the bearish candle’s high is higher than the previous candle’s high, indicating a sweep of liquidity.
Marks the identified bearish candle with a symbol above the candlestick.
Draws a 50% Fibonacci retracement line from the high to the low of the bearish engulfing candle.
Customizable Settings:
Fibonacci Line Color: Allows customization of the Fibonacci retracement line color for both bullish and bearish engulfing candles.
Fibonacci Line Style: Provides options to choose the line style (solid, dotted, dashed).
Fibonacci Line Width: Enables adjustment of the line width for better visibility.
Toggle Fibonacci Lines: Option to enable or disable the display of Fibonacci retracement lines.
How to Use:
Apply the indicator to your chart.
Look for symbols below or above the candlesticks, indicating bullish or bearish engulfing candles with liquidity sweeps.
Utilize the 50% Fibonacci retracement lines to identify potential support or resistance levels.
Benefits:
Helps in identifying key reversal patterns in the market.
Provides visual aids with Fibonacci retracement levels for potential entry and exit points.
Enhances trading decisions by confirming engulfing patterns with liquidity sweeps.
Last Candle OHLC (Ticks or Points)What the Code Does
1. **Draws Lines and Labels**:
- It draws lines on your chart to show the high, low, open, and close prices from the previous period (like the previous day or week).
- It also labels these lines with numbers that tell you how far the current price is from these levels.
2. **Shows Price Movement**:
- You can see how far the price has moved from these levels in terms of small price changes (ticks) or larger units (points).
- This helps you understand price movements and potential levels of support or resistance.
3. **Customizable**:
- You can choose whether to show these lines and labels, and you can select if you want to see the movement in ticks or points.
- The lines can extend into the future on your chart to help you anticipate where prices might be in the coming days.
### How It’s Useful:
1. **Identify Key Levels**:
- It helps you spot important price levels from past periods, which can act as support or resistance.
2. **Understand Price Movement**:
- You get a visual sense of how much the price has moved from key levels, which can help you gauge market volatility.
3. **Plan Trades**:
- By seeing where the price has been and how it has moved, you can better plan your trades, like deciding where to enter or exit based on these levels.
4. **Flexible for Different Markets**:
- It works across various markets, like stocks, futures, and forex, adjusting to the specific characteristics of each instrument.
In short, this tool helps you visualize and understand past price movements and levels on your chart, aiding in your trading decisions.

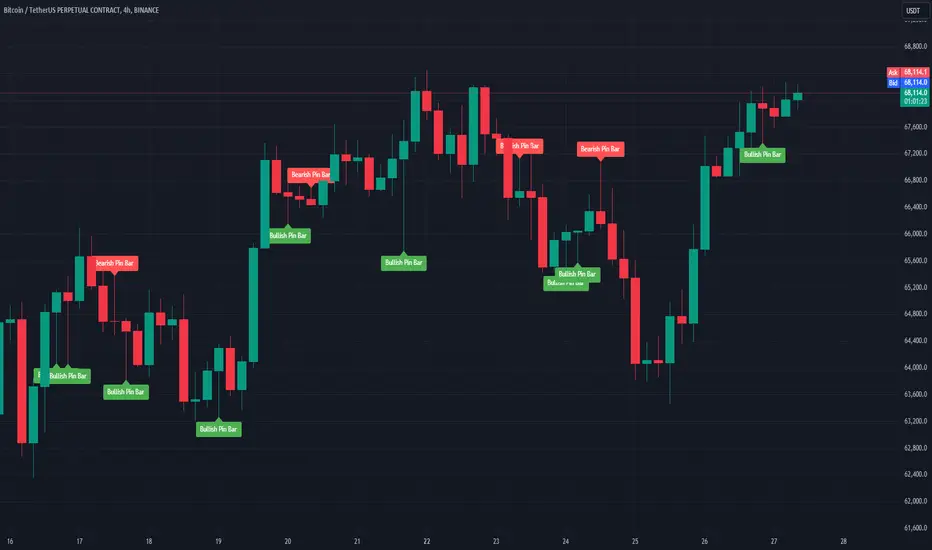
Beno Pinbar v1Overview
This Pine Script indicator is designed to be the best tool available for detecting pinbars in the market. It focuses on specific conditions to identify pinbars accurately and suggests a strategy using Fibonacci levels for trading. There is no other indicator on TradingView capable of what this indicator does, making it unique and highly valuable for traders.
Key Features
Pinbar Detection Criteria:
The indicator only detects pinbars if the body of the candle is between the 1.0 Fibonacci level and the 0.618 Fibonacci level.
This strict criterion ensures that only the most reliable pinbars are identified, enhancing the accuracy of the indicator.
Trading Strategy:
Bullish Pinbar: Draw a Fibonacci retracement from the high price to the low price of the pinbar.
Take Profit (TP) Levels: Set at 1.618, 2.618, and 3.618 Fibonacci levels.
Stop Loss (SL): Set at the 0 Fibonacci level.
Bearish Pinbar: Draw a Fibonacci retracement from the low price to the high price of the pinbar.
Take Profit (TP) Levels: Set at 1.618, 2.618, and 3.618 Fibonacci levels.
Stop Loss (SL): Set at the 0 Fibonacci level.
Support and Resistance Consideration:
The indicator takes into account the support and resistance lines around the candle, adding an extra layer of reliability to the detected pinbars.
Time Frame Efficiency:
The indicator performs better on higher time frames, providing more reliable results and reducing the noise often found in lower time frames.
Uniqueness:
This indicator's ability to detect pinbars based on the strict Fibonacci criteria and its integration with support and resistance levels makes it unmatched by any other indicator available on TradingView.
How It Works
The indicator scans the chart for candles that meet the specific pinbar criteria (body between 1.0 and 0.618 Fibonacci levels).
Once a pinbar is detected, it highlights the candle and provides the Fibonacci levels for the suggested trading strategy.
The user can then place trades based on these levels, with clearly defined take profit and stop loss points.
Usage Tips
Use this indicator on higher time frames for the best results.
Combine the pinbar signals with other technical analysis tools and market context to enhance trading decisions.
Monitor support and resistance levels closely to validate the pinbar signals.
Arabic Version
مؤشر Pine Script لاكتشاف Pinbar
نظرة عامة
تم تصميم هذا المؤشر باستخدام Pine Script ليكون أفضل أداة متاحة لاكتشاف الشموع العاكسة (Pinbars) في السوق. يركز المؤشر على شروط محددة لاكتشاف الشموع العاكسة بدقة ويقترح استراتيجية باستخدام مستويات فيبوناتشي للتداول. لا يوجد أي مؤشر آخر على TradingView قادر على تحقيق ما يفعله هذا المؤشر، مما يجعله فريدًا وذو قيمة عالية للمتداولين.
الميزات الرئيسية
معايير اكتشاف الشموع العاكسة:
يكتشف المؤشر الشموع العاكسة فقط إذا كان جسم الشمعة بين مستوى فيبوناتشي 1.0 ومستوى فيبوناتشي 0.618.
يضمن هذا المعيار الصارم اكتشاف الشموع العاكسة الأكثر موثوقية فقط، مما يعزز دقة المؤشر.
استراتيجية التداول:
الشمعة العاكسة الصعودية: ارسم فيبوناتشي من أعلى سعر إلى أدنى سعر للشمعة العاكسة.
مستويات جني الأرباح (TP): يتم تحديدها عند مستويات فيبوناتشي 1.618، 2.618، و 3.618.
وقف الخسارة (SL): يتم تحديدها عند مستوى فيبوناتشي 0.
الشمعة العاكسة الهبوطية: ارسم فيبوناتشي من أدنى سعر إلى أعلى سعر للشمعة العاكسة.
مستويات جني الأرباح (TP): يتم تحديدها عند مستويات فيبوناتشي 1.618، 2.618، و 3.618.
وقف الخسارة (SL): يتم تحديدها عند مستوى فيبوناتشي 0.
Candle Patterns with Volume ValidationHey Guys !
█ This indicator shows validated Hammer and Shooting Star candle patterns based on volume.
This indicator identifies Hammer and Shooting Star patterns and validates them using volume analysis.
Hammer and Shooting Star patterns are candlestick patterns that signal potential reversals in the market.
█ Usages:
A hammer is formed when in a session, the price has fallen, only to reverse and recover to close back near the opening price. This is a sign of strength with the selling having been absorbed in sufficient strength for the buyers to overwhelm the sellers, allowing the market to recover. The hammer is so called as it is ‘hammering out a bottom’, and just like the shooting star, is immensely powerful when combined with Volume Price Analysis (VPA).
The shooting star is a bearish reversal pattern that appears at the top of uptrends. It signifies that prices have peaked and a downward reversal is likely. The presence of high volume strengthens this signal, indicating that the insiders are offloading their positions.
When combined with volume analysis, these patterns become powerful signals. The volume provides context to the price action, helping traders confirm the validity of the pattern. For example, a hammer with high volume suggests strong buying interest, whereas a shooting star with high volume indicates strong selling pressure.
█ Features:
• Detects Hammer and Shooting Star patterns.
• Validates patterns with volume thresholds.
• Color codes patterns based on volume validation.
• Allows customization of volume thresholds and pattern criteria.
• Option to show or hide signals.
█ Parameters:
• Volume Average Period: The period used to calculate the average volume.
• Higher Volume Multiplier: Multiplier to define higher volume threshold.
• Much Higher Volume Multiplier: Multiplier to define much higher volume threshold.
• Enormous Volume Multiplier: Multiplier to define enormous volume threshold.
• Body/Shadow Ratio for Hammer and Shooting Star: Ratio of body to shadow for pattern validation.
• Upper Shadow Limit for Hammer: Upper shadow limit for Hammer pattern.
• Lower Shadow Limit for Shooting Star: Lower shadow limit for Shooting Star pattern.
• Show Hammer Signals: Display signals for Hammer patterns.
• Show Shooting Star Signals: Display signals for Shooting Star patterns.
Enjoy !
Candlestick Structure [LuxAlgo]The Candlestick Structure indicator detects major market trends and displays various candlestick patterns aligning with the detected trend, filtering out potentially unwanted patterns as a result. Multiple trend detection methods are included and can be selected by the users.
A dashboard showing the alignment percentage of each individual pattern is also provided.
🔶 USAGE
By distinguishing major and minor trend detection, we can still detect patterns based on minor trends, yet filter out the patterns that do not align with the major trend.
By detecting candlestick patterns that align with a major trend, we can effectively detect the ending points of retracements, potentially providing various entry points of interest within a trend.
Users are able to track the alignment of each candlestick pattern in the dashboard to reveal which patterns typically align with the trend and which may not.
Note: Alignment % only checks if the pattern's direction is the same as the current trend direction. These are only raw readings and not any type of confidence score.
🔶 DETAILS
In this indicator, we are identifying and tracking 16 different Candlestick Patterns.
🔹 Bullish Patterns
Hammer: Identified by a small upper wick (or no upper wick) with a small body, and an elongated lower wick whose length is 2X greater than the candle body’s width.
Inverted Hammer: Identified by a small lower wick (or no lower wick) with a small body, and an elongated upper wick whose length is 2X greater than the candle body’s width.
Bullish Engulfing: A 2 bar pattern identified by a large bullish candle body fully encapsulating (opening lower and closing higher) the previous small (bearish) candle body.
Rising 3: A 5 bar pattern identified by an initial full-bodied bullish candle, followed by 3 bearish candles that trade within the high and low of the initial candle, followed by another full-bodied bullish candle closing above the high of the initial candle.
3 White Soldiers: Identified by 3 full-bodied bullish candles, each opening within the body and closing below the high, of the previous candle.
Morning Star: A 3 bar pattern identified by a full-bodied bearish candle, followed by a small-bodied bearish candle, followed by a full-bodied bullish candle that closes above the halfway point of the first candle.
Bullish Harami: A 2 bar pattern, identified by an initial bearish candle, followed by a small bullish candle whose range is entirely contained within the body of the initial candle.
Tweezer Bottom: A 2 bar pattern identified by an initial bearish candle, followed by a bullish candle, both having equal lows.
🔹 Bearish Patterns
Hanging Man: Identified by a small upper wick (or no upper wick) with a small body, and an elongated lower wick whose length is 2X greater than the candle body’s width.
Shooting Star: Identified by a small lower wick (or no lower wick) with a small body, and an elongated upper wick whose length is 2X greater than the candle body’s width.
Bearish Engulfing: A 2 bar pattern identified by a large bearish candle body fully encapsulating (opening higher and closing lower) the previous small (bullish) candle body.
Falling 3: A 5 bar pattern identified by an initial full-bodied bearish candle, followed by 3 bullish candles that trade within the high and low of the initial candle, followed by another full-bodied bearish candle closing below the low of the initial candle.
3 Black Crows: Identified by 3 full-bodied bearish candles, each open within the body and closing below the low, of the previous candle.
Evening Star: A 3 bar pattern identified by a full-bodied bullish candle, followed by a small-bodied bullish candle, followed by a full-bodied bearish candle that closes below the halfway point of the first candle.
Bearish Harami: A 2 bar pattern, identified by an initial bullish candle, followed by a small bearish candle whose range is entirely contained within the body of the initial candle.
Tweezer Top: A 2 bar pattern identified by an initial bullish candle, followed by a bearish candle, both having equal highs.
🔹 Trend Types
Major trend is displayed at all times, the display will change depending on the trend method selected.
The minor trend can also be visualized; to avoid confusion, the minor trend can optionally be displayed through the candle colors.
Supertrend: Displays Upper and Lower SuperTrend, When we break above the upper, it is considered an Uptrend. When we break below the lower, it is considered a Downtrend.
EMAs: Displays Fast and Slow EMAs, When Fast>Slow, it is considered an Uptrend. When Fast

Relative Equal Highs/LowsThis Pine script indicator is designed to create a visual representation of the relative equal highs & lows formed and automatically removed mitigated ones. Unlike indicators designed to show exact equal high/lows this indicator allows a small, configurable degree of variance between price to identify areas where price stops.
Relevance:
Relative Equal highs and lows can serve as valuable tools in identifying potential shifts in trend direction. They come into play when the price hits a support or resistance level and can’t advance further, signaling a possible reversal or pivot point. When the price sufficiently retreats from these levels, relative equal highs and lows can also indicate liquidity draws where buy/sell stops might be positioned, in accordance with SMC/ICT concepts.
How It Works:
The indicator tracks all unmitigated highs & lows within the chart’s present timeframe, limited to the user-defined max bars lookback for optimal performance. If the prices are within the configured variance they are marked as relatively equal and at that point are visually identified by a horizontal line, which connects the two (or more) points of price. Depending on configuration of the indicator, a line is rendered from the 1st, last or both values within the relatively equal range of price. A unique feature of this indicator is its ability to remove the line once the price mitigates the relative equal high/low by falling below the lows or rising above highs. This ensures the chart remains uncluttered and highlights only the currently relevant levels, setting it apart from other indicators providing similar functionality.
Configurability:
The indicator offers five style settings for complete customization of the lines that represent equal highs/lows. These settings include line style, color, and width, along with an option to extend the lines to the right of the chart for enhanced visibility of equal high/low levels. To optimize performance, the indicator allows users to configure the lookback length, determining how far back the price history should be examined. In most instances, the default setting of 500 bars proves more than adequate. Additionally, you can set thresholds via separate configs for stocks & indices that will determine if the price is relatively equal and lastly allow you to configure where the indicator line should be drawn, the first, last or all the values.
Additional notes:
This uses a different approach then my “equal highs/lows” indicator to identify price levels and because it focuses specifically on relative as opposed to exact values it is entirely different and may show “weaker”, but still important levels of liquidity. This indicator is more suited for analysis of stocks and indices or higher-timeframes where price-action rarely forms exact equal values instead more frequently forming almost equal values. My other indicator is more suited for smaller (15m or less) timeframe on indices where exact equal prices are often identical. Depending on situation different indicators should be used.

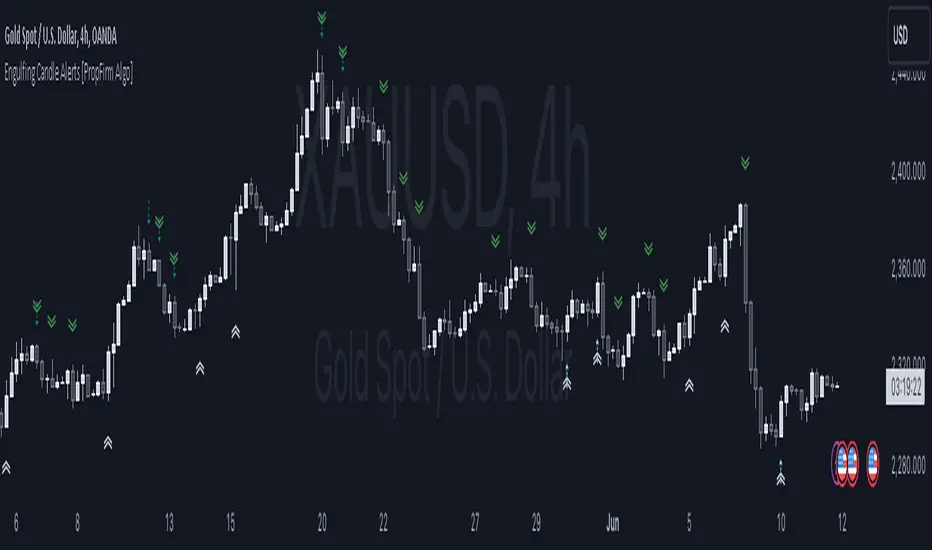
Engulfing Pattern Alerts By PropFirm AlgoWe have now decided to make this indicator to support the trading community! If you find yourself struggling to identify bullish engulfing and bearish engulfing candles, this one is for you.
Release Notes:
Initial release with robust detection of bullish and bearish engulfing patterns.
Added trend and volume filters for enhanced pattern accuracy.
Custom alerts for real-time notifications of potential trading opportunities.
Appendix 1 - Example Case of Use For Educational Study.
Appendix 2 - Technical description which focuses on explaining the functionality of the script, how the code works, and how it can be used by traders, providing further immediate insight value.
Appendix 1:
This indicator will provide you with Two types Bullish and Bearish Engulfing Alerts.
The Regular Bullish and Bearish Engulfing Candle's Shown As
Bullish Engulfing ︽
Bearish Engulfing ︾
And the Filtered Bullish and Bearish Engulfing Candle Shown As
Filtered Bullish Engulfing ⇡
Filtered Bearish Engulfing ⇣
You can also change the Alert Symbol to any text, symbol or emoji of choice in the Setting Style Panel . This allows you to customize the alert symbol style to your liking, Example....
Using the power of artificial intelligence, we coded this indicator based on technical descriptions to perfect this simple problem.
Use this tool together with different strategies as a confirmation to your trading bias.
Use Supply and Demand Zones together with the Engulfing Pattern Alerts
First, Verify if the bullish engulfing candle is at the end of a dying trend.
Secondly, Check if it’s at a major 1-hour, 4-hour, or daily support and resistance zone.
Then wait for the retest, then enter a position.
DON’T USE THE ENGULFING ALERT AS A POINT OF ENTRY, OR WHILE MARKETS ARE CONSOLIDATING nor in the middle of an active trend.
Now for the second most used method:
Use The Fibonacci together with the Engulfing Pattern Alerts
First, Identify an impulse candle that creates a new trend in the market.
Then Draw out your Fibonacci tool from the start of the candle to the end of the impulse leg where rejection is shown.
Wait for the price to retrace to the 61.8 retracement and use the engulfing candle as a second confirmation.
And lastly, wait for the price to retest the fib level showing signs of rejection, then enter.
Appendix 2:
Technical Description:
The "Engulfing Pattern Alerts By PropFirm Algo" script is a sophisticated tool designed to identify and alert traders of potential bullish and bearish engulfing patterns in the market, enhanced by trend and volume filters for improved accuracy. This script helps traders spot potential trend reversals by analyzing candlestick patterns in conjunction with volume data and moving averages.
Key Features:
Bullish Engulfing Pattern Detection: Identifies when a smaller bearish candle is followed by a larger bullish candle, indicating potential upward price movement.
Bearish Engulfing Pattern Detection: Identifies when a smaller bullish candle is followed by a larger bearish candle, indicating potential downward price movement.
Volume Filter: Enhances pattern reliability by ensuring the identified pattern is accompanied by a significant volume increase.
Trend Filter: Utilizes Simple Moving Averages (SMA) to filter patterns based on the prevailing market trend, reducing false signals on the "Filtered Engulfing Alerts" Setting.
Custom Alerts: Configurable alerts for both bullish and bearish engulfing patterns, allowing traders to stay informed in real-time.
How It Works:
Bullish Engulfing Pattern:
Detected when the body of the current candle completely engulfs the body of the previous candle.
Confirmed if the current candle closes higher than it opens, and the previous candle closes lower than it opens.
Volume on the current candle must be greater than the previous candle.
Bearish Engulfing Pattern:
Detected when the body of the current candle completely engulfs the body of the previous candle.
Confirmed if the current candle closes lower than it opens, and the previous candle closes higher than it opens.
Volume on the current candle must be greater than the previous candle.
Trend Filter:
Uses moving averages to determine the market trend.
Bullish patterns are only considered in downtrends.
Bearish patterns are only considered in uptrends.
Alerts:
Alerts can be set up for both bullish and bearish patterns, ensuring you are notified when significant market movements are detected.
How to Use:
Add the script to your chart.
Configure the alert settings according to your trading preferences.
Monitor your chart for plotted symbols indicating potential bullish (︽) and bearish (︾) engulfing patterns.
Utilize the alert conditions to get notified when these patterns occur.
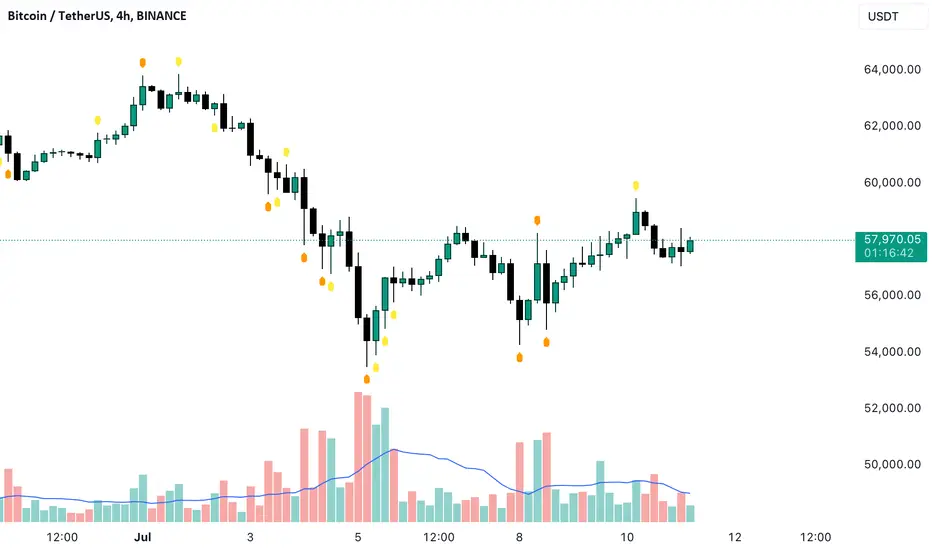
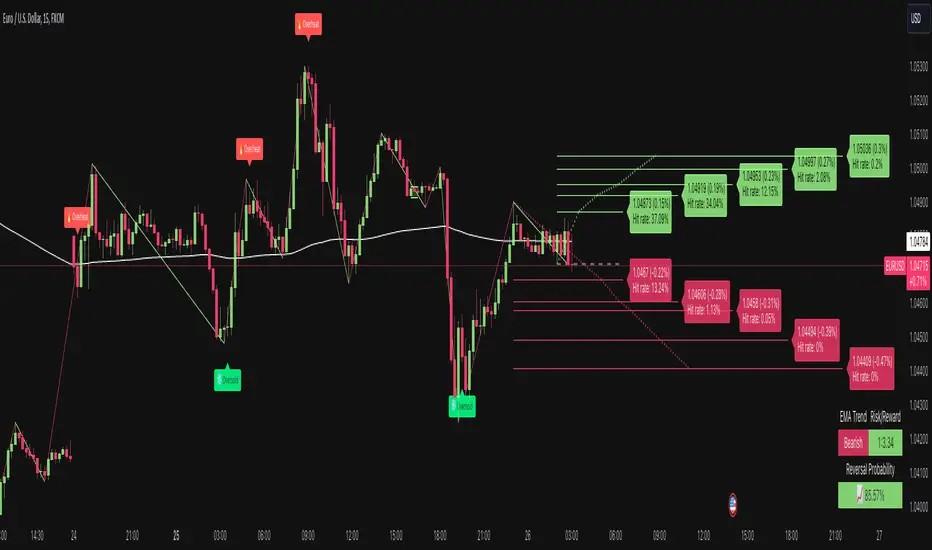
Price Reversal Probability + Price Forecast [TradeDots]The TradeDots Price Reversal Probability + Price Forecast Indicator helps traders discern market direction and identify potential trading opportunities.
📝 HOW IT WORKS
The indicator provides two types of reversal signals:
Bullish Reversal: Marked with a green label, indicating an expected upward market reversal.
Bearish Reversal: Marked with a red label, indicating an expected downward market reversal.
⭐️ Computation
This tool identifies significant reversal patterns using a mathematical model on a designated window of candlesticks to calculate price action changes. It incorporates candlestick data and price indicators, such as the Open, Close, High, Low of candlesticks and Average True Range (ATR), to detect similar occurrences in real-time.
Potential market turning points are marked with reversal labels and percentage changes , calculated using pivot high or low price data from the last reversal patterns of the opposite side.
For example, a green label on the chart indicates a bullish reversal pattern, showing the market is expected to reverse upward. However, signals are based on historical price actions and are not 100% accurate. If the price breaks down from the bullish reversal pivot low, the original signal will turn half transparent until the next reversal pattern is detected.
The algorithm groups consecutive bullish reversal patterns until a bearish reversal pattern appears. The last bullish label occurrence indicates the maximum number of bullish patterns required to confirm a reversal in the group. This information is stored to apply Bayesian statistical models and probability models to generate market insights.
⭐️ Statistical Analysis
Reversal signals are categorized into bullish and bearish groups, with each group storing consecutive reversal signals.
In the indicator table, each new reversal is labeled sequentially (e.g., "🟢 #1" for the first bullish reversal after a bearish signal). The number increases for each new signal on the same side and resets when a reversal signal on the opposite side appears.
The indicator provides two forecasts: the probability of reversal and the expected price change if the pattern is successful or unsuccessful.
⭐️ Probability of Reversal
By counting the number of consecutive reversal patterns on one side before a reversal pattern on the opposite side appears, we can calculate the probability of reversal of each signal throughout the entire price action history.
Using Bayes’ Theorem, the probability increases with each consecutive pattern. The values are displayed in the first two columns of the indicator table, with the current condition highlighted in orange.
⭐️ Price Forecast
The price forecast uses the pivot point of the last reversal pattern of the opposite side as a reference for calculating the percentage change.
For example, for a group of bullish patterns, the pivot high of the most recent bearish pattern is taken. A percentage is calculated with the pivot low of all bullish patterns in the same group. Repeating this model throughout the entire historical price action patterns gives the average price percentage difference between all bearish and bullish patterns.
Whenever a new reversal pattern is detected, a price can be forecasted using the percentage difference from the statistical model. The target price is calculated and displayed in the third and fourth columns of the indicator table.
Assisting Traders To Make Data-Informed Trading Decisions
All included features in this indicator:
Labeling of bullish and bearish reversal patterns
Success probability of each reversal pattern
Price targets of each reversal pattern
Visual aid for pattern confirmation
More (check the changelog below for current features)
🛠️ HOW TO USE
⭐️ Reversal Signals
There are two types of reversal signals identified by the algorithm that detects reversal patterns using price action analysis with candlestick data and price indicators. When the price breaks out from the labeled pivot, the label will turn half transparent.
Bullish reversal signals: Labeled in green. The number represents the price of the candlestick "low," and the percentage value indicates the price difference from the previous bearish reversal pattern's candlestick "high."
Bearish reversal signals: Labeled in red. The number represents the price of the candlestick "high," and the percentage value indicates the price difference from the previous bullish reversal pattern's candlestick "low."
⭐️ Probability Table
The probability table shows the likelihood of reversal for each number of occurrences of bullish and bearish reversal signals, displayed in the first two columns.
It also shows the target prices for both bullish and bearish conditions for each number of reversal patterns.
⭐️ Price Targets
By combining the probability of reversal and the price forecast, price targets for new reversal patterns are calculated. These insights help traders align their strategies with price action analysis and statistics by simply observing the candlestick chart in real-time.
Bullish Price Target: The average percentage price and probability that the next bearish reversal signal might hit.
Bearish Price Target: The average percentage price and probability that the next bullish reversal signal might hit.
⭐️ Market Trend Panel
The market trend panel is a small table that indicates the market trend using a 200 Exponential Moving Average (EMA) alongside reversal signals. A bullish reversal pattern above the moving average indicates a "bullish" market, while a bearish reversal pattern below it indicates a "bearish" market. If the price fluctuates around the moving average, it is identified as "choppy."
The panel also shows the risk and reward for each trade by taking the closing bullish and bearish targets from the most recent reversal pattern's price reference. Lastly, it displays the probability of reversal, consistent with the number highlighted in the probability table.
⭐️ Other Visual Aid
Other visual aids visualize the market trend and potential direction for users on the candlestick chart.
Background colors reflect the current market trend (green = bullish, red = bearish, blue = choppy).
A white plotted line represents the moving average for categorizing market trends.
❗️LIMITATIONS
Price targets represent only the mean of percentage differences. Therefore, the price could reverse before hitting either side of the price target.
When the market is in extreme price action or a new market pattern, the price targets may not be forecasted accurately and might move out of the model's range.
This model works best for assets with less price variation and a near-Gaussian distribution in returns. It may be less accurate for assets with random price movements.
CONCLUSION
This indicator uses fundamental statistics and mathematical models to generate reversal probabilities and price forecasts. It does not have the ability to predict the future with certainty. Traders should combine this indicator with other confirmation strategies to make informed investment decisions.
See Author's instructions below to get instant access to this indicator.
RISK DISCLAIMER
Trading entails substantial risk, and most day traders incur losses. All content, tools, scripts, articles, and education provided by TradeDots serve purely informational and educational purposes. Past performances are not definitive predictors of future results.
NOTES*
Calculations are based on historical data and do not guarantee future results.
Reversals exceeding ten consecutive occurrences are rare (likely <1% of total occurrences).
Users SHOULD NOT blindly follow the price targets as their trading strategy.
If you encounter a timeout with this indicator, reapply it to your chart.
EngulfScanEngulf Scan
Introduction:
The Engulf Scan indicator helps users identify bullish and bearish engulfing candlestick patterns on their charts. These patterns are often used as signals for trend reversals and are important indicators for traders. Engulf Scan signals are generated when an engulfing pattern is swallowed by another candlestick of the opposite color.The signal of a candle engulfment formation is generated when the 1st candle is engulfed by the 2nd candle and the 2nd candle is engulfed by the 3rd candle.
Features:
Bullish Engulfing Pattern: Indicates the start of an upward trend and typically signals that the market is likely to move higher.
Bearish Engulfing Pattern: Indicates the start of a downward trend and typically signals that the market is likely to move lower.
Color Coding: Users can customize the background colors for bullish and bearish engulfing patterns.
Usage Guide:
Adding the Indicator: Add the "Engulf Scan" indicator to your TradingView chart.
Color Settings: Choose your preferred colors for bullish and bearish engulfing patterns from the indicator settings.
Pattern Detection: View the engulfing patterns on the chart with the specified colors and symbols. These patterns help identify potential trend reversal points.
Parameters and Settings:
Bullish Engulfing Color: Background color for the bullish engulfing pattern.( Green)
Bearish Engulfing Color: Background color for the bearish engulfing pattern. (Red)
Examples:
Bullish Engulfing Example: On the chart below, you can see bullish engulfing patterns highlighted with a green background. (Green)
Bearish Engulfing Example: On the chart below, you can see bearish engulfing patterns highlighted with a red background. (Red)
Frequently Asked Questions (FAQ):
How are engulfing patterns detected?
Engulfing patterns are formed when a candlestick completely engulfs the previous candlestick. For a bullish engulfing pattern, a bullish candlestick follows a bearish one. For a bearish engulfing pattern, a bearish candlestick follows a bullish one.
Which timeframes work best with this indicator?
Engulfing patterns are generally more reliable on daily and higher timeframes, but you can test the indicator on different timeframes to see if it fits your trading strategy.
Can I detect a reversal or trend?
As can be seen in the image, it sometimes appears as a return signal and sometimes as a harbinger of an ongoing trend.But it may be a mistake to use the indicator only for these purposes. However, this indicator may not be sufficient when used alone. It can be combined with different indicators from the Tradingview library.
Updates and Changelog:
v1.0: Initial release. Added detection and color coding for bullish and bearish engulfing patterns.
-Please feel free to write your valuable comments and opinions. I attach importance to your valuable opinions so that I can improve myself.

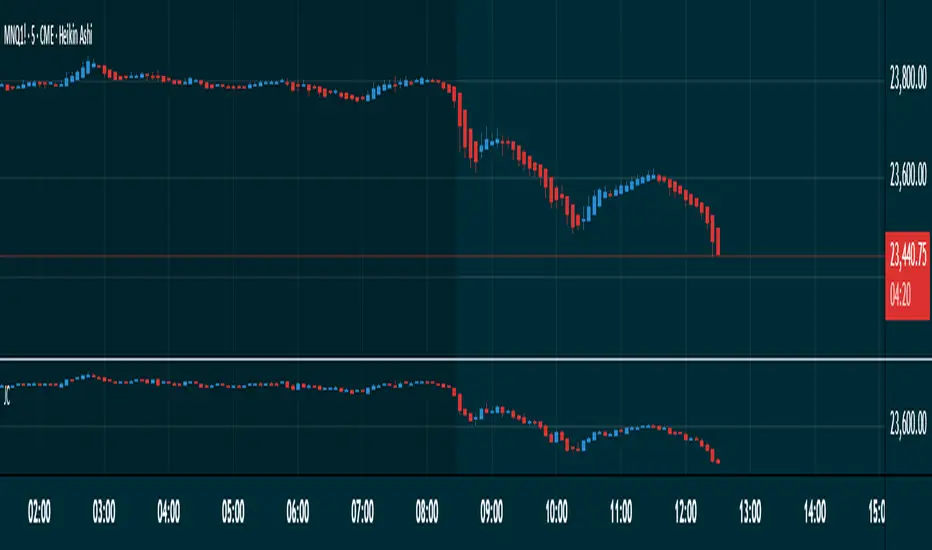
Japanese CandlesSimple script to add standard Japanese candles in a new pane for use when using a non-standard chart (Ex: Heikin Ashi) that doesn't use true OHLC values in it's calculation so that you can still monitor true values and activity without having to take up the screen real estate that using a layout containing a whole new chart would require. This also makes horizontal sync of the main chart to the Japanese candle chart perfect at all times.
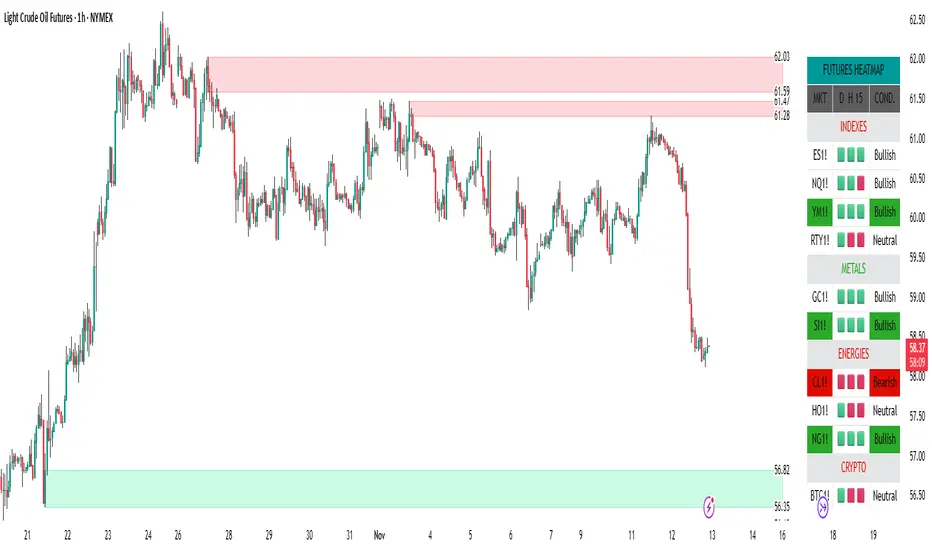
Supply & Demand Trade Analyzer by NYTCSupply and Demand Trade Analyzer
Automatic Zone Identification
• Identifies high quality supply and demand zones on multiple timeframes
• Shows the prices for each zone so the user may easily identify actionable prices to buy or sell
• Once a zone is no longer valid, it is automatically removed from the chart to keep the workspace clean.
• Includes all 4 zone formations: DBR, RBR, RBD and DBD
What are supply and demand zones?
Supply and demand zones are visual representations of areas where there has been a price imbalance. Whenever a demand imbalance is detected, the indicator will plot a green demand zone which may be used as an area to buy under the right market conditions, such as an uptrend or to take profit on a short position. Also, whenever a supply imbalance is detected, the indicator will plot a red supply zone which may be used as an area to sell under the right conditions such as a downtrend or to take profit on a long position.
Automatic Trend Analysis
Proper trend analysis is one of the most important steps in successfully trading or investing in the financial markets as it helps the trader determine which side of the market, he/she wants to take: long or short. For this reason, we decided to also include in this indicator our unique trend analysis technique that utilizes highs and lows to detect when trends begin, how they continue and when they end. The indicator is able properly identify uptrends (Higher Highs and Higher Lows), downtrend (Lower Highs and Lower Lows), and sideways trends (relatively equal highs and lows, higher highs but lower lows or lower highs but higher lows).
• The trader can toggle this feature on or off as needed.
• Our unique trend indicator is located at the bottom of the chart so, as not to interfere with the candles and hide important information.
• When the indicator shows green, the trend is up, when it shows red, the trend is down and sideways when the indicator shows grey.
How it works
Being that supply and demand zones are areas of potential imbalance, under the right conditions price may reverse at these zones. Use them in conjunction with your entry and exit rules to maximize efficacy and minimize risk.
User Inputs
In the settings menu you will find the following functions:
• Zone Count: Allows the trader to determine how many zones are shown on the chart
• Zone-on-Zone: Give the trader the option to also see overlapping zones
• Minor Zones: While the indicator plots major zones by default, this function gives the trader to see all zones in real time as they are being formed.
• HTF Trend: Give the trader the option to turn on our unique trend identification tool
• LTF Momentum: Allows the trader to toggle on or off our unique lower timeframe momentum finder. This tool is best used during the Globex of the Futures session for short-term trading (scalping)
Instruments
Our Trade Analyzer works across all asset classes and on all instruments, including:
Stocks
Futures
Forex
Cryptocurrencies
Summary
The Supply and Demand Trade Analyzer offers traders a quick and easy way of identifying supply and demand or support and resistance areas on a chart. It provides:
• Zone Identification: Proper zone identification on multiple timeframes
• User-Friendly Customization: With a variety of user inputs, you can tailor the analyzer to fit your unique trading strategy.
• Cross-Asset Compatibility: Works seamlessly across all major asset classes and instruments.
• Clean Workspace: Automatic removal of invalid zones keeps your chart organized and focused on the most relevant information.
• Real-Time Insights: Stay ahead of the market with real-time zone plotting and trend analysis, enabling timely and strategic trades.
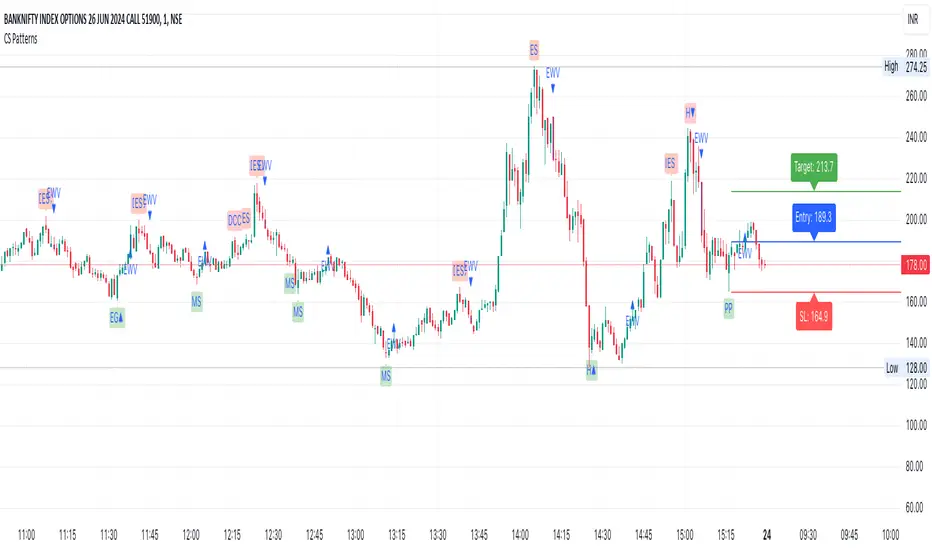
CS PatternsOverview
The CS Patterns indicator is designed to identify and highlight various candlestick patterns on a trading chart. Candlestick patterns are a crucial tool for traders as they help in predicting market movements and potential reversals. This indicator includes single, double, and triple candlestick patterns without revealing the source code, making it an ideal tool for traders who want to utilize advanced pattern recognition while keeping the script proprietary.
Candlestick Patterns Included
Single Candlestick Patterns
Bullish Hammer:
Found at the bottom of a downtrend.
Features a small body, long lower shadow, and little to no upper shadow.
Indicates potential reversal to an uptrend.
Bearish Hanging Man:
Found at the top of an uptrend.
Similar structure to the Bullish Hammer but indicates a potential reversal to a downtrend.
Bullish Inverted Hammer:
Found at the bottom of a downtrend.
Features a small body, long upper shadow, and little to no lower shadow.
Suggests a potential reversal to an uptrend.
Bearish Shooting Star:
Found at the top of an uptrend.
Indicates a potential reversal to a downtrend.
Dragonfly Doji:
Small or non-existent upper shadow and long lower shadow.
Indicates a potential reversal when found at the bottom of a trend.
Gravestone Doji:
Long upper shadow and small or non-existent lower shadow.
Indicates a potential reversal when found at the top of a trend.
Standard Doji:
Very small body, indicates indecision in the market.
Can signal reversals when found at the tops or bottoms of trends.
Long-Legged Doji:
Long upper and lower shadows with a small body.
Indicates a potential market reversal.
Double Candlestick Patterns
Bullish Engulfing:
A smaller bearish candle followed by a larger bullish candle that engulfs it.
Indicates a potential reversal to an uptrend.
Bearish Engulfing:
A smaller bullish candle followed by a larger bearish candle that engulfs it.
Indicates a potential reversal to a downtrend.
Bullish Harami:
A large bearish candle followed by a smaller bullish candle within its range.
Indicates a potential reversal to an uptrend.
Bearish Harami:
A large bullish candle followed by a smaller bearish candle within its range.
Indicates a potential reversal to a downtrend.
Bullish Piercing Line:
A bearish candle followed by a bullish candle that closes above the midpoint of the previous candle.
Indicates a potential reversal to an uptrend.
Bearish Dark Cloud Cover:
A bullish candle followed by a bearish candle that closes below the midpoint of the previous candle.
Indicates a potential reversal to a downtrend.
Bullish Inside Bar:
A smaller bullish or bearish candle completely within the range of the previous bearish candle.
Indicates a potential continuation or reversal to an uptrend.
Bearish Inside Bar:
A smaller bullish or bearish candle completely within the range of the previous bullish candle.
Indicates a potential continuation or reversal to a downtrend.
Triple Candlestick Patterns
Bullish Morning Star:
A bearish candle followed by a smaller-bodied candle (bullish or bearish), and then a larger bullish candle.
Indicates a potential reversal to an uptrend.
Bearish Evening Star:
A bullish candle followed by a smaller-bodied candle (bullish or bearish), and then a larger bearish candle.
Indicates a potential reversal to a downtrend.
How to Use?
Adding the Indicator:
Open TradingView and go to the Pine Script Editor.
Copy and paste the provided code into a new script.
Save and add the script to your chart.
Interpreting the Signals:
The indicator will highlight the patterns on the chart with specific labels.
Use these visual cues to make informed trading decisions based on potential reversals or continuations indicated by the patterns.
Customizing the Settings:
The indicator allows for customization of various settings through input options.
Adjust these settings according to your trading strategy and preferences.
Reversal Candlestick Structure [LuxAlgo]The Reversal Candlestick Structure indicator detects multiple candlestick patterns occurring when trends are most likely to experience a reversal in real-time. The reversal detection method includes various settings allowing users to adjust the reversal detection algorithm more precisely.
A dashboard showing the percentage of patterns detected as reversals is also included.
🔶 USAGE
Candlestick patterns are ubiquitous to technical analysts, allowing them to detect trend continuations, reversals, and indecision.
The proposed tool effectively detects reversals by using the confluence between candlestick patterns and a reversal detection method based on the stochastic oscillator, acting as a filter for the patterns. If a candlestick pattern occurs while conditions suggest a potential reversal then the pattern is highlighted.
The displayed candle coloring allows users to observe the reversal detection method, with colored candles indicating potential reversals.
Users wanting to detect longer-term reversals can use a higher "Trend Length" setting, this can however lead to an increased amount of displayed candlestick patterns.
To prevent false positives users also have control over a "Threshold" setting in a range between (0, 100), with values closer to 100 preventing candlesticks from being detected at the start of trends.
The "Warmup Length" serves a similar purpose, and aims to prevent sudden moves to be classified as reversals. Higher values of this setting will require trends to be established for a longer period of time for reversal conditions to be detected.
🔹 Dashboard
To evaluate the role of individual candlestick patterns as potential reversal signals relative to the proposed reversal detection method, a dashboard displaying the percentage of candlestick patterns displayed (that occur when a potential reversal is detected) over the total amount detected.
Hovering on the dashboard cells of the "Reversal %" column allows displaying the total amount of patterns detected.
🔶 CANDLESTICKS PATTERNS
This tool detects 16 popular candlestick patterns, each listed in the sub-sections below.
🔹 Bullish Patterns
Hammer - A bullish reversal pattern that forms after a decline, characterized by a small body at the upper end of the trading range and a long lower shadow.
Inverted Hammer - A bullish reversal pattern that forms after a downtrend, featuring a small body at the lower end of the trading range and a long upper shadow.
Bullish Engulfing - A bullish reversal pattern where a small bearish candlestick is followed by a larger bullish candlestick that completely engulfs the previous candle.
Rising 3 - A bullish continuation pattern that consists of a long bullish candlestick followed by three smaller bearish candlesticks and then another long bullish candlestick.
3 White Soldiers - A bullish reversal pattern consisting of three consecutive long bullish candlesticks, each opening within the previous candle's body and closing higher.
Morning Star - A bullish reversal pattern made up of three candlesticks: a long bearish candlestick, followed by a short candlestick, and then a long bullish candlestick.
Bullish Harami - A bullish reversal pattern where a small bullish candlestick is completely within a previous larger bearish candlestick.
Tweezer Bottom - A bullish reversal pattern identified by an initial bullish candle, followed by a bearish candle, both having equal lows.
🔹 Bearish Patterns
Hanging Man - A bearish reversal pattern that forms after an uptrend, characterized by a small body at the upper end of the trading range and a long lower shadow.
Shooting Star - A bearish reversal pattern that forms after an uptrend, featuring a small body at the lower end of the trading range and a long upper shadow.
Bearish Engulfing - A bearish reversal pattern where a small bullish candlestick is followed by a larger bearish candlestick that completely engulfs the previous candle.
Falling 3 - A bearish continuation pattern that consists of a long bearish candlestick followed by three smaller bullish candlesticks and then another long bearish candlestick.
3 Black Crows - A bearish reversal pattern consisting of three consecutive long bearish candlesticks, each opening within the previous candle's body and closing lower.
Evening Star - A bearish reversal pattern made up of three candlesticks: a long bullish candlestick, followed by a short candlestick, and then a long bearish candlestick.
Bearish Harami - A bearish reversal pattern where a small bearish candlestick is completely within a previous larger bullish candlestick.
Tweezer Top - A bearish reversal pattern is identified by an initial bullish candle, followed by a bearish candle, both having equal highs."
🔶 SETTINGS
🔹 Patterns
Group including toggles for each of the supported candlestick patterns. Enabled toggles will allow detection of the associated candlestick pattern.
🔹 Reversal Detection
Trend Length: Determines the sensitivity of the reversal detection method to shorter-term variation, with higher values returning a detection method more sensitive to longer-term trends.
Threshold: Determines how easy it is for the reversal detection method to consider a trend at an extreme point.
Warmup Length: Warmup period in the reversal detection method, longer values will require a longer-term trend to detect potential reversals.
🔹 Style
Color Candles: Enable candle coloring on the user chart based on the reversal detection method.
Use Gradient: Use a gradient as candle coloring.
Label Size: Size of the labels displaying the detected candlesticks patterns.
🔹 Dashboard
Show Dashboard: Display the dashboard on the user chart when enabled.
Location: Dashboard location on the user chart.
Size: Size of the displayed dashboard.

Indecisive CandlesAn Indecisive Candle, often referred to as a Base Candle, is a pivotal element in technical analysis, particularly for identifying institutional supply and demand zones. These candles are characterized by their small bodies and long wicks, reflecting a balance between buyers and sellers, indicating a potential pause or consolidation in the market.
To calculate whether a candle qualifies as an indecisive candle based on the criterion that its body (the absolute difference between its open and close prices) is less than or equal to 50% of the total range of the candle (the difference between its high and low prices).
Key Features:
Small Real Body: Signifies minimal movement from open to close, indicating market indecision.
Long Upper and Lower Wicks: Show that both bulls and bears attempted to control the price, but neither succeeded, leading to a standoff.
Formation Context: Typically found at the end of a strong trend or within a consolidation phase, hinting at a potential reversal or continuation pattern.
Usage in Identifying Institutional Supply and Demand:
Supply Zones: When an Indecisive Candle forms after a rally, it can mark the onset of an institutional supply zone, suggesting that large entities are starting to sell, leading to potential downward pressure.
Demand Zones: Conversely, when this candle appears after a downtrend, it often signals the emergence of a demand zone, where institutions begin to accumulate, anticipating a price increase.
Trading Strategies:
Zone Identification: Use Indecisive Candles to pinpoint key supply and demand zones on your chart, enhancing the accuracy of your support and resistance levels.
Confirmation: Look for confirmation from subsequent price action or volume spikes to validate the presence of institutional activity before making trading decisions.
Risk Management: Place stop-loss orders beyond the wicks of these candles to protect against false breakouts or continued indecision.
Conclusion:
Indecisive Candles are essential tools for traders looking to understand market sentiment and institutional behavior. By mastering their identification and interpretation, you can enhance your ability to spot high-probability trading opportunities and manage risks effectively.

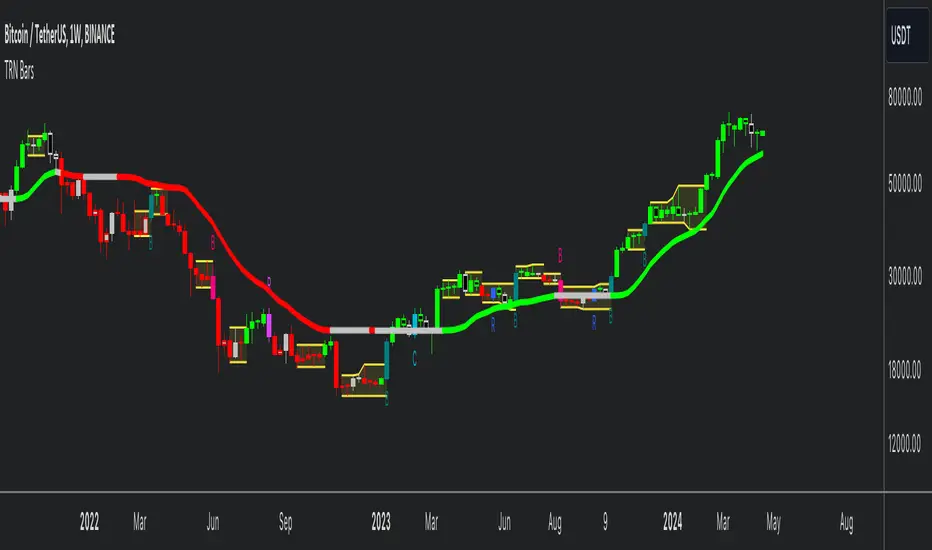
Trend Bars (HTF PO3)Hello Traders!
The innovative TRN Trend Bars are designed to help traders to analyze markets in an intuitive way. The TRN Trend Bars show bullish and bearish trends and reversals based on color coding the bars and give high probability trade opportunities.
How does the Trend Detection work in detail?
The trend analysis is based on a new algorithm that includes several different inputs:
detection of classical and advanced bar patterns
the statistical frequency of these bar patterns and their statistical outcomes are computed based on historical data
probability distributions of price expansions after certain bar patterns
bar information such as wick length in %, overlapping of the previous bar in % and many more
The algorithm weighs these inputs and computes the likelihood of a trend continuation, or a reversal. The likelihood is computed based on statistical information such as occurrence frequency of certain patterns and their historical performance.
The algorithm then outputs a color scheme for the chart bars.
Analyzing the market with the TRN Trend Bar color scheme
Green Bars signify a bullish uptrend. On the other hand, Red Bars indicate a bearish downtrend. The transition from red to green denotes a bullish trend reversal. Conversely, the shift from green to red signals a bearish trend reversal. By monitoring these color changes, traders can identify potential trend reversals and make informed trading decisions.
The presence of gray and black bars indicates a neutral market state, often observed before an impending color change from red to green or green to red. These neutral bars serve as a transition phase between the previous trend and the potential reversal.
How to use TRN Trend Bars for trading?
The TRN Trend Bars are very sensitive. Therefore, they make it easy to find strong short-term trends and pullbacks of the main trend. This can result in high probability entry and exit signals. Here are some trading strategies examples:
Breakouts
After an up breakout of a consolidation or range (or any other chart pattern) you can enter the moment TRN Trend Bars turn green. Alternatively, you wait for a pullback with red bars and enter once a green bar occurs.
Pullbacks
In a trending market you use the TRN Trend Bars for pullback entries. For example, if we are in a strong downtrend and a few green bars occur, then you can enter short once a red bar is displayed.
Exit signals/Trade Management
If you are in a position, you can use the TRN Trend Bars to manage the trade or find good exit points. In case the bar color is not in favor of your position anymore, you can either adjust your stop loss or exit the position completely. E.g. you are in a long position and the bars turn red, then you can either close the trade or tighten your stop loss.
Conclusion
While signals from TRN Trend Bars can be informative, it is important to recognize that their reliability may vary. Various external factors can impact market prices, and it is essential to consider your risk tolerance and investment goals when executing trades.
Risk Disclaimer
The content, tools, scripts, articles, and educational resources offered by TRN Trading are intended solely for informational and educational purposes. Remember, past performance does not ensure future outcomes.

Trend Bars Pro (HTF PO3)Hello Traders!
The innovative TRN Trend Bars Pro are designed to help traders to analyze markets in an intuitive way and provide high probability entry and exit signals. It combines three core concepts:
TRN Trend Bars to see the current trend and reversals (replaces the default chart bars)
Bar Ranges to highlight consolidations
Dynamic Trend to see the overall trend.
First, let's have a look at each of these concepts individually. Afterwards, we describe how a combination of all three gives you a crystal-clear picture of the market.
TRN Trend Bars Pro
They show bullish and bearish trends and reversals based on color coding the bars and give high probability trade opportunities with special colors. The trend analysis is based on a new algorithm that includes several different inputs:
classical and advanced bar patterns and their statistical frequency
probability distributions of price expansions after certain bar patterns
bar information such as wick length in %, overlapping of the previous bar in % and many more
historical trend and consolidation analysis
The algorithm weighs these concepts and outputs a color scheme for the chart bars or candlesticks.
Bar Types
Trend bars in green and red
Reversal Bars in blue and fuchsia
Continuation Bars in turquoise and orange
Breakout Bars in dark green and pink
Green Bars signify a sustained uptrend, indicating bullish market sentiment. On the other hand, Red Bars indicate a persistent downtrend, representing bearish market sentiment. The transition from red to green denotes a bullish trend reversal, suggesting a shift from bearish to bullish sentiment. Conversely, the shift from green to red signals a bearish trend reversal, indicating a transition from bullish to bearish sentiment. By monitoring these color changes, traders can identify potential trend reversals and make informed trading decisions.
The presence of gray and black bars indicates a neutral market state, often observed before an impending color change from red to green or green to red. These neutral bars serve as a transition phase between the previous trend and the potential reversal.
The TRN Trend Bars Pro incorporate signal bars, distinguished by their distinct colors, to offer potential buy and sell signals and deeper insights into market dynamics.
Reversal Bars
The presence of blue Reversal Bars indicates a trend reversal to the upside, while pink Reversal Bars indicate a reversal to the downside. These bars not only serve as signals for potential trend shifts but also present favorable opportunities to enter the market or increase one's position size.
Continuation Bars
In addition to the reversal bars, the indicator also includes bullish continuation bars (colored turquoise) and bearish continuation bars (colored orange). These bars act as signals for the continuation of an existing trend. Like the reversal bars, they can be utilized as entry points or opportunities to augment one's position size.
Breakout Bars
The dark green breakout bars within TRN Trend Bars Pro show a powerful breakout from a price range detected by our integrated bar range feature. They signify the continuation or potential change in a trend following a consolidation phase. As such, these bars hold dual functionality, serving as reversal signals and validating the persistence of an ongoing trend.
Bar Ranges
The bar range feature automatically finds consolidations where the price range of several consecutives bars is rather small. The detection of the bar ranges includes among other things the overlapping percentage of these bars.
How to Use Price Ranges
Here are a few ways you can use the bar ranges in your trading:
Identify Support and Resistance Levels
The price ranges can help you identify key support and resistance levels on a chart. By observing price ranges and identifying these levels, you can make more informed decisions about entering or exiting trades.
Breakout Trading
Price ranges can also provide insights into potential breakout opportunities. Breakouts occur when the price breaks out of a defined range, signaling a potential shift in market sentiment and the start of a new trend. The Color highlighted Breakout Bars from the TRN Trend Bars Pro are signaling a powerful breakout of a price range. Traders can enter positions in the direction of the breakout and set appropriate stop-loss orders to manage risk. Note that not every price range is left by a powerful breakout.
Dynamic Trend
The Dynamic Trend combines elements from standard trend strength indicators (e.g. DI-, DI+, Parabolic SAR) and volatility indicators (e.g. ATR, Standard Deviation). It produces a moving average line that adapts to changing market volatility. It is inspired by the ideas of the programmer and trader Fat Tails. The adaptive behavior provides more relevant information for traders when compared to traditional moving averages which do not consider volatility and trend strength together. This makes the Dynamic Trend completely unique, and no other moving average indicator can give you this precision.
How to use Dynamic Trend
Generally, a rising Dynamic Trend line, displayed in green, indicates that an uptrend is strong, while a falling Dynamic Trend, displayed in red, suggests that the downtrend is sharp. The Dynamic Trend turns gray when there is insufficient clarity to establish a distinct trend and especially when there is not volatility in the market.
Identify potential trade entries and exits: When used in conjunction with price action, the Dynamic Trend can provide potential trade signals. For example, if the price crosses above the Dynamic Trend, it may be a bullish sign, suggesting a potential buy entry. Conversely, if the price crosses below the Dynamic Trend, it may indicate bearish conditions and a potential sell signal.
Trend Identification and Pullback trading
Observe the Dynamic Trend's color. When it's on the rise and appears green, it indicates a bullish trend. Conversely, if it's in decline and displayed in red, it signals a bearish trend.
If Dynamic Trend is green and price pulls from above back to the Dynamic Trend, then this can be considered as a bullish signal.
If Dynamic Trend is red and price pulls from below back to the Dynamic Trend, then this can be considered as a bearish signal.
In the event of a bearish signal, such as a bearish TRN Signal Bar, and the Dynamic Trend is red, it provides additional confirmation to the bearish signal. Likewise, bullish signals gain added conviction when the Dynamic Trend is green.
Crossovers
As with other moving averages, crossovers between the Dynamic Trend and the price can be significant.
If price is crossing above the Dynamic Trend, then this can be considered as a bullish signal.
If price is crossing below the Dynamic Trend, then this can be considered as a bearish signal.
If you currently hold a position, both bullish and bearish crossovers can serve as potential exit signals. For instance, in the case of a long position, a bearish crossover can indicate a potential shift in sentiment, signaling a bearish reversal and a potential opportunity to close your long position.
Filtering Noise
Due to its adaptive nature, the Dynamic Trend can be a useful tool to filter out market noise. When the market is choppy or consolidating, the Dynamic Trend tends to remain flat and colored gray, signaling traders to potentially stay out of the market.
Stop Losses
The Dynamic Trend can also be used as a dynamic stop loss. For instance, in a long trade, traders can use the Dynamic Trend as a trailing stop, selling their position if the price crosses below the Dynamic Trend.
Combining TRN Trend Bars Pro, Bar Ranges and Dynamic Trend together
Combining all three concepts gives you a crystal-clear picture of the market. The Dynamic Trend shows you the overall trend. If price pulls back to the dynamic trend line and then price picks up the trend direction again, then the TRN Trend Bars Pro immediately switches the color to the trend direction. Therefore, you can easily identify high probability entry signals based on the bar color.
As a simple trading model, you can set the stop loss below the last swing or below a TRN signal bar (vice versa for short entries) and use 2.5 R or 3 R as target.
You can increase the success rate of the high probability TRN signal bars entries even more if they are in line with the Dynamic Trend line.
On the other hand, the TRN Bar Ranges help you to stay out of the market in case the price does not really change. As a confluence signal to stay flat in this period the dynamic trend line tends to be grey as well. If the price breaks out of the range, then the indicator prints a breakout bar which serves as a high probability entry signal.
Although it is possible to switch off any of these concepts, it is highly recommended to use all three in combination to get a crystal-clear picture of the market.
Alerts
Experience the power of our TRN Trend Bars Pro alerts, delivering real-time notifications for trend changes, price range breakouts, and signal bar formations or confirmations. Stay on top of the market with these versatile alerts, customizable to your preferred assets and timeframes.
Conclusion
While signals from TRN Trend Bars Pro can be informative, it is important to recognize that their reliability may vary. Various external factors can impact market prices, and it is essential to consider your risk tolerance and investment goals when executing trades.
Risk Disclaimer
The content, tools, scripts, articles, and educational resources offered by TRN Trading are intended solely for informational and educational purposes. Remember, past performance does not ensure future outcomes.

Trend and Reversal ScannerHello Traders!
The TRN Trend and Reversal Scanner highlights in a user-friendly and easy to read table trend and reversal signals from up to 20 assets of your choosing. With it, you can efficiently monitor your preferred instruments simultaneously without jumping from one chart to the next. You will never miss a signal again. The indicator automatically finds swing-based up and down trends, bullish and bearish divergences, detects ranges and range breakouts as well as trend and reversal signals by the built-in trend detection algorithm called TRN Bars. Furthermore, you can conveniently stay updated with real-time alerts, notifying you whenever the scanner finds interesting market situations.
Feature List
Swing-based up and down trend detection
Divergence detection for any given (Custom) Indicator
Price range and breakout detection
Bar trend and reversal detection
Scanner alerts
The value of this indicator is to support traders to easily identify trend-based signals in an automated way and across many different markets at the same time. The trader saves a lot of time scanning the markets for up and down swings, divergences, consolidations and bar pattern-based trends and reversals, since finding and alerting these signals is done automatically for the trader.
For a visualization of the detected signals, you can add the TRN Bars and the Swing Suite indicator to your chart.
How does Trend Scanner work?
On the right side of the chart, you can find a table displaying the symbols monitored by the TRN Trend and Reversal Scanner for signal detection (first column). The table provides information on the status of each symbol. This visual representation allows you to quickly identify evolving signals across different symbols, helping you stay informed and make timely trading decisions.
The scanner operates specifically on the timeframe you are currently viewing, ensuring that the detected signals align precisely with your trading perspective.
In the following, we will describe the different signals displayed in the different columns of the table
Column 1 – Symbols
Column 2 – Bar Trend & Signals
Column 3 – Up & Down Swing Trend
Column 4 – Ranges & Range Breakouts
Column 5 – Bullish Divergences
Column 6 – Bearish Divergences
Bar Trend & Signals
In the second column, you can observe the status of TRN Bars, the built-in trend detection algorithm.
UP – Uptrend
DN – Downtrend
REV (Green) – Bullish Reversal Bar
REV (Red) – Bearish Reversal Bar
CON (Green) – Bullish Continuation Bar
CON (Red) – Bearish Continuation Bar
B/O (Green) – Bullish Range Breakout Bar
B/O (Red) – Bearish Range Breakout Bar
TRN Bars is designed to spot bullish and bearish trends and reversals. The trend analysis is based on a new algorithm that weights several different inputs:
classical and advanced bar patterns and their statistical frequency
probability distributions of price expansions after certain bar patterns
bar information such as wick length in %, overlapping of the previous bar in % and many more
historical trend and consolidation analysis
It provides high-probability trend continuation analysis and reversal detections.
Up and Downtrend
The second column (Trend) indicates whether the price of the asset moves within an uptrend (UP) or a downtrend (DN), as detected by our unique swing detection algorithm, on the selected timeframe.
The swing detection algorithm identifies pivot points (swings) with high accuracy. It works in real-time and does not need a look-a-head to find swings.
Ranges & Range Breakouts
The third column provides insights into the price behavior of a symbol within the selected timeframe, as analyzed by the range feature of the TRN Bars algorithm.
ACTIVE – Price moves within a price range
UP – Breakout detected
DN – Breakdown detected
UP CONF – Breakout confirmed
DN CONF – Breakdown confirmed
The bar range feature automatically finds consolidations where the price range of several consecutives bars is rather small. The detection of the bar ranges includes among other things the overlapping percentage of these bars.
Divergence Detection for any given (Custom) Indicator
The divergence detector finds with unrivaled precision bullish and bearish as well as regular and hidden divergences. The main difference compared to other divergences indicators is that this indicator finds rigorously the extreme peaks of each swing, both in price and in the corresponding indicator. This precision is unmatched and therefore this is one of the best divergences detectors.
The build in divergence detector works with any given indicator, even custom ones. In addition, there are 11 built-in indicators. Most noticeable is the cumulative delta indicator, which works astonishingly well as a divergence indicator. Full list:
External Indicator (see next section for the setup)
Awesome Oscillator (AO)
Commodity Channel Index (CCI)
Cumulative Delta Volume (CDV)
Chaikin Money Flow (CMF)
Moving Average Convergence Divergence (MACD)
Money Flow Index (MFI)
Momentum
On Balance Volume (OBV)
Relative Strength Index (RSI)
Stochastic
Williams Percentage Range (W%R)
Another highlight of the divergence detection is that it works with every indicator, even custom ones. To do this, you must add the (custom) indicator to your chart. Afterwards, simply go to the “Divergence Detection” section in the indicator settings and choose "External Indicator". If the custom indicator has one reference value, then choose this value in the “External Indicator (High)” field. If there are high and low values (e.g. candles), then you also must set the “External Indicator Low” field.
The visualization of the divergence detection is represented in the fifth column (Div Bull) and the sixth and last column (Div Bear).
REG – Regular divergence detected
HID – Hidden divergence detected
Scanner Alerts
You can opt to receive alerts for the following scenarios:
Detected up and down swings
Detected bullish and bearish divergences
Detected bar trend changes
Confirmed Reversal Bars
Confirmed Continuation Bars
Confirmed ange breakouts
The alert function is activated for all symbols listed in the scanner and corresponds to the timeframe of the chart you are currently viewing. This ensures that you receive alerts specifically tailored to the symbols and timeframe you are interested in.
Risk Disclaimer
The content, tools, scripts, articles, and educational resources offered by TRN Trading are intended solely for informational and educational purposes. Remember, past performance does not ensure future outcomes.

Candlestick Reversal and Trend Signals [AlgoAlpha]🚀 Unleash your charting capabilities with the Candlestick Reversal and Trend Signals indicator by AlgoAlpha, your go-to tool for spotting pivotal market movements! This script enhances your trading experience by identifying key candlestick patterns and trend changes, perfect for traders aiming for precision in their technical analysis.
🛠 Key Features:
- 🔄 Multi-Timeframe Analysis : Leverages a timeframe multiplier to analyze levels on higher timeframes, enhancing the depth and applicability of insights.
- 🧩 Diverse Pattern Detection : Capable of detecting a wide array of patterns including Bull/Bear Engulfings, Dojis, Haramis, Piercing Lines, Dark Cloud Covers, and Morning/Evening Stars, each contributing to a robust trading strategy.
- 🔍 Dynamic Trend Filters : Utilizes three exponential moving averages (EMAs) and volume filters to decisively confirm trend directions and strength, providing a clearer picture of market dynamics.
- ⚙️ Customizable Settings : Features adjustable settings for filter period, signal thresholds, and appearance, allowing for a tailored analysis experience to fit individual trading styles.
- 📉 Swing Levels Identification : Marks significant high and low swing points on the chart, highlighting potential pivot points and trend reversals for strategic trading decisions.
📈 Quick Guide to Using the Candlestick Reversal and Trend Signals Indicator
1. 🛠 Add the Indicator : Add the indicator to your favorites. Adjust the settings to match your analysis needs.
2. 📊 Analysis : Keep an eye out for the specific symbols plotted on your chart that indicate various candlestick patterns. Use these signals to enhance your market analysis.
3. 🔔 Set Alerts : Enable alerts for the patterns you are most interested in to get notified of potential trading opportunities without needing to monitor the charts constantly.
Embark on your enhanced trading journey with this powerful tool! 🚀✨ Happy trading!
🧐 How It Works:
The Candlestick Reversal and Trend Signals indicator operates by integrating several candlestick patterns and trend analysis features to assist in making informed trading decisions. Initially, it gathers user-defined settings like the period for filtering, signal thresholds, and the desired patterns to detect. It analyzes candlestick formations such as Bull/Bear Engulfings, Dojis, Haramis, and more, by comparing the current candlestick's attributes (such as body length and direction) with previous data to identify potential market reversals or confirmations. The indicator enhances its accuracy through additional filters like volume ratios and exponential moving averages (EMAs) that help validate the strength and direction of trends. By marking these patterns and trends visually on the chart, it provides clear signals that aid traders in identifying significant market movements efficiently. The script is then complemented with the 3 EMA indicator for trend detection and swing levels for added confluence.

Candlestick Trend Strength [AlgoAlpha]🚀🎉 Introducing the Candlestick Trend Strength by AlgoAlpha, a dynamic TradingView indicator designed to visually communicate the strength and direction of market trends right on your charts! 🕯️💪
Key Features:
🌈 Visual gauge for trend strength, color-coded for intuitive insights.
⏳ Customizable trend detection and normalization periods to match your trading strategy.
🎨 Flexible color settings for both uptrend (green) and downtrend (red).
🔔 Real-time alerts for trend reversals, helping you stay ahead of market moves.
How to Use:
🛠 Add the Indicator: Add the indicator to favorites and customize it to suit your needs.
🔍 Analyze the Trends: Monitor the color changes in the gauge and bar color to identify strengthening or weakening trends.
🔔 Set Alerts: Configure alerts to notify you of trend changes, allowing you to react swiftly to trading opportunities without constant monitoring.
Basic Logic Explained:
The "Candlestick Trend Strength" indicator calculates the trend strength score by analyzing the ratio of the candle's wick to its body, alongside the direction of the candle (up or down). It uses a normalization period to adjust the sum of the trend score into a scale from -1 to 1, which is then plotted as a color gradient gauge from red (downtrend) to green (uptrend) on the chart. This representation helps traders quickly assess whether a trend is gaining or losing strength, and it updates in real-time with each new bar, providing a highly responsive tool for technical analysis.
Embrace the power of visual trend analysis with the "Candlestick Trend Strength" by AlgoAlpha and transform your trading experience today! 🌟📈
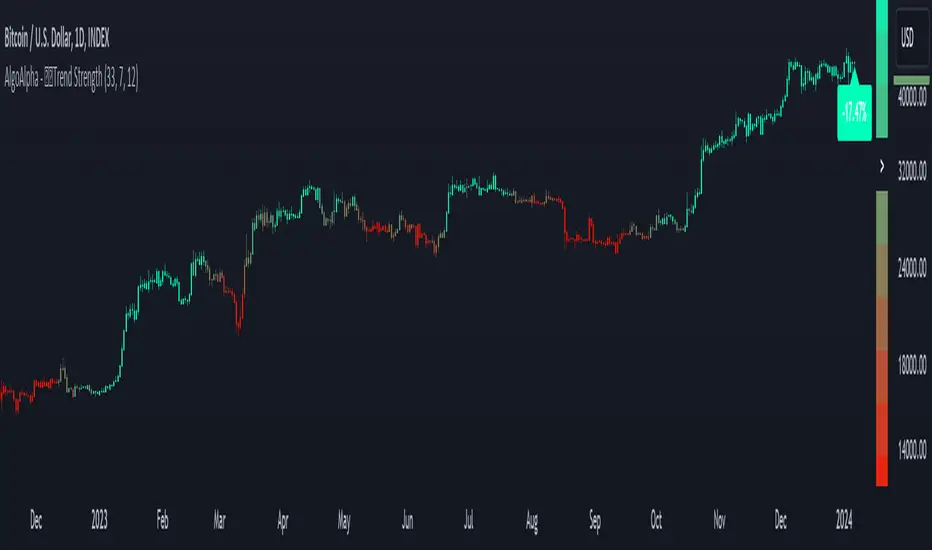
ICT Immediate Rebalance [LuxAlgo]The ICT Immediate Rebalance aims at detecting and highlighting immediate rebalances, a concept taught by Inner Circle Trader. The ICT Immediate Rebalance, although frequently overlooked, emerges as one of ICT's most influential concepts, particularly when considered within a specific context.
🔶 USAGE
Immediate rebalances, a concept taught by ICT, hold significant importance in decision-making. To comprehend the concept of immediate rebalance, it's essential to grasp the notion of the fair value gap. A fair value gap arises from market inefficiencies or imbalances, whereas an immediate rebalance leaves no gap, no inefficiencies, or no imbalances that the price would need to return to.
Following an immediate rebalance, the typical expectation is for two extension candles to ensue; failing this, the immediate rebalance is deemed unsuccessful. It's important to note that both failed and successful immediate rebalances hold significance in trading when analyzed within a contextual framework.
Immediate rebalances can manifest across various locations and timeframes. It's recommended to analyze them in conjunction with other ICT tools or technical indicators to gain a more comprehensive understanding of market dynamics.
🔹 Multi Timeframe
The script facilitates multi-timeframe analysis, enabling users to display immediate rebalances from higher timeframes.
Enabling the display of higher timeframe candles helps visualize the detected immediate rebalance patterns.
🔹 Dashboard
The dashboard offers statistical insights into immediate rebalances.
🔶 SETTINGS
🔹 Immediate Rebalances
Timeframe: this option is to identify immediate rebalances from higher timeframes. If a timeframe lower than the chart's timeframe is selected, calculations will be based on the chart's timeframe.
Bullish, and Bearish Immediate Rebalances: color customization options.
Wicks 75%, %50, and %25: color customization options of the wick price levels for the detected immediate rebalances.
Immediate Rebalance Candles: toggles the visualization of higher timeframe candles where immediate rebalance is detected.
Confirmation (Bars): specifies the number of bars required to confirm the validation of the detected immediate rebalance.
Immediate Rebalance Icon: allows customization of the size of the icon used to represent the immediate rebalance.
🔹 Dashboard
Dashboard: toggles the visualization of the dashboard, sets its location, and customizes the size of the dashboard.
🔶 RELATED SCRIPTS
Fair-Value-Gap
Thanks to our community for recommending this script. For more conceptual scripts and related content, we welcome you to explore by visiting >>> LuxAlgo-Scripts .

TRN BarsThe innovative TRN Bars are designed to help traders to analyze markets in an intuitive way. It combines three core concepts:
TRN Bars to see the current trend and reversals (replaces the default chart bars)
Bar Ranges to highlight consolidations
Dynamic Trend to see the overall trend.
First, let's have a look at each of these concepts individually. Afterwards, we describe how a combination of all three gives you a crystal-clear picture of the market.
TRN Bars
They show bullish and bearish trends and reversals based on color coding the bars and give high probability trade opportunities with special colors. The trend analysis is based on a new algorithm that includes several different inputs:
classical and advanced bar patterns and their statistical frequency
probability distributions of price expansions after certain bar patterns
bar information such as wick length in %, overlapping of the previous bar in % and many more
historical trend and consolidation analysis
The algorithm weighs these concepts and outputs a color scheme for the chart bars or candlesticks.
Bar Types
Trend bars in green and red
Reversal Bars in blue and fuchsia
Continuation Bars in turquoise and orange
Breakout Bars in dark green and pink
Green Bars signify a sustained uptrend, indicating bullish market sentiment. On the other hand, Red Bars indicate a persistent downtrend, representing bearish market sentiment. The transition from red to green denotes a bullish trend reversal, suggesting a shift from bearish to bullish sentiment. Conversely, the shift from green to red signals a bearish trend reversal, indicating a transition from bullish to bearish sentiment. By monitoring these color changes, traders can identify potential trend reversals and make informed trading decisions.
The presence of gray and black bars indicates a neutral market state, often observed before an impending color change from red to green or green to red. These neutral bars serve as a transition phase between the previous trend and the potential reversal.
The TRN Bars incorporate Signal Bars, distinguished by their distinct colors, to offer potential buy and sell signals and deeper insights into market dynamics.
Reversal Bars
The presence of blue Reversal Bars indicates a trend reversal to the upside, while pink Reversal Bars indicate a reversal to the downside. These bars not only serve as signals for potential trend shifts but also present favorable opportunities to enter the market or increase one's position size.
Continuation Bars
In addition to the reversal bars, TRN Bars also include bullish continuation bars (colored turquoise) and bearish continuation bars (colored orange). These bars act as signals for the continuation of an existing trend. Like the reversal bars, they can be utilized as entry points or opportunities to augment one's position size.
Breakout Bars
The dark green breakout bars within TRN Bars show a powerful breakout from a price range detected by our integrated bar range feature. They signify the continuation or potential change in a trend following a consolidation phase. As such, these bars hold dual functionality, serving as reversal signals and validating the persistence of an ongoing trend.
Bar Ranges
The bar range feature automatically finds consolidations where the price range of several consecutives bars is rather small. The detection of the bar ranges includes among other things the overlapping percentage of these bars.
How to Use Price Ranges
Here are a few ways you can use the bar ranges in your trading:
Identify Support and Resistance Levels
The price ranges can help you identify key support and resistance levels on a chart. By observing price ranges and identifying these levels, you can make more informed decisions about entering or exiting trades.
Breakout Trading
Price ranges can also provide insights into potential breakout opportunities. Breakouts occur when the price breaks out of a defined range, signaling a potential shift in market sentiment and the start of a new trend. The Color highlighted Breakout Bars from the TRN Bars are signaling a powerful breakout of a price range. Traders can enter positions in the direction of the breakout and set appropriate stop-loss orders to manage risk. Note that not every price range is left by a powerful breakout.
Dynamic Trend
The Dynamic Trend combines elements from standard trend strength indicators (e.g. DI-, DI+, Parabolic SAR) and volatility indicators (e.g. ATR, Standard Deviation). It produces a moving average line that adapts to changing market volatility. It is inspired by the ideas of the programmer and trader Fat Tails. The adaptive behavior provides more relevant information for traders when compared to traditional moving averages which do not consider volatility and trend strength together. This makes the Dynamic Trend completely unique, and no other moving average indicator can give you this precision.
How to use Dynamic Trend
Generally, a rising Dynamic Trend line, displayed in green, indicates that an uptrend is strong, while a falling Dynamic Trend, displayed in red, suggests that the downtrend is sharp. The Dynamic Trend turns gray when there is insufficient clarity to establish a distinct trend and especially when there is not volatility in the market.
Identify potential trade entries and exits: When used in conjunction with price action, the Dynamic Trend can provide potential trade signals. For example, if the price crosses above the Dynamic Trend, it may be a bullish sign, suggesting a potential buy entry. Conversely, if the price crosses below the Dynamic Trend, it may indicate bearish conditions and a potential sell signal.
Trend Identification and Pullback trading
Observe the Dynamic Trend's color. When it's on the rise and appears green, it indicates a bullish trend. Conversely, if it's in decline and displayed in red, it signals a bearish trend.
If Dynamic Trend is green and price pulls from above back to the Dynamic Trend, then this can be considered as a bullish signal.
If Dynamic Trend is red and price pulls from below back to the Dynamic Trend, then this can be considered as a bearish signal.
In the event of a bearish signal, such as a bearish TRN Signal Bar, and the Dynamic Trend is red, it provides additional confirmation to the bearish signal. Likewise, bullish signals gain added conviction when the Dynamic Trend is green.
Crossovers
As with other moving averages, crossovers between the Dynamic Trend and the price can be significant.
If price is crossing above the Dynamic Trend, then this can be considered as a bullish signal.
If price is crossing below the Dynamic Trend, then this can be considered as a bearish signal.
If you currently hold a position, both bullish and bearish crossovers can serve as potential exit signals. For instance, in the case of a long position, a bearish crossover can indicate a potential shift in sentiment, signaling a bearish reversal and a potential opportunity to close your long position.
Filtering Noise
Due to its adaptive nature, the Dynamic Trend can be a useful tool to filter out market noise. When the market is choppy or consolidating, the Dynamic Trend tends to remain flat and colored gray, signaling traders to potentially stay out of the market.
Stop Losses
The Dynamic Trend can also be used as a dynamic stop loss. For instance, in a long trade, traders can use the Dynamic Trend as a trailing stop, selling their position if the price crosses below the Dynamic Trend.
Combining TRN Bars, Bar Ranges and Dynamic Trend together
Combining all three concepts gives you a crystal-clear picture of the market. The Dynamic Trend shows you the overall trend. If price pulls back to the dynamic trend line and then price picks up the trend direction again, then the TRN Bars immediately switch the color to the trend direction. Therefore, you can easily identify high probability entry signals based on the bar color.
As a simple trading model, you can set the stop loss below the last swing or below a TRN signal bar (vice versa for short entries) and use 2.5 R or 3 R as target.
You can increase the success rate of the high probability TRN signal bars entries even more if they are in line with the Dynamic Trend line.
On the other hand, the TRN Bar Ranges help you to stay out of the market in case the price does not really change. As a confluence signal to stay flat in this period the dynamic trend line tends to be grey as well. If the price breaks out of the range, then the TRN Bars print a breakout bar which serves as a high probability entry signal.
Although it is possible to switch off any of these concepts, it is highly recommended to use all three in combination to get a crystal-clear picture of the market.
Alerts
Experience the power of our TRN Bars Alerts, delivering real-time notifications for trend changes, price range breakouts, and signal bar formations or confirmations. Stay on top of the market with these versatile alerts, customizable to your preferred assets and timeframes.
Conclusion
While signals from TRN Bars can be informative, it is important to recognize that their reliability may vary. Various external factors can impact market prices, and it is essential to consider your risk tolerance and investment goals when executing trades.