Stochastic Momentum Channel with Volume Filter [IkkeOmar]A stochastic version of my momentum channel volume filter
The "Stochastic Momentum" indicator combines the concepts of Stochastic and Bollinger Bands to provide insights into price momentum and potential trend reversals. It can be used to identify overbought and oversold conditions, as well as potential bullish and bearish signals.
The indicator calculates a Stochastic RSI using the RSI (Relative Strength Index) of a given price source. It applies smoothing to the Stochastic RSI values using moving averages to generate two lines: the %K line and the %D line. The %K line represents the current momentum, while the %D line represents a filtered version of the momentum.
Additionally, the indicator plots Bollinger Bands around the moving average of the Stochastic RSI. The upper and lower bands represent levels where the price is considered relatively high or low compared to its recent volatility. The distance between the bands reflects the current market volatility.
Here's how the indicator can be interpreted:
Stochastic Momentum (%K and %D lines):
When the %K line crosses above the %D line, it suggests a potential upward move or bullish momentum.
When the %K line crosses below the %D line, it indicates a potential downward move or bearish momentum.
The color of the plot changes based on the relationship between the %K and %D lines. Green indicates %K > %D, while red indicates %K < %D.
Bollinger Bands (Upper and Lower Bands):
When the price crosses above the upper band, it suggests an overbought condition, indicating a potential reversal or pullback.
When the price crosses below the lower band, it suggests an oversold condition, indicating a potential reversal or bounce.
To identify potential upward moves, consider the following conditions:
If the price is not in a contraction phase (the bands are not narrowing), and the price crosses above the lower band, it may signal a potential upward move or bounce.
If the %K line crosses above the %D line while the %K line is below the upper band, it may indicate a potential upward move.
To identify potential downward moves, consider the following conditions:
If the price is not in a contraction phase (the bands are not narrowing), and the price crosses below the upper band, it may signal a potential downward move or pullback.
If the %K line crosses below the %D line while the %K line is above the lower band, it may indicate a potential downward move.
Code explanation
Input Variables:
The input function is used to create customizable input variables that can be adjusted by the user.
smoothK and smoothD are inputs for the smoothing periods of the %K and %D lines, respectively.
lengthRSI represents the length of the RSI calculation.
lengthStoch is the length parameter for the stochastic calculation.
volumeFilterLength determines the length of the volume filter used to filter the RSI.
Source Definition:
The src variable is an input that defines the price source used for the calculations.
By default, the close price is used, but the user can choose a different price source.
RSI Calculation:
The rsi1 variable calculates the RSI using the ta.rsi function.
The RSI is a popular oscillator that measures the strength and speed of price movements.
It is calculated based on the average gain and average loss over a specified period.
In this case, the RSI is calculated using the src price source and the lengthRSI parameter.
Volume Filter:
The code calculates a volume filter to filter the RSI values based on the average volume.
The volumeAvg variable calculates the simple moving average of the volume over a specified period (volumeFilterLength).
The filteredRsi variable stores the RSI values that meet the condition of having a volume greater than or equal to the average volume (volume >= volumeAvg).
Stochastic Calculation:
The k variable calculates the %K line of the Stochastic RSI using the ta.stoch function.
The ta.stoch function takes the filtered RSI values (filteredRsi) as inputs and calculates the %K line based on the length parameter (lengthStoch).
The smoothK parameter is used to smooth the %K line by applying a moving average.
The d variable represents the %D line, which is a smoothed version of the %K line obtained by applying another moving average with a period defined by smoothD.
Momentum Calculation:
The kd variable calculates the average of the %K and %D lines, representing the momentum of the Stochastic RSI.
Bollinger Bands Calculation:
The ma variable calculates the moving average of the momentum values (kd) using the ta.sma function with a period defined by bandLength.
The offs variable calculates the offset by multiplying the standard deviation of the momentum values with a factor of 1.6185.
The up and dn variables represent the upper and lower bands, respectively, by adding and subtracting the offset from the moving average.
The Bollinger Bands provide a measure of volatility and can indicate potential overbought and oversold conditions.
Color Assignments:
The colors for the plot and Bollinger Bands are assigned based on certain conditions.
If the %K line is greater than the %D line, the plotCol variable is set to green. Otherwise, it is set to red.
The upCol and dnCol variables are set to different colors based on whether the fast moving average (fastMA) is above or below the upper and lower bands, respectively.
Plotting:
The Stochastic Momentum (%K) is plotted using the plot function with the assigned color (plotCol).
The upper and lower Bollinger Bands are plotted using the plot function with the respective colors (upCol and dnCol).
The fast moving average (fastMA) is plotted in black color to distinguish it from the bands.
The hline function is used to plot horizontal lines representing the upper and lower bands of the Stochastic Momentum.
The code combines the Stochastic RSI, Bollinger Bands, and color logic to provide visual representations of momentum and potential trend reversals. It allows traders to observe the interaction between the Stochastic Momentum lines, the Bollinger Bands, and price movements, enabling them to make informed trading decisions.
Channeltrend

Volume Profile Regression Channel [LuxAlgo]The Volume Profile Regression Channel calculates a volume profile from an anchored linear regression channel. Users can choose the starting and ending points for the indicator calculation interval.
Like a regular volume profile, a "line" of control (LOC), value area, and a developing LOC are displayed.
🔶 SETTINGS
Sections: The number of sections the linear regression channel is divided into for the calculation of the volume profile.
Width %: Determines the length of the profile within the channel relative to the channel length.
Value Area %: Highlights the sections starting from the POC whose accumulated volume is equal to the user-defined percentage of the total profile sections volume.
🔶 USAGES
Regular volume profiles are often constructed from a horizontal price area, this can allow highlighting price areas where most trading activity takes place.
However, when price is strongly trending a classical volume profile can sometimes be more uniform. This is where using an angled volume profile can be useful.
The line of control allows highlighting the section of the channel with the most accumulated volume, this line can be used as a potential future support/resistance. This is where an angled volume profile might be the most useful.
The developing LOC highlights the LOC location at a specific time within the profile (from left to right) and can sometimes provide an estimate of the underlying trend in the price.
🔶 DETAILS
To be computed the script requires a left and right chart time coordinates. When adding the script to their charts users can determine the left and right time coordinates by clicking on the chart.
The linear regression channel width is determined so that the channel precisely encompasses the whole price.
🔶 LIMITATIONS
Using a very large calculation interval can return timeouts. Users can reduce the calculation interval to fix that issue from occurring.
The amount of drawing objects that can be used is limited, as such using a high calculation interval can display an incomplete profile.
🔶 ACKNOWLEDGEMENTS
If you are interested in these types of scripts, @HeWhoMustNotBeNamed published a similar script where users can use a custom line angle. See his 'Angled Volume Profile' script from March 2023.

TrueLevel BandsTrueLevel Bands is a powerful trading indicator that employs linear regression and standard deviation to create dynamic, envelope-style bands around the price action of a financial instrument. These bands are designed to help traders identify potential support and resistance levels, trend direction, and volatility.
The TrueLevel Bands indicator consists of multiple envelope bands, each constructed using different timeframes or lengths, and a multiple (mult) factor. The multiple factor determines the width of the bands by adjusting the number of standard deviations from the linear regression line.
Key Features of TrueLevel Bands
1. Multi-Timeframe Analysis: Unlike traditional moving average-based indicators, TrueLevel Bands allow traders to incorporate multiple timeframes into their analysis. This helps traders capture both short-term and long-term market dynamics, offering a more comprehensive understanding of price behavior.
2. Customization: The TrueLevel Bands indicator offers a high level of customization, allowing traders to adjust the lengths and multiple factors to suit their trading style and preferences. This flexibility enables traders to fine-tune the indicator to work optimally with various instruments and market conditions.
3. Adaptive Volatility: By incorporating standard deviation, TrueLevel Bands can automatically adjust to changing market volatility. This feature enables the bands to expand during periods of high volatility and contract during periods of low volatility, providing traders with a more accurate representation of market dynamics.
4. Dynamic Support and Resistance Levels: TrueLevel Bands can help traders identify dynamic support and resistance levels, as the bands adjust in real-time according to price action. This can be particularly useful for traders looking to enter or exit positions based on support and resistance levels.
5. The "Global Trend Line" refers to the average of the bands used to indicate the overall trend.
Why TrueLevel Bands are Different from Classic Moving Averages
TrueLevel Bands differ from conventional moving averages in several ways:
1. Linear Regression: While moving averages are based on simple arithmetic means, TrueLevel Bands use linear regression to determine the centerline. This offers a more accurate representation of the trend and helps traders better assess potential entry and exit points.
2. Envelope Style Bands: Unlike moving averages, which are single lines, TrueLevel Bands form envelope-style bands around the price action. This provides traders with a visual representation of potential support and resistance levels, trend direction, and volatility.
3. Multi-Timeframe Analysis: Classic moving averages typically focus on a single timeframe. In contrast, TrueLevel Bands incorporate multiple timeframes, enabling traders to capture a broader understanding of market dynamics.
4. Adaptive Volatility: Traditional moving averages do not account for changing market volatility, whereas TrueLevel Bands automatically adjust to volatility shifts through the use of standard deviation.
The TrueLevel Bands indicator is a powerful, versatile tool that offers traders a unique approach to technical analysis. With its ability to adapt to changing market conditions, provide multi-timeframe analysis, and dynamic support and resistance levels, TrueLevel Bands can serve as an invaluable asset to both novice and experienced traders looking to gain an edge in the markets.

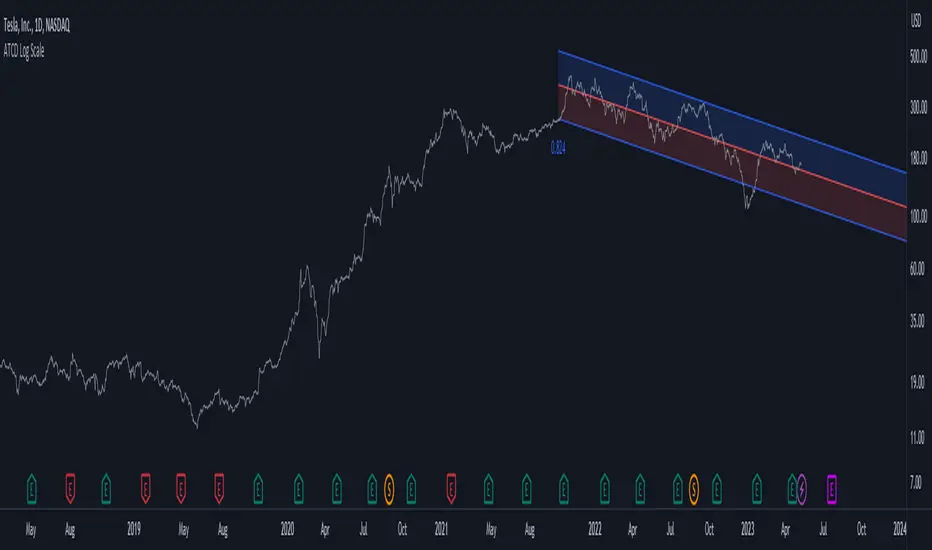
Advanced Trend Channel Detection (Log Scale)The Advanced Trend Channel Detection (Log Scale) indicator is designed to identify the strongest trend channels using logarithmic scaling. It does this by calculating the highest Pearson's R value among all length inputs and then determining which length input to use for the selected slope, average, and intercept. The script then draws the upper and lower deviation lines on the chart based on the selected slope, average, and intercept, and optionally displays the Pearson's R value.
To use this indicator, you will need to switch to logarithmic scale. There are several advantages to using logarithmic scale over regular scale. Firstly, logarithmic scale provides a better visualization of data that spans multiple orders of magnitude by compressing large ranges of values into a smaller space. Secondly, logarithmic scale can help to minimize the impact of outliers, making it easier to identify patterns and trends in the data. Finally, logarithmic scale is often utilized in scientific contexts as it can reveal relationships between variables that may not be visible on a linear scale.
If the trend channel does not appear on the chart, it may be necessary to scroll back to view historical data. The indicator uses past price data to calculate the trend channel, so if there is not enough historical data visible on the chart, the indicator may not be able to identify the trend channel. In this case, the user should adjust the chart's timeframe or zoom out to view more historical data. Additionally, the indicator may need to be recalibrated if there is a significant shift in market conditions or if the selected length input is no longer appropriate.
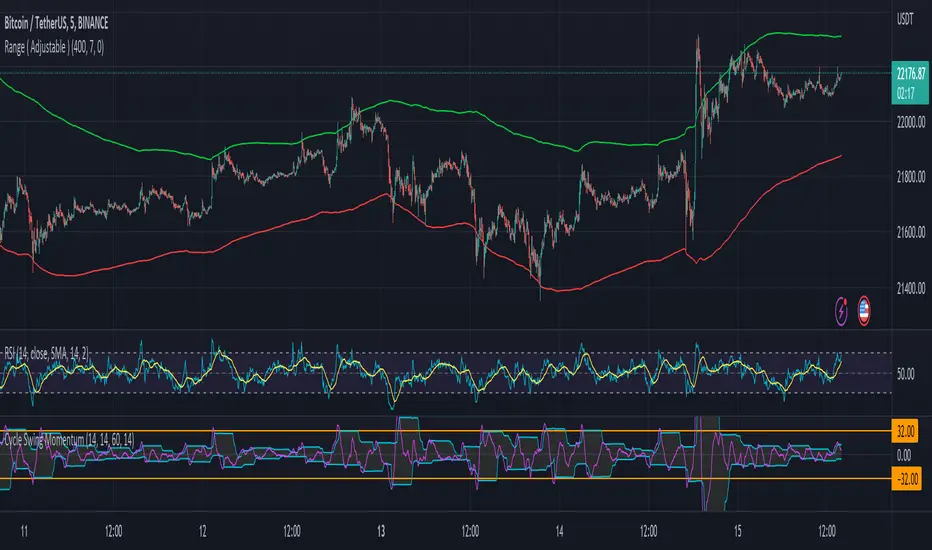
Range ( Adjustable ) HLLSfor range of the price ( Adjustable )
This indicator shows you in what price range it may move.
This indicator is adjustable. You must set your installation to the past of its chart. (depends on timeframe)
Pay attention to adapt it in different time frames and with your strategy.
The function of this indicator is simple.
Based on the first factor (the number of previous candles), you can adjust average range channel with the second factor for height of the channel.
Faytterro Bandswhat is Faytterro Bands?
it is a channel indicator like "Bollinger Bands".
what it does?
creates a channel using standard deviations and means. thus giving users an idea about the expensive and cheap zones. It uses a special weighted moving average different from standard bollinger bands, it also averages not only price but also deviations.
how it does it?
it uses this formulas:
how to use it?
its usage is the same as "bollinger band".
length represents the number of candles to be taken into account, source represents the source of those candles and stdev represents the coefficient of the standard deviation.
you can use it with other indicators:

Volume Weighted Reversal BandsThis is a vwap & vwma hybrid with upper & lower deviation bands that provide excellent price channels and reversal areas. It can be used on lower & higher timeframes, just increase the deviation % for higher timeframes. Try out the 1 minute timeframe with .5% deviation for great scalping levels.
Here is the calculation used for the main line.
(VWMA100 + VWMA500 + VWMA1000 + VWAP) / 4
So it combines 3 VWMAs with the VWAP and divides that number by 4 to give us a moving average. Then we add new levels above and below that moving average to get our channels. The channels are separated by the % deviation you choose in the settings. For tighter bands, lower the percentage deviation and for wider bands, increase the percentage deviation.
The fattest line in the middle is the main moving average and you can expect price to regularly return to this level. The thick lines are the main moving average plus or minus the percentage deviation you have set. There are 10 levels in each direction from the main moving average. The is also a thin short term moving average as well with a custom calculation. It takes 4 different length moving averages that are weighted and 4 more that are volume weighted and divides the total by 8.The lines will be green when price is above the line and red when price is below the line. The thin white line is the VWAP on its own.
These lines will act as dynamic support and resistance so you can scalp them back and forth. These levels work so well because they are volume weighted and the algos hedge their positions back and forth constantly.
For best results, use this indicator on tickers with the highest volume and trading action as the price will stick to these levels better when the big money players are hedging. Some great tickers for this indicator are APPL, SPY, BTC, ETH.
All colors and linewidths can be customized in the settings easily as well as turning off the VWAP or short moving average and adjusting the percentage deviation for the channels.
***MARKETS***
This indicator can be used on all markets, including stocks, crypto, futures and forex.
***TIMEFRAMES***
This indicator can be used on all timeframes.
***TIPS***
Try using numerous indicators of ours on your chart for extra confirmation. Our favorites to pair with these bands are the Scalper Ribbon and Trend Friend Signals. The 3 combined give you a lot of extra confirmation on whether the market is going to reverse at these levels.

CoG RSI Momenum Ichimoku CloudThis indicator is inspired by "RSI ICHIMOKU CLOUD".
Script plots price bars based on selected indicator with Ichimoku Cloud around it.
In my version I have added different oscillators for bar calculations.
Specifically you can choose from:
Center of Gravity(CoG)
Momentum
RSI

Pivot-Based Channels & Bands [Misu]█ This Indicator is based on Pivot detection to show bands and channels.
The pivot price is similar to a resistance or support level. If the pivot level is breached, the price should continue in that direction. Or the price could reverse at or near this level.
█ Usages:
Use channels as a support & resistance zone.
Use bands as a support & resistance zone. It is also very powerfull to use it as a breakout.
Use mid bands & mid channels as a trend direction or trade filter as a more usual moving average.
█ Parameters:
Show Pivot Bands: show bands.
Show Pivot Mid Band: show mid bands.
Show Pivot Channels: show channels.
Show Pivot Mid Channel: show mid channels.
Deviation: deviation used to calculate pivot points.
Depth: depth used to calculate pivot points.

DEMA Supertrend Bands [Misu]█ Indicator based on DEMA (Double Exponential Moving Average) & Supertrend to show Bands .
DEMA attempts to remove the inherent lag associated with Moving Averages by placing more weight on recent values.
Supertrend aims to detect price trends, it's also used to set protective stops.
█ Usages:
Combining Dema to calculate Supertrend results in nice lower and upper bands.
This can be used to identify potential supports and resistances and set protective stops.
█ Parameters:
Length DEMA: Double Ema lenght used to calculate DEMA. Dema is used by Supertrend indicator.
Length Atr: Atr lenght used to calculate Atr. Atr is used by Supertrend indicator.
Band Mult: Used to calculate Supertrend Bands width.
█ Other Applications:
The mid band can be used to filter bad signals in the manner of a more classical Moving Average.
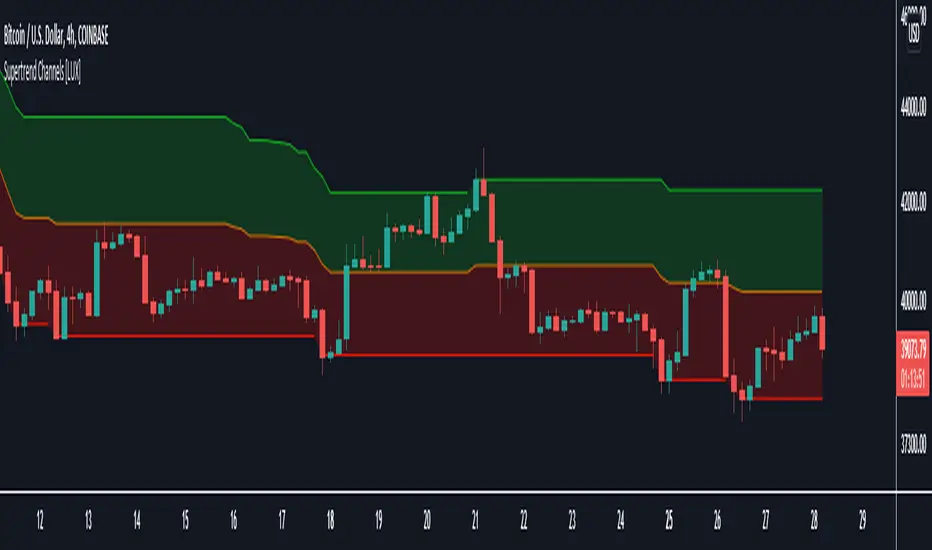
Supertrend Channels [LuxAlgo]The Supertrend is one of the most used indicators by traders when it comes to determining whether the market is up-trending or down-trending.
This indicator is displayed as a trailing stop, showing a lower monotonic extremity during up-trends and an upper monotonic extremity during down-trends. Today we propose a channel indicator based on the Supertrend trailing stop using trailing maximas/minimas.
Settings
Length: Atr length used by the Supertrend indicator.
Mult: Multiplicative factor for the Atr used by the Supertrend indicator.
Usage
The ability of the indicator to show an up-trend or down-trend is the same as the Supertrend, with rising channels when an up-trend is detected by the Supertrend and declining channels when a down-trend is detected by the Supertrend.
The look of the channels can remind of the Donchian channels indicator, and as such a similar usage can be appropriate. The extremities can for example be used as supports and resistances.
Additionally, the channel's average can be used to filter out noisy variations in the price while keeping a good distance from the price.
Linear Regression Channel - Auto Volume BasedBased on oryginal TV indicator BUT with a little twist. ;)
I really like the regression channel - but the problem is that the length needs to be always manually adjusted.
In this script I try to solve this issue.
This is modified version on TV indicator - Linear Regression Channel.
The main difference is that now you don't get static length - it is automatically adjuested to the recent price action (determined by highest volume in last 300 bars).

[mdeacey] EMA% Channel + BB Range StrategyThis strategy is based off the users selection of an EMA and percentage defined channel. The strategy longs when a red "reversal candle" (that exceeds the averages of 3 and 9 above the EMA 3) is found until such time that either the price goes outside the Bollinger Band or the green reversal candle is found. The same but opposite process for shorts. If the price begins trending and moves outside the channel all trades are exited to prevent loss.
For trending markets the sister strategy (" EMA% Channel + Bollinger Band Trending Strategy") should instead be used.
The obvious fallback to this strategy is that:
- If the bands are too wide we don't have a good definition of trending vs ranging and the price can move up/down significantly and trend whilst remaining within the ranging channel. We try to mitigate this through use of a stoploss defined by ATR and a pretty tight channel. This is a tightrope exercise as making the percentage channels tighter misses earlier entries in optimal cases. Change the parameters to find an EMA and percentages to find the best R/R in your case.
Potential further iteration:
- It would be good to see if the R/R changes positively if we only allow shorts above the EMA and longs below it.
All options are configurable and code open source. Happy trading!

[mdeacey] EMA% Channel + Bollinger Band Trending StrategyThis strategy is based off the users selection of an EMA and percentage defined middle, upper and lower channels. The strategy longs if the price crosses the middle to upper channel until such time that a "reversal candle" (that exceeds the averages of 3 and 9 above the EMA 3) is found – and then shorts that reversal candle in the hope the price will change state from trending to ranging and move back to the middle channel. The same but opposite process for shorts.
The two obvious fallbacks to this strategy are that:
- Once trending the price can continue upwards. We try to mitigate this through use of a stoploss defined by ATR.
- Certain percentage thresholds can trigger a long/short with not much room to move before coming back to the middle channel. This is a tightrope exercise as making the percentage channels tighter misses earlier entries in more optimal cases. Change the parameters to find an EMA and percentages to find the best R/R.
All options are configurable and code open source. Happy trading!

Repeated Median Regression with Interactive Range SelectionGreetings to all!
As you probably know, TradingView now supports interactive inputs that can be directly set on a chart. I decided to build a tool that takes advantage of this incredible feature. This tool applies robust linear regression within a time interval on the chart that you can select interactively.
Method
The script uses an algorithm known as Repeated Median Regression . It belongs to the class of so-called robust regression methods. The reason they are called “robust” is that these methods are much less sensitive to outliers in the data than the ordinary least squares.
The calculation procedure is as follows: For each data point, this algorithm collects the slopes of the lines connecting that point to all other points in the sample, calculates the median slope, and then obtains the median value of these median slopes. Subsequently, it calculates the intercepts of the regression line and the mean absolute error (MAE) of the model.
Based on these results, a linear channel is plotted. The upper and lower channel boundaries are set by the MAE value multiplied by a user-defined coefficient.
Further reading
You can read more about robust linear regression on Wikipedia .
For more information on interactive inputs, see the User Manual's page .
Previous publication
I have already posted a script using the repeated median regression method. Although the core algorithm is essentially the same, interactive input provides fundamentally different functionality to the current script.
A word of caution
Currently, the interactive interval selection mode can be triggered only when the script is loaded to the chart. Thus, you might have to reload it when switching between different timeframes.

FEJ - DogeMarginFEJ - DogeMargin ist ein All-in-One Indikator.
Mit dem ihr euch praktisch das Upgrade auf eine bezahlte Tradingview Version sparen könnt.
- Wave-Detector: Bestehend aus einem innovativen Wave-Trenddetector mit dessen hilfe es sehr leicht ist einen Trendwechsel und die vorraussichtliche Stärke des kommenden Moves zu erkennen.
- NMA: Eine dynamische Trendlinie um die stärke der Signale zu überprüfen.
- Channel: Um potenzielle Trendwenden bzw. Überkaufte oder Überverkaufte Situationen zu erkennen.
- Golden- & Deathcross: SMA basierende Crosses um potenzielle Trendwendepunkte zu erkennen und bestehende Signale zu überprüfen. Die SMA Crosses sind in einem festgelegten Timeframe, welcher sich in den Einstellungen anpassen lässt. Die SMA´s sind optional einblendbar. In einem Update folgen noch MACD Crosses.
- Volume Candles: Dieser passt die Farbe der Candles entsprechend dem aktuellen Volumen und dessen Richtung an.
Dunkel Violett - Der Preis sinkt und das Volumen ist größer als 200% des Durchschnitts der letzten 20 Tage - Stark Bearish
Violett - Der Preis sinkt und das Volumen ist zwischen 50% und 200% des Durchschnitts der letzten 20 Tage - Volumen ist weder stark noch schwach
Helles Violett - Der Preis sinkt und das Volumen ist geringer 50% des Durchschnitts der letzten 20 Tage - Wenig Support für die aktuellen Preisbewegungen.
Aqua - Der Preis steigt und das Volumen ist größer als 200% des Durchschnitts der letzten 20 Tage - Stark Bullish
Blau - Der Preis steigt und das Volumen ist zwischen 50% und 200% des Durchschnitts der letzten 20 Tage - Volumen ist weder stark noch schwach
Helles Blau - Der Preis steigt und das Volumen ist geringer 50% des Durchschnitts der letzten 20 Tage - Wenig Support für die aktuellen Preisbewegungen.
- S & R Lines: Dieser Indikator zeigt die für diesen Timeframe aktuellen Support und Resistance Linien an.
- EMA Ribbons: Dieser Indikator zeigt ein Ribbon für den aktuellen Timeframe an.
Wave
Mit Hilfe der Welle in der Mitte lassen sich Trendwenden erkennen.Die Trendwende ist besonders stark, wenn das Signal bei einem Bull-Signal unterhalb der gelben NMA-Line liegt ; bei einem Bear-Signaloberhalb der gelben NMA-Linie liegt.
Wenn Kurs in folge eines Signals nach der NMA schließt, deutet das auf einen Trendwechsel hin. Bis dahin
Mit hilfe des Dogeprotocol lassen sich diese Signale noch weiter verbessern undgegenprüfen
Channel
NMA
Golden- & Deathcross
Zeigt an wo sich entweder ein SMA Golden- oder Death-Cross befindet
WICHTIG: Der TimeFrame für die Crosses ist festgelegt - Standardmäßig auf 4h (240m)
Es macht am meisten Sinn, den TF auf 1/10 deines Beobachtungszeitramens zu stellen.
2x SMA´s
Volume Candles
S & R Lines
EMA Ribbos
____________________________________________________________________________________________________________________________
English:
FEJ - DogeMargin is an all-in-one indicator.
With which you practically do that Upgrading to a paid Tradingview version can save you money.
- Wave detector: Consists of an innovative wave trend detector with its help it is very easy to change the trend and the anticipated Recognize the strength of the upcoming move.
- NMA: A dynamic trend line to check the strength of the signals.
- Channel: Around potential trend reversals or overbought or oversold situations to recognize.
- Golden & Death cross: SMA based crosses around potential trend turning points to recognize and to check existing signals. The SMA Crosses are in a fixed timeframe, which can be found in the settings can be adjusted. The SMAs can optionally be faded in. MACD Crosses will follow in an update.
- Volume Candles: This adjusts the color of the candles according to the current volume and its direction.
Dark Purple - The price is falling and the volume is greater than 200% of the Last 20 Day Average - Strongly Bearish
Purple - The price is going down and the volume is between 50% and 200% of the Last 20 days average - volume is neither strong nor weak
Light purple - the price goes down and the volume is less than 50% of the Average of the last 20 days - Little support for the current ones Price movements.
Aqua - The price goes up and the volume is greater than 200% of the Last 20 days average - Strong Bullish
Blue - The price is increasing and the volume is between 50% and 200% of the Last 20 days average - volume is neither strong nor weak
Light blue - the price goes up and the volume is less 50% of the Average of the last 20 days - Little support for the current ones Price movements.
- S & R Lines: This indicator shows the current support and for this timeframe
Resistance lines on.
- EMA Ribbons: This indicator shows a ribbon for the current timeframe.
Wave
Trend reversals can be seen with the help of the wave in the middle.
The turnaround is particularly strong when the signal is at one
Bull signal is below the yellow NMA line; on a bear signal is above the yellow NMA line.
If course closes on a signal after the NMA , it indicates one
Change of trend. Until then
With the help of the Dogeprotocol, these signals can be improved even further
double check
Channel
NMA
Golden & Death Cross
Shows where either a SMA golden or death cross is located
IMPORTANT: The timeframe für crosses is fixed - by default to 4h (240m)
It makes the most sense to set the TF to 1/10 of your observation timeframe.
2x SMAs
Volume candles
S&R Lines
EMA Ribbos

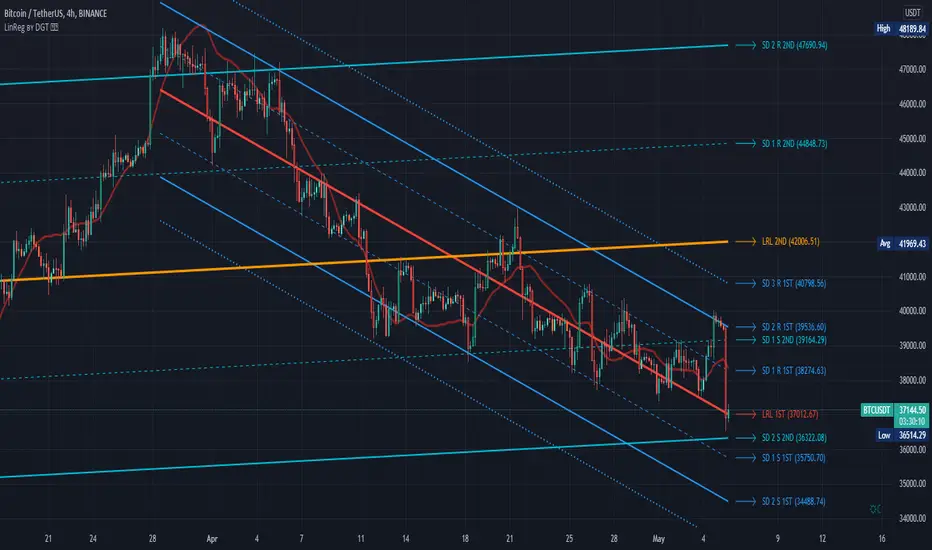
Linear Regression Channel / Curve / Slope by DGTTʜᴇ Lɪɴᴇᴀʀ Rᴇɢʀᴇꜱꜱɪᴏɴ Cʜᴀɴɴᴇʟꜱ
Linear Regression Channels are useful measure for technical and quantitative analysis in financial markets that help identifying trends and trend direction. The use of standard deviation gives traders ideas as to when prices are becoming overbought or oversold relative to the long term trend
The basis of a linear regression channel
Linear Regression Line – is a line drawn according to the least-squares statistical technique which produces a best-fit line that cuts through the middle of price action, a line that best fits all the data points of interest. The resulting fitted model can be used to summarize the data, to predict unobserved values from the same system. Linear Regression Line then present basis for the channel calculations
The linear regression channel
2. Upper Channel Line – A line that runs parallel to the Linear Regression Line and is usually one to two standard deviations above the Linear Regression Line.
3. Lower Channel Line – This line runs parallel to the Linear Regression Line and is usually one to two standard deviations below the Linear Regression Line.
Unlike Fibonacci Channels and Andrew’s Pitchfork, Linear Regression Channels are calculated using statistical methods, both for the regression line (as expressed above) and deviation channels. Upper and Lower channel lines are presenting the idea of bell curve method, also known as a normal distribution and are calculated using standard deviation function.
A standard deviation include 68% of the data points, two standard deviations include approximately 95% of the data points and any data point that appears outside two standard deviations is very rare.
It is often assumed that the data points will move back toward the average, or regress and channels would allow us to see when a security is overbought or oversold and ready to revert to the mean
please note : Over time, the price will move up and down, and the linear regression channel will experience changes as old prices fall off and new prices appear
█ Linear Regression Study Features
Linear Regression Channel
- Linear regression line as basis
- Customizable multiple channels based on Standard Deviation
- ALERTs for the channel levels
Linear Regression Curve
- Linear regression curve as basis
- Optional : Bands based on Standard Deviation or Volatility (ATR). Bands are applied with fixed levels 1, 2 and 3 times StdDev or ATR away from the curve
Linear Regression Slope
- Optional : Up/Down slope arrows for a used defined period
█ Volume / Volatility Add-Ons
High Volatile Bar Indication
Volume Spike Bar Indication
Volume Weighted Colored Bars
(IK) Grid ScriptThis is my take on a grid trading strategy. From Investopedia:
"Grid trading is most commonly associated with the foreign exchange market. Overall the technique seeks to capitalize on normal price volatility in an asset by placing buy and sell orders at certain regular intervals above and below a predefined base price."
This strategy is best used on sideways markets, without a definitive up or down major trend. Because it doesn't rely on huge vertical movement, this strategy is great for small timeframes. It only goes long. I've set initial_capital to 100 USD. default_qty_value should be your initial capital divided by your amount of grid lines. I'm also assuming a 0.1% commission per trade.
Here's the basic algorithm:
- Create a grid based on an upper-bound (strong resistance) and a lower-bound (strong support)
- Grid lines are spaced evenly between these two bounds. (I recommend anywhere between 5-10 grid lines, but this script lets you use up to 15. More gridlines = more/smaller trades)
- Identify nearest gridline above and below current price (ignoring the very closest grid line)
- If price crosses under a near gridline, buy and recalculate near gridlines
- If price crosses over a near gridline, sell and recalculate near gridlines
- Trades are entered and exited based on a FIFO system. So if price falls 3 grid lines (buy-1, buy-2, buy-3), and subsequently crosses above one grid line, only the first trade will exit (sell-1). If it falls again, it will enter a new trade (buy-4), and if it crosses above again it will sell the original second trade (sell-2). The amount of trades you can be in at once are based on the amount of grid lines you have.
This strategy has no built-in stop loss! This is not a 'set-it-and-forget-it" script. Make sure that price remains within the bounds of your grid. If prices exits above the grid, you're in the money, but you won't be making any more trades. If price exits below the grid, you're 100% staked in whatever you happen to be trading.
This script is more complicated than my last one, but should be more user friendly. Make sure to correctly set your lower-bound and upper-bound based on strong support and resistance (the default values for these are probably going to be meaningless). If you change your "Grid Quantity" (amount of grid lines) make sure to also change your 'Order Size' property under settings for proper test results (or default_qty_value in the strategy() declaration).

ChannelSlasher (1m - 3m)This is a moving average channel-based scalping strategy that is optimized for very short time-frames.
In general, the optimal settings will be for the fast channel to be several periods shorter than the slow channel and the fast HMA (hull moving average) to be a few periods shorter than the fast channel.
This strategy can offer wild swings in profitability with relatively small parameter changes, so I HIGHLY recommend you cross-validate any set of parameters across multiple exchanges AND across multiple tickers.

GAURs Polynomial Regression ChannelsThanks to The Sweet Lord , here is the Gaur's Polynomial Regression Channel.
Its a Polynomial Regression Channel but applied a little differently. Wont go into technical details much. Overview of options is as follows-
- - - - - - - - - - - - - - - - - - - - - - - - - - - - - - - - - - - - - - - - - - - - - - - - - - - - - - - - - - - - - - - - - - - - - - - - - - - - - - - - - - - - - - - - - - - - - - - -
Channel Options
- - - - - - - - - - - - - - - - - - - - - - - - - - - - - - - - - - - - - - - - - - - - - - - - - - - - - - - - - - - - - - - - - - - - - - - - - - - - - - - - - - - - - - - - - - - - - - - -
1. Degree of Polynomial: 1/2/3
Default = 3
Defines the degree of polynomials - 1,2,3. Note here, degree 1 will not be a straight line since its applied differently.
Try different degrees for different fits and market conditions.
2. Channel Length:
Default 30 (candles)
You can go beyond 100 or 200 candle lengths but smaller is the usual preference of Poly-Reg-channel traders. It all depends on market conditions and your style of trading. Do your research. I am usually comfortable with a range of 20-50 (in crypto markets).
3. Basis of Channel height/boundries: ATR/Manual
Default: ATR
ATR provides a dynamically adjusted entry/exit bounds of the channels. As ATR changes, the channel bounds also changes its height. It can also be fixed manually. Manual heights wont change automatically.
4. Basis of Y-Value: open/close/ sma / ema / wma /hilow
Default: close
Y- value is the y value of the (x,y) coordinates used while calculating the regression coefficients. Dont worry about it, its nothing serious.
5. Apply channel smoothning using sma?: Yes/No
Default: Yes
Without smoothning, the channel does not "look" good.
6. Shaded Area Height Percentage:
Its the extra margin for the channel. Its in percentage of the total height (defined 3 above) of channels. The shaded area provides an extra allowance for your entries or exits beyond the ATR or manual heights.
7. Plot RSI?: Yes/No
Default: Yes
Plots RSI (orange line in between the channel - its different from the dotted center line) considering the downbound of channels as 0 (oversold) and upbound of channels as 100 (overbought)
8. Plot 200 sma?: Yes/No
Default: Yes
It plots a 200 period fast (green) and 225 period slow (red) sma . I usually use two MAs. Its visually very easy to understand.
- - - - - - - - - - - - - - - - - - - - - - - - - - - - - - - - - - - - - - - - - - - - - - - - - - - - - - - - - - - - - - - - - - - - - - - - - - - - - - - - - - - - - - - - - - - - - - - -
Sample Strategy
- - - - - - - - - - - - - - - - - - - - - - - - - - - - - - - - - - - - - - - - - - - - - - - - - - - - - - - - - - - - - - - - - - - - - - - - - - - - - - - - - - - - - - - - - - - - - - - -
You can develop your own strategy with the channels. But following is just one of the ways you can trade.
Best Application: Ranging markets. But can be happily used in volatile conditions, with a little experience.
1. SMA: -- (this condition is optional really)
If green (200) is above red (225) go only long. If red is above green go only short. Defines long term trend of the market.
2. Channel slope: -- (this stuff needs practice/experience)
Depending on the channel slope, like if its tending to go up or down, you can choose to take only short or long trades. It defines short term momentum of the market.
3. ATR based heights:
Since its ATR based, the channel height are our natural entry and exit points.
Long:
When price touches lower shaded area, consider possible long entry. Exit on price entering the upper shaded area.
Short:
Enter on upper bound shaded area, exit on lower.
4. RSI:
For additional conformations. Again note, the RSI considers the lower bound of channel as 0 and upper as 100. But since, the channel moves up and down, the RSI will also move not only as RSI but also with the channel. Meaning, say if the RSI is valued at 50, then it will be near the center of the channel but since the center changes as time and price changes, the RSI valued at 50 at different times will not be at the same horizontal level respect to the graph, although it will be at the same level (center) respect to the channel.
5. PRC Channel Percentage label:
This label is at the lower side a bit ahead of the current candle. Provides you info on what is the channel percentage. This is especially helpful in crypto markets to gauge your possible percentage profit where profits can be much higher than forex or other instruments. It can also helps you select a suitable market/instrument if the channels are based on ATR.
6. Extra indicators:
I usually use stochastic along with this setup for extra conformations.
- - - - - - - - - - - - - - - - - - - - - - - - - - - - - - - - - - - - - - - - - - - - - - - - - - - - - - - - - - - - - - - - - - - - - - - - - - - - - - - - - - - - - - - - - - - - - - - -
Donate
- - - - - - - - - - - - - - - - - - - - - - - - - - - - - - - - - - - - - - - - - - - - - - - - - - - - - - - - - - - - - - - - - - - - - - - - - - - - - - - - - - - - - - - - - - - - - - - -
Use freely and donate generously if you find value. Your help will really help.
I had earlier provided BTC addresses for donations but it seems to violate TV House rules.
Hope they make TV coins redeemable in future.
- Pranav Joshi
- - - - - - - - - - - - - - - - - - - - - - - - - - - - - - - - - - - - - - - - - - - - - - - - - - - - - - - - - - - - - - - - - - - - - - - - - - - - - - - - - - - - - - - - - - - - - - - -
Extra Info
- - - - - - - - - - - - - - - - - - - - - - - - - - - - - - - - - - - - - - - - - - - - - - - - - - - - - - - - - - - - - - - - - - - - - - - - - - - - - - - - - - - - - - - - - - - - - - - -
// © cpranavjoshi
// special thanks to the "Trading View" people for providing this great platform for free
// ------------------------
// MATH
// ------------------------
// special thanks to an article on the web that provided layman friendly explanation of the maths
// unfortunately i wont be able to provide the link to that article owing to TV restrictions, though i sincerely would have liked to credit the author.
// Google search this phrase, and you should be able to get it in one of the first results - "polynomialregression Mathematics of Polynomial Regression"
// my regression math calculation is a further resolution upon the generalized matrix formula given in the that article.
// the generalized matrix looks scary but in fact its much simpler than one may assume
// the summation sign things are just float numbers that can be easily found out
// so we get a matrix with number of equations equal to the number of unknowns.
// e.g. if its a 3rd degree poly, it has 4 unknowns (c0,c1,c2,c3) with 4 equations as in the generalized matrix
// it can be resolved by simple algebra
// Note: the results have been verified with excel using same input data points.
// pine was difficult for me so i coded it in python first to verify
// ------------------------
// WHY
// ------------------------
// this script was coded because Pranav badly needed Polynomial channels (had used them in mt4 earlier)
// and at the time of this coding, i could not find any readily available script in the trading view public library ( tnx public)
// the complex math was probably the hurdle
// i m not good in maths, but by the Will of the Lord, i could resolve the issue with simple algebra and logic
// ------------------------
// PINE
// ------------------------
// i am just an average (even poor probably) programmer and pine script is not my language
// this is a humble attempt to write my first pine with whatever i could do quickly
// experts - feel free to develop if needed. have used some workarounds in drawings/plottings. rectify them if possible
//
//
// - Pranav Joshi

Price Action ChannelsHere are the brand new Price Action Channels.
As time passes and the portfolio grows not only in volume but in assets managed, I have found out that what's needed from technical analysis can't occupy so much time in decision making. Why? I hope you take into consideration other critical variables that affect the market, such as fundamentals, market sentiment, news, the world economy, and so on. Thus, I want to make obvious TA is not supposed to give you miracle formulas. In my investments, technicals count for about 33% of my decision formula.
Now about the indicator.
I'm a big fan of simplicity, and the fact is, everything is numbers and their universal rules.
So the approach we take is entirely following rules of statistics, taking into consideration the maximum amount of data to quantify and qualify moves(changes in price towards a single direction).
Once those moves are defined, we measure their average size, which is the average price range in one direction.
After that, we qualify them by using frequencies and figuring out how often each move happens, let's say:
Asset X, 10% of the times when it moves upwards it's +1%
Asset X, 14% of the times when it moves upwards it's +1,1%
Asset X, 21% of the times when it moves upwards it's +1.3%
Asset X, 25% of the times when it moves upwards it's +1.5%
Asset X, 15% of the times when it moves upwards it's +1.6%
Asset X, 10% of the times when it moves upwards it's +1,7%
Asset X, 5% of the times when it moves upwards it's +2%
With that data, we establish the size of the range and the most reasonable boundaries and thresholds.
This is meant for channels. We consider there are 3 market conditions: Channels(Trending), Sideways, Spikes(abnormal price changes).
So if you try to apply this indicator for huge movements, like news related pumps and such it won't work as it's supposed, since our approach here is to define what's "normal", and such spikes are anomalies.
Sideway assets are doable but not advisable.
We plot all the numbers in a panel, so it's easily readable while trading, and you can fully control where it appears on your screen.
The indicator counts with following features in the Panel:
Channel Sampling Size: Short-term, Mid-term, Long-term
Risk Exposure: Minimum, Low, Modest, Medium, Moderate, High, Maximum
Filtered Price Action
Trading Assist
X & Y Panel Position
Study Strong.

EMA High-Low ChannelThe channel is of High and low using EMA, so it is easily to track and see higher high when prices is breaking above channel. same is vice-versa when price is breaking below channel.

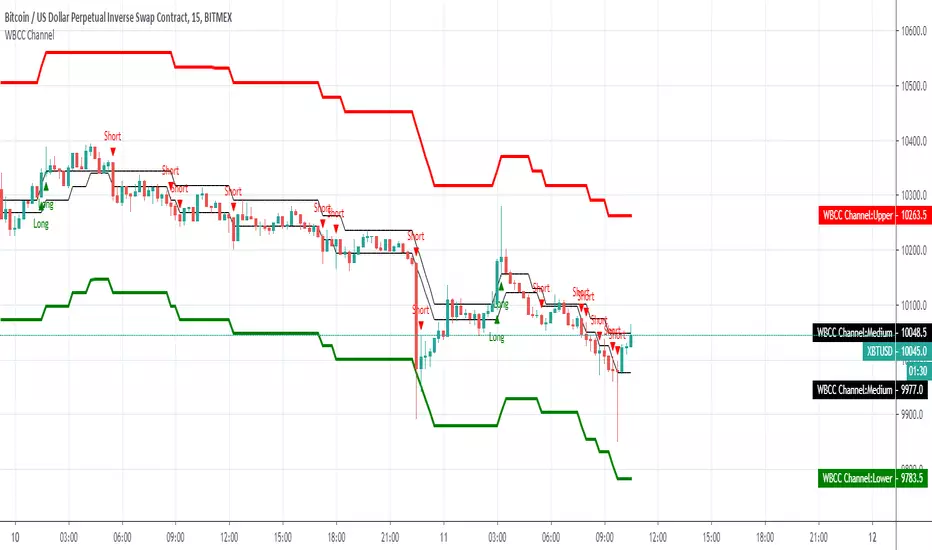
WBCC ChannelЛюбителям канальных стратегий посвящается. Рекомендуем тайм фрейм 15 минут, коэф. в настройке рекомендуемый 2,5.
Channel strategists are the ones who love channel strategies. We recommend a time frame of 15 minutes, the rate. in the setting recommended 2.5.