BullTrading MTF Chaos Trend WaveRecently I have received very positive private messages about the "BullTrading MTF Chaos Trend Wave"
So I decided to add Multi Time Frame capabilities. For example, for intraday trading (15') you can use the 240´timeframe as a reference for choosing your technical bias.
If you are not familiar with the previous version BullTrading Chaos Trend Wave is used to trade fractal breakouts like the "Alligator"
The difference is that it combines smoothed and reactive algorithms to plot nice moving averages for trend recognition but at the same time filtering the most significant fractals for reversal levels.
Note: Modifying the standard settings except for the timeframe resolution is not recommended
Chaos
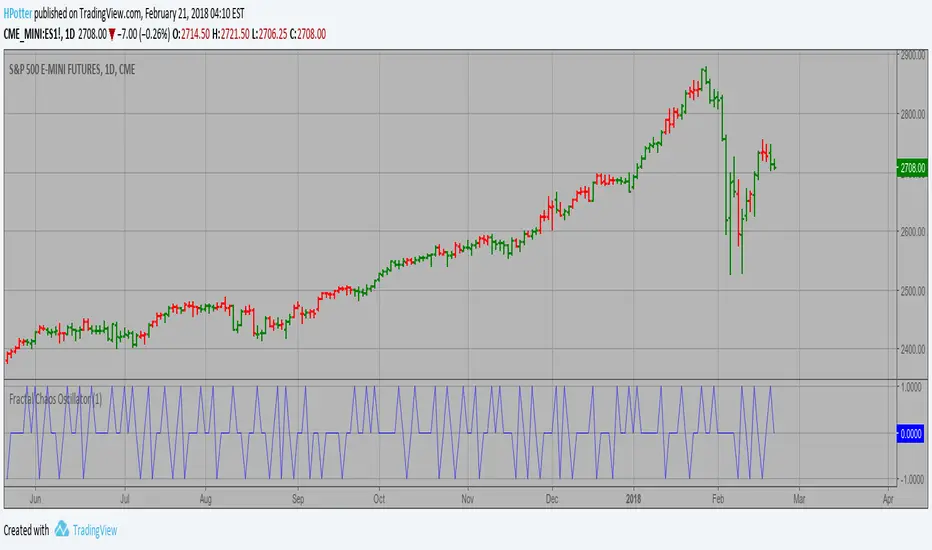
Fractal Chaos Oscillator Backtest The value of Fractal Chaos Oscillator is calculated as the difference between
the most subtle movements of the market. In general, its value moves between
-1.000 and 1.000. The higher the value of the Fractal Chaos Oscillator, the
more one can say that it follows a certain trend – an increase in prices trend,
or a decrease in prices trend.
Being an indicator expressed in a numeric value, traders say that this is an
indicator that puts a value on the trendiness of the markets. When the FCO reaches
a high value, they initiate the “buy” operation, contrarily when the FCO reaches a
low value, they signal the “sell” action. This is an excellent indicator to use in
intra-day trading.
You can change long to short in the Input Settings
WARNING:
- For purpose educate only
- This script to change bars colors.

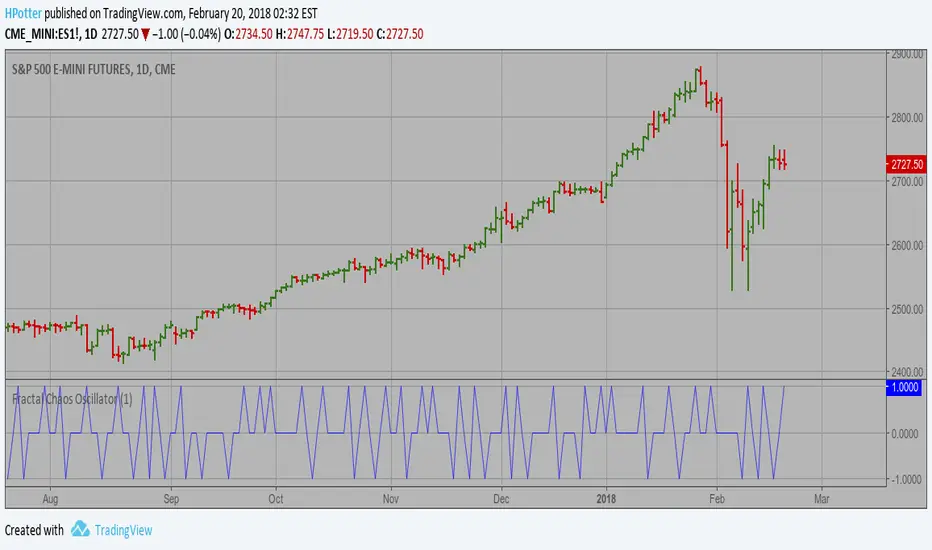
Fractal Chaos Oscillator Strategy The value of Fractal Chaos Oscillator is calculated as the difference between
the most subtle movements of the market. In general, its value moves between
-1.000 and 1.000. The higher the value of the Fractal Chaos Oscillator, the
more one can say that it follows a certain trend – an increase in prices trend,
or a decrease in prices trend.
Being an indicator expressed in a numeric value, traders say that this is an
indicator that puts a value on the trendiness of the markets. When the FCO reaches
a high value, they initiate the “buy” operation, contrarily when the FCO reaches a
low value, they signal the “sell” action. This is an excellent indicator to use in
intra-day trading.
WARNING:
- This script to change bars colors.
Fractal Chaos Oscillator The value of Fractal Chaos Oscillator is calculated as the difference between
the most subtle movements of the market. In general, its value moves between
-1.000 and 1.000. The higher the value of the Fractal Chaos Oscillator, the
more one can say that it follows a certain trend – an increase in prices trend,
or a decrease in prices trend.
Being an indicator expressed in a numeric value, traders say that this is an
indicator that puts a value on the trendiness of the markets. When the FCO reaches
a high value, they initiate the “buy” operation, contrarily when the FCO reaches a
low value, they signal the “sell” action. This is an excellent indicator to use in
intra-day trading.
Fractal Chaos Bands Backtest The FCB indicator looks back in time depending on the number of time periods trader selected
to plot the indicator. The upper fractal line is made by plotting stock price highs and the
lower fractal line is made by plotting stock price lows. Essentially, the Fractal Chaos Bands
show an overall panorama of the price movement, as they filter out the insignificant fluctuations
of the stock price.
You can change long to short in the Input Settings
WARNING:
- For purpose educate only
- This script to change bars colors.

Fractal Chaos Bands Strategy Stock market moves in a highly chaotic way, but at a larger scale, the movements
follow a certain pattern that can be applied to shorter or longer periods of time
and we can use Fractal Chaos Bands Indicator to identify those patterns. Basically,
the Fractal Chaos Bands Indicator helps us to identify whether the stock market is
trending or not. When a market is trending, the bands will have a slope and if market
is not trending the bands will flatten out. As the slope of the bands decreases, it
signifies that the market is choppy, insecure and variable. As the graph becomes more
and more abrupt, be it going up or down, the significance is that the market becomes
trendy, or stable. Fractal Chaos Bands Indicator is used similarly to other bands-indicator
(Bollinger bands for instance), offering trading opportunities when price moves above or
under the fractal lines.
The FCB indicator looks back in time depending on the number of time periods trader selected
to plot the indicator. The upper fractal line is made by plotting stock price highs and the
lower fractal line is made by plotting stock price lows. Essentially, the Fractal Chaos Bands
show an overall panorama of the price movement, as they filter out the insignificant fluctuations
of the stock price.
WARNING:
- This script to change bars colors.

Fractal Chaos Bands Stock market moves in a highly chaotic way, but at a larger scale, the movements
follow a certain pattern that can be applied to shorter or longer periods of time
and we can use Fractal Chaos Bands Indicator to identify those patterns. Basically,
the Fractal Chaos Bands Indicator helps us to identify whether the stock market is
trending or not. When a market is trending, the bands will have a slope and if market
is not trending the bands will flatten out. As the slope of the bands decreases, it
signifies that the market is choppy, insecure and variable. As the graph becomes more
and more abrupt, be it going up or down, the significance is that the market becomes
trendy, or stable. Fractal Chaos Bands Indicator is used similarly to other bands-indicator
(Bollinger bands for instance), offering trading opportunities when price moves above or
under the fractal lines.
The FCB indicator looks back in time depending on the number of time periods trader selected
to plot the indicator. The upper fractal line is made by plotting stock price highs and the
lower fractal line is made by plotting stock price lows. Essentially, the Fractal Chaos Bands
show an overall panorama of the price movement, as they filter out the insignificant fluctuations
of the stock price.

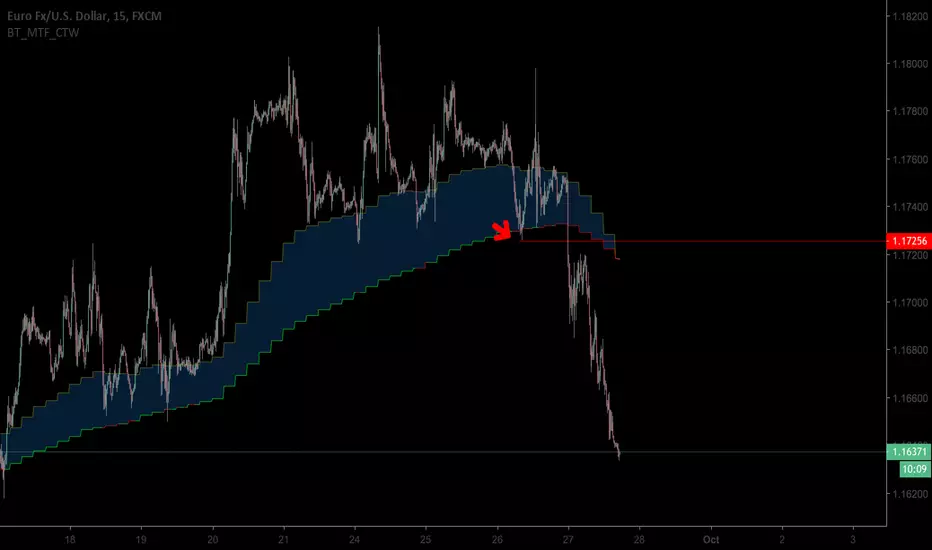
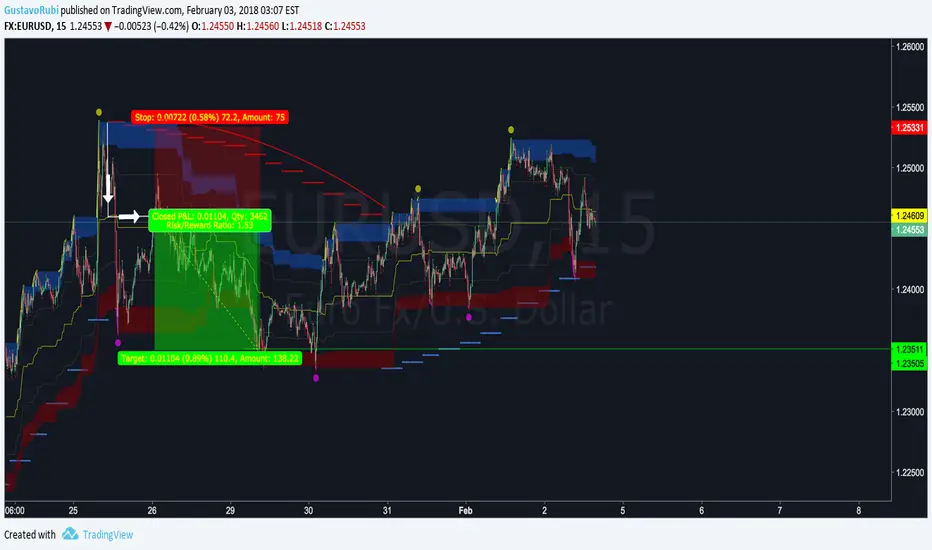
BullTrading 15m Trend master V3.0
BullTrading 15m Trend master V3.0 is a Retracement Trading System that filters main trends with minimum lag. This trading system is based on Transient Zones Theory, Market Makers Theory and Fractals.
BullTrading 15m Trend master V3.0 is alert friendly and works on any financial instrument.
White lines and arrows are manually drawn to show how to calculate the Optimum Entry Levels.
Initial SL is calculated by adding 3 pips to the nearest BullTrading Parabolic SAR line.
TP 1 formula is calculated by multiplying by 1.5 the initial SL pips.
TP 2 is Open and trailed 3 pips above the last BullTrading Parabolic SAR line.
BE is set after reaching the initial SL pips or by trailing the last BullTrading Parabolic SAR line plus 3 pips.
Hurst Exponent Market Phases [DW]This study is an experiment designed to identify market phases using changes in an approximate Hurst Exponent.
The exponent in this script is approximated using a simplified Rescaled Range method.
First, deviations are calculated for the specified period, then the specified period divided by 2, 4, 8, and 16.
Next, sums are taken of the deviations of each period, and the difference between the maximum and minimum sum gives the widest spread.
The rescaled range is calculated by dividing the widest spread by the standard deviation of price over the specified period.
The Hurst Exponent is then approximated by dividing log(rescaled range) by log(n).
The theory is that a system is persistent when the Hurst Exponent value is above 0.5, and antipersistent when the value is below 0.5.
The color scheme indicates 4 different phases I found to be significant in this formula:
- Stabilization Phase
- Destabilization Phase
- Chaos Increase Phase
- Chaos Decrease Phase
This script includes two visualization types to choose from:
- Bar Counter Mode, which displays the number of bars the exponent is consecutively in each phase.
- Hurst Approximation Mode, which displays the approximated exponent value.
Custom bar colors are included.
Please note: This is a rough estimate of the Hurst Exponent. It is not the actual exponent. Numerous approximations exist, and their results all differ slightly.

BullTrading Parabolic Trend ThetaBullTrading Parabolic Trend Theta
BullTrading Parabolic Trend is an experimental Indicator that filters main trend with minimum lag. The secondary filter smooths Parabolic Sar signals. Entries are based on Transient Zones Theory, Market Maker Theory and Fractals
Theta version use different parameters and displays
BullTrading Parabolic Trend . Beta BullTrading Parabolic Trend . Beta
BullTrading Parabolic Trend is an experimental Indicator that filters main trend with minimum lag. The secondary filter smooths Parabolic Sar signals. Entries are based on Transient Zones Theory, Bill Williams Alligator, Fractals and Elliott Wave Oscillator.
Beta version use different parameters and displays

BullTrading Elliot Wave OscillatorThis alert friendly oscillator is useful to count Elliott Wave and alert zero crossovers.
Momentum is displayed with colors.

BullTrading Chaos Trading System V3.0
BullTrading_CTS is not an indicator, it is complete trading system based on chaos theory. BullTrading_CTS provides the trader with all information required for high probability setups including:
·Recurrent Price Levels (zones the price of a security most likely will revisit in future).
·Mayor Fractals (BT_CTS confirms the more relevant fractals for a given timeframe helping the trader to identify Entry and Stop Loss levels accordingly to new incoming Chaos). Standard settings are configured for day trading using 1m charts (approximately 2-3 setups per day on each Forex Mayor Pair trading with a low spread ECN broker for an average gain of 5 pips per trade, although it can be used for swings and macro trades using the 5 minutes to H1 charts or any other timeframe).
In order to use successfully this trading tool training material is required and will be released shortly. Thanks for your patience.

Bill Williams Divergent BarsBill William Bull/Bear divergent bars
See: Book, Trading Chaos by Bill Williams
Coded by polyclick
A bullish (green) divergent bar, signals a trend switch from bear -> bull
-> The current bar has a lower low than the previous bar, but closes in the upper half of the candle.
-> This means the bulls are pushing from below and are trying to take over, potentially resulting in a trend switch to bullish.
-> We also check if this bar is below the three alligator lines to avoid false positives.
A bearish (red) divergent bar, signals a trend switch from bull -> bear
-> The current bar has a higher high than the previous bar, but closes in the lower half of the candle.
-> This means the bears are pushing the price down and are taking over, potentially resulting in a trend switch to bearish.
-> We also check if this bar is above the three alligator lines to avoid false positives.
Best used in combination with the Bill Williams Alligator indicator.

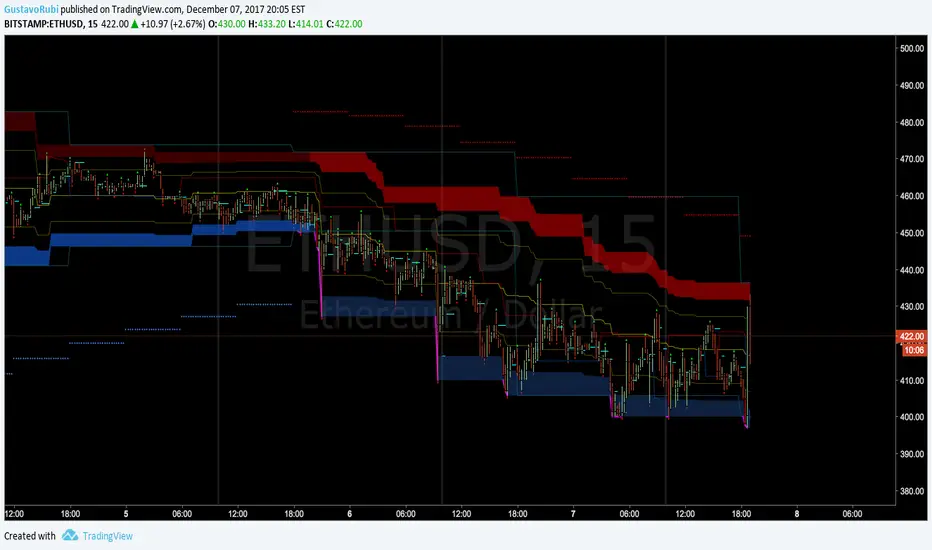
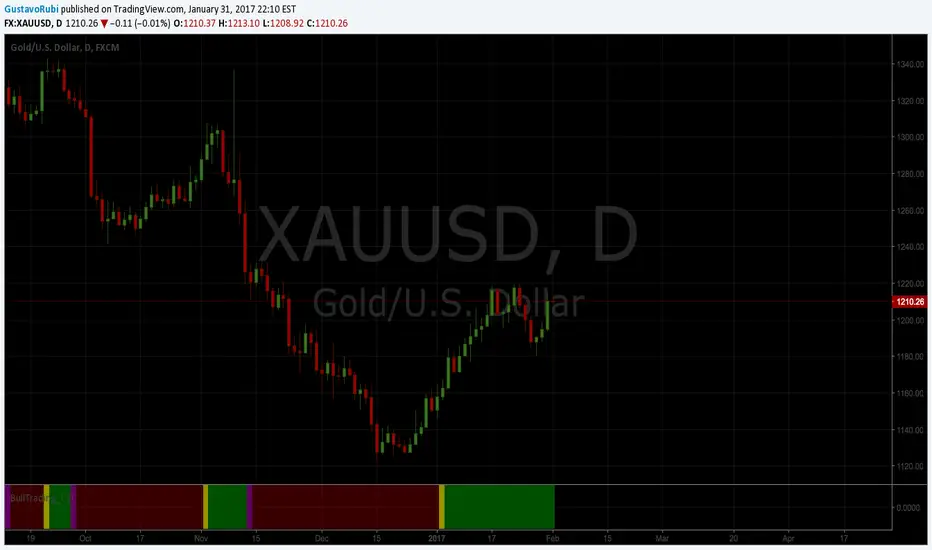
BullTrading Chaos Trend IndicatorThis Indicator based on Mandelbrot Chaos Theory clearly shows Trends and Swings as a colored strip in the bottom of your screen. It does not repaint, work well in all timeframes and it is alert friendly.
Adjust colors and brightness and use it in conjunction with your trading system.

BullTrading Chaos Trend IndicatorThis script clearly shows trends. Add it to your charts, adjust colors and brightness and apply your trading method accordingly. It does not repaint and work well in all timeframes.
Williams Gator Oscillator 2Based on @Petros Williams Gator Oscillator script
Modifed by @PolarSolar - fix histogramm offset to original and added different colors to more understanding Gator histogramm
The Gator Oscillator histogram above zero shows the absolute difference between blue and red lines of Alligator indicator,
while histogram below zero shows the absolute difference between red and green lines.
There are green and red bars on the Gator Oscillator histograms.
A green bar appears when its value is higher than the value of the previous bar.
A red bars appears when its value is lower than the value of the previous bar.
Gator Oscillator helps to better visualize the upcoming changes in the trends: to know when Alligator sleeps, eats, fills out and is about to go to sleep.

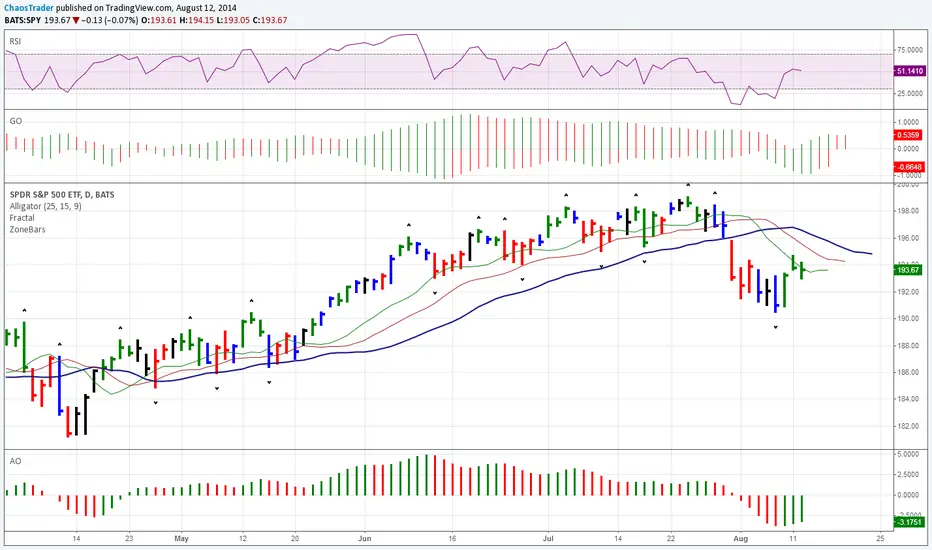
Chaos 2.0This is pure chaos!
I just wanted 1 thing I can put on a chart to try to get a clearer picture of what is going on (and not take up all the indicator spaces a free user is allowed haha)
Many things going on from so many different users
honestly I'm sorry I cant shout out everyone whose code I have ever read and used in another project just for the sake of learning more about pinescript!
As a way of shouting everyone out! (and giving out my most useful and configurable system)
I give you... CHAOS
I originally got an Alligator, AO, and Fractal script from a user ChaosTrader, then realized I love using averages!
I added the MESA (lazybear?) and the McGinley Dynamic Range (sry idk) and a simple 233 SMA.
I also found about something called the www.prorealcode.com another user had created for Pinescript.
I really liked that script so I adapted it to do the same kind of signal printing for circles and squares (crosses and series)
Check it out tell me what you think and how I can make it better for everyone!
thanks all!
Snoop

True Williams Alligator (Timeframe Multiplier)Modified version of my original "True Williams Alligator (SMMA)" indicator that includes a multiplier to show the alligator (ie elliot wave mode) of higher timeframes. See original indicator for details.
Note: First script submission. Didn't mean to use this chart. Ugly and messy. Oops.
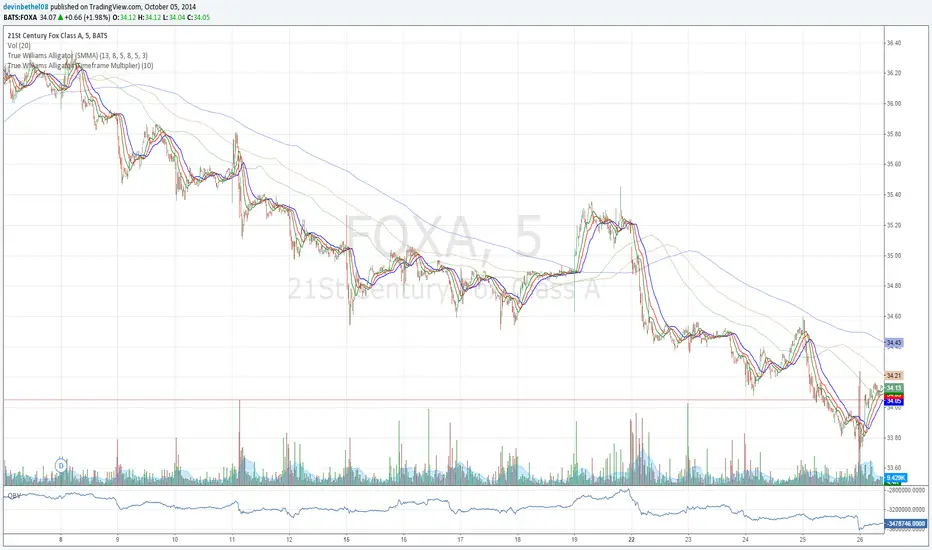
True Williams Alligator (Timeframe Multiplier)Modified version of the true alligator indicator (ie SMMA) that features a timeframe multiplier so that you can monitor the elliott wave of higher timeframes. (See original "True Williams Alligator" for more details.)
Note: First script submission. Didn't mean to use this chart. Also this is a duplicate post -- oops.

True Williams Alligator (SMMA)The built-in implementation of the alligator is incorrect. It uses SMA with altered input parameters to approximate the true alligator indicator.
The alligator was created with a supercomputer to model the elliott wave - it's very apart from other MA techniques. The built-in approximation (and similar techniques) and the true alligator yield very different conclusions. Hence the need for this, a true and exact implementation of "The Mighty Alligator" (Bill Williams, Trading Chaos 1, New Trading Dimensions, Trading Chaos 2).
Note: First script submission. Didn't mean to use this chart. Ugly and messy. Oops.

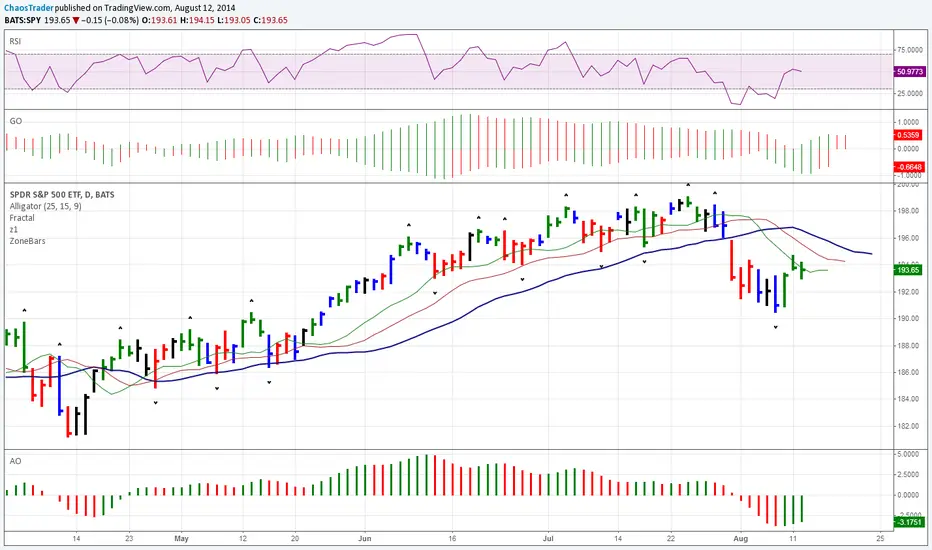
ZoneBarsBill Williams Zone and Squat Bars. See New Trading Dimensions by Bill Williams, PhD.
Bars are green (green zone) when the Awesome Oscillator and Accelerator/Decelerator are both positive.
Bars are red (red zone) when the Awesome Oscillator and Accelerator/Decelerator are both negative.
Bars are blue when a squat bar is formed, these indicate a battle between bulls and bears and often happen near trend continuation or trend changes.
Caution: Assumes chart is a bar chart - not a candle chart.
Caution: Squat bars are accurate only with official exchange volume data - BATS data will give false squat bars.