NPetro V10.12 for CL, ZL and ZC (Delayed Graph)NPetro V10.12
There are 6 key point in this indicator which are :-
•Lines
•Ticks Status
•Volume Strength
•ACV+ & Arrows
•Gap Remover
•Entry Point
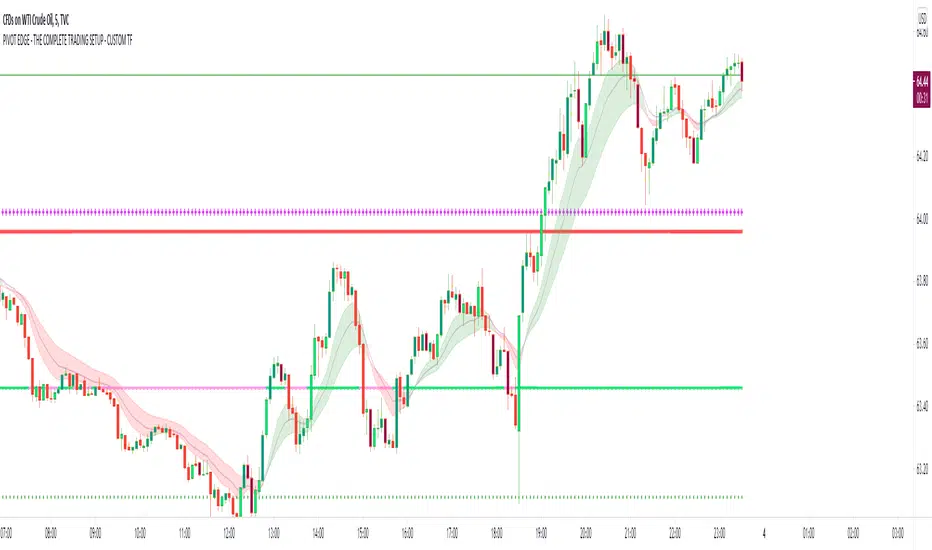
Lines
There are 5 lines that represent Support and Resistant as the guidance in determining market direction.
Purple line, Blue line, Green line, Yellow line and Bollinger band line.
•Purple line represent volume base SnR .
•Blue line represent short term SnR .
•Green line represent long term SnR .
•Yellow line represent current market movement.
•Bollinger Band is to identify sideway market.
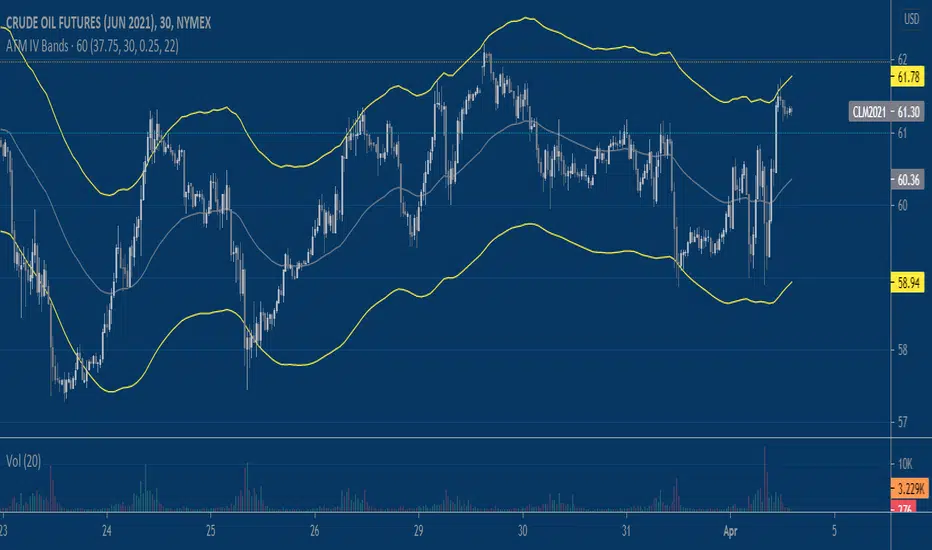
Ticks status
Ticks status is a status label that shows todays movement from the lowest and movement from the highest
•Going Up - total movement from the lowest of the day to current price.
•Going Down - total movement from the highest of the day to current price.
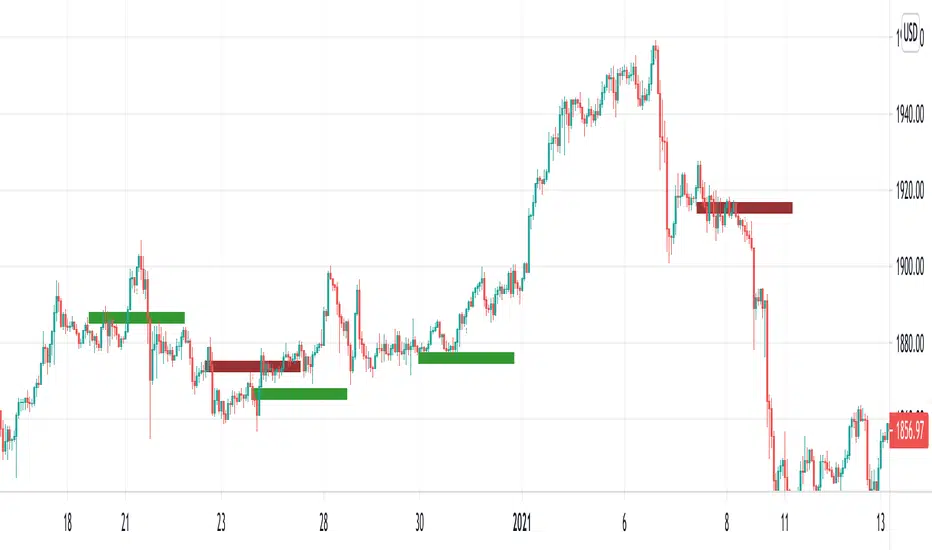
Volume Strength
Strong Volume Strength is shown as Purple or Blue candle.
•Purple Candle - shows strong volume pushing the price down.
•Blue Candle - shows strong volume pushing the price up.
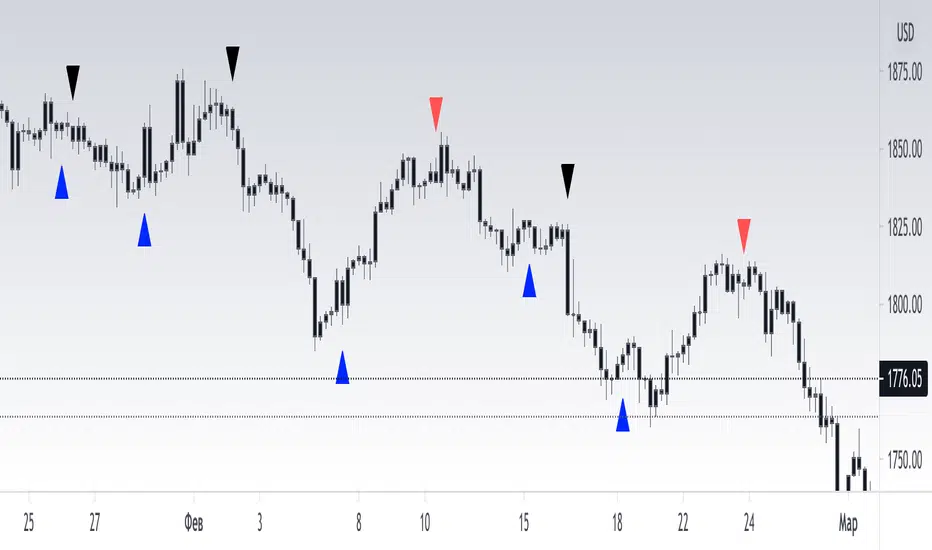
ACV+ & Arrows
Accumulated Volume + is a tools that combine Relative Strength of volume and price together to evaluate Overbought and Oversold conditions.
•Purple Arrow - Displayed when Purple candle appeared and Relative Strength of volume changes in ACV+ move above Overbought value.
•Blue Arrow - Displayed when Blue candle appeared and Relative Strength of volume changes in ACV+ move below Oversold value.
Recommended Timeframe
TF 3min (Confirmation TF)
Indicatore Pine Script®