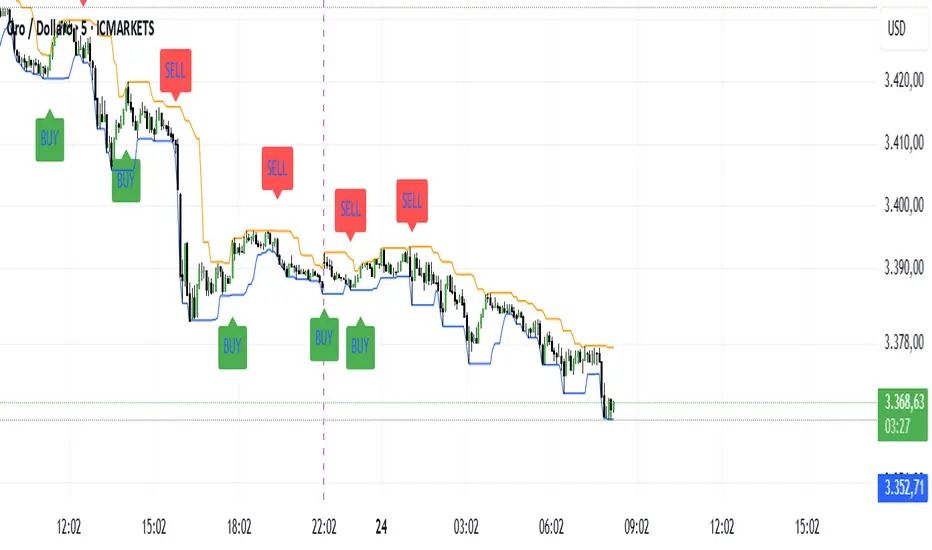
Full Swing Gold Vwap Macd SMO StrategyThis is a full strategy designed for gold market using 12h timeframe chart.
Its components are:
VWAP monthly
SMO oscillator
MACD histogram
Rules for entry:
For long: when enter when close of the candle is above vwap monthly, current histogram is higher than the previous one and SMO oscillator is above 0
For long: when enter when close of the candle is below vwap monthly, current histogram is lower than the previous one and SMO oscillator is below 0
Rules for exit:
We exit the trade if we get a reverse condition.
We also exit the trade based on a risk management system, both for SL and TP using % movements.
If you have any questions let me know !
Materie prime
{Gunzo} Stock to Flow (Gold, Silver, Dollar, Bitcoin)This indicator displays the Stock to Flow (S2F) ratio for popular commodities (Gold, Silver, Dollar, Euro, Bitcoin, Ethereum) in order to
compare them and determine which ones could be a good Store of Value (SoV).
OVERVIEW :
Stock to Flow is a popular indicator used to predict commodities scarcity. It evaluates the total stock of a commodity against the total amount that can be produced during a year. This model supposes that if scarcity is increasing, the price is going to increase.
This model has been used over the last years on Bitcoin to determine if the asset was undervalued or overvalued, and even make prediction models on the future price.
This script is going to focus on the Stock to Flow ratio (total stock/amount produced) to compare the following assets over time :
Mining resources (mined) for Gold and Silver
Cryptos assets (mined) for Bitcoin and Ethereum
FIAT currencies (banknotes printed) for Dollar and Euro
CALCULATION :
The calculation of the Stock to Flow ratio evaluates the total stock of a commodity produced against the production made for a specific year. The data is calculated on a yearly basis, then interpolated to get monthly or daily values.
DATA ORIGIN :
The main information needed to calculate the Stock to Flow ratio is the "yearly production" of a commodity. I tried to retrieve that information from the most reliable sources :
for Gold from research on www.gold.org
for Silver from research on www.silverinstitute.org
for Ethereum from research on etherscan.io
for Bitcoin from data source "QUANDL:BCHAIN/TOTBC" from www.quandl.com
for Dollar from research on www.federalreserve.gov
for Euro from research on www.ecb.europa.eu
SETTINGS :
Smoothing for interpolated data : Smoothing factor for assets that are calculated yearly and then interpolated (Gold, Silver, Dollar, Euro, and Ethereum)
Smoothing for non interpolated data : Smoothing factor for assets that are calculated daily and not interpolated (Bitcoin)
Display asset names : Display assets names in a colored rectangle on the right side of the chart
Display asset values : Display assets Stock to Flow ratio in a colored rectangle on the right side of the chart
Display key events for assets : Display important events for the assets at the bottom of the chart using the same color as the assets lines (for example Orange diamond is a Bitcoin halving). Please refer to the script code for the details of all events.
USAGE :
This script can be used on any asset available on TradingView as the data used is either static or external.
However I recommend using it the Gold asset from currency.com as the depth of the chart will be bigger (since 1980s).
It is recommended to used this script on the monthly timeframe as the chart data is calculated yearly and then interpolated.
Lumber to Gold ratioDISCRIPTION:-
Lumber to gold ratio helps to predict up upcomming market correction as investors are flocking towards safe heaven.
USE CASE SCENARIO:-
If the ratio is above the zero horizontal line it is a risk of scenario
If the ratio plunge below zero it might show imminent market correction.
Sideways detection bollinger bandsSideways detection indicator using Bollinger bands .
In this case we take the original ratio between lower and upper and we smooth it even harder in order to get a better idea about the accuracy of the trend.
If the initial ratio is not between 0 and 1 and the smooth ratio is higher than our selected value, we get an idea if we are a in trending market or not.
Of course using it as a standalone has no usage, and it has to be combined with other tools like moving average, oscillators and so on.
IF you have any questions let me know
[astropark] price levels lightDear Followers,
today I'm glad to present you an light version indicator of my "price levels" one that you can see here below:
It's a great analysis tool, for both scalpers, day traders and swing traders, and it works on every timeframe, market and pair .
I suggest you so check-out previous version indicator's description to understand how to use it and why such a tool may be important for your trading journey.
This light indicator puts the focus on following values only:
Monday Range (High - Low - Mid Range)
Weekly Open (which is also Monday Open)
Monthly Open
Yearly Open
Yearly Range (High - Low)
Besides it's a light version, it comes with a nice feature, enabled by default: shows only latest value of each type!
This way you will have a very clean chart, as you can skip to see previous not anymore important values, focusing on latest ones.
As in the not-light version, you can:
choose price levels to hide and show
change each level color / thickness / display style (solid or dotted)
choose to show or hide price labels and change their size
This is a premium indicator , so send me a private message in order to get access to this script.
[astropark] Moon Phases [alarms]Dear Followers,
today I'm glad to present you an indicator which calculates Moon Phases and let's you set an alert over it.
This is a public free indicator based on the public one by @paaax:
I added my usual alert system logic, plus some more customization inputs for easy coloring.
The lower the timeframe you use it and set your alerts on, the more precise the alert value you get.
Here below the script for backtesting it:
Enjoy!
-- astropark
SILVER (XAGUSD) TRADING STRATEGY AND SIGNALSSILVER (XAGUSD) TRADING STRATEGY AND SIGNALS
This strategy is designed for Silver OANDA:XAGUSD traders and investors.
This strategy is trend following, taking into account the movement of major stock indices such as the Volatility Index.
This strategy also takes into account the direction of movement of the Gold asset,
in particular, the direction of movement of Gold and changes in the volatility of Gold, as well as the current price of Gold.
This, in combination with the main trading indicators (Moving Average, MACD, RSI),
strengthens our Silver Trading Strategy and increases its efficiency and the percentage of successful trades.
The Silver Trading Strategy is offered for use on the 1 Hour (H1) timeframe and is suitable for active traders with the Silver OANDA:XAGUSD asset.
The Silver Trading Strategy FOREXCOM:XAGUSD is suitable as a complement to your trading system and can help increase the efficiency of your Silver trading.
SWING for GOLD / BITCOIN Hey everyone
I want to share my swing trading system with you.Based on two moving averages coupled to RSI
The options
Shows current trends and entries for trades. Average trade retention 15-20 days
Entries for trades with a crossover of two lines
The percentage of successful test deals XAU/USD for 2010-2021: 69%
[RickAtw] ZONE Trend 3█ OVERVIEW
This indicator tracks current trends. Trends are determined by the zones created for them, the brighter the zone, the higher the probability of a market reversal.
█ FEATURES
The indicator adapts to any market.
You can set your own values for your system
Any timeframe can be used
You can increase the number of zones
█ HOW TO USE
If the market starts to enter the red zone, open buy and hold until the second or third zone.
If the market moves towards the blue zone, we sells and hold until the next zone.
█ The author of the work
Rick Atwood
Financial Astrology Moon LongitudeMoon energy represent the masses, crowds, public places, children and emotions. The transit of the Moon through the zodiacal signs will color the crowd emotional responses that fluctuate based on the elemental qualities of the signs: fire (energetic and impulsive), earth (rigid, static, patient), water (assimilation, transformation, humor fluctuations), air (expansion, fervent, germination).
The daily average speed of the Moon is 13 degrees, for this reason the emotional elemental energy is transforming in average every 2 days and few hours, this mood fluctuations produces the short term instinctive and emotional actions performed by traders that forget the precise mathematical / statistical approach in favor of irrational and emotional impulses.
Based on statistical buy/sell frequency analysis we discovered that for BTC-USD, the Moon is usually bullish in zodiac signs: Aries, Libra, Scorpio, Aquarius and Pisces, the most relevant bullish sign is "Aquarius", from 206 observations in all the BTC-USD price history where Moon was in this sign the 60% of those days the price increased compared to the previous day. The bearish zodiac signs for BTC-USD are: Taurus, Cancer, Leo, Sagittarius and Capricorn, the most relevant bearish sign is "Capricorn".
Interestingly this zodiac sign locations tends to fluctuate during some periods of time and from the last 10 observations of the Moon transiting through Aries we noted that 7 of the 10 observations coincide with a dip, sometimes the Moon in Aries indicate the reversal of the short term trend, this is kind of expected considering that when Moon approaches Taurus the fall becomes more likely due to the fact that Moon in Taurus is a bearish signal.
With this indicator there is unlimited possibilities to explore across different markets and complementing with Moon phases this may be the perfect financial astrology indicator for those intraday traders that keep positions only for few hours.
We encourage you to analyze the Moon zodiac sign cycles in different markets and share with us your observations, leave us a comment with your research outcomes. Happy trading!
Note: The Moon longitude indicator is based on an ephemeris array that covers years 2010 to 2030, prior or after this years the longitude is not available, this daily ephemeris are based on UTC time so in order to align properly with the price bars times you should set UTC as your chart reference timezone.
NPetro V10.12 for CL, ZL and ZC (Delayed Graph)NPetro V10.12
There are 6 key point in this indicator which are :-
•Lines
•Ticks Status
•Volume Strength
•ACV+ & Arrows
•Gap Remover
•Entry Point
Lines
There are 5 lines that represent Support and Resistant as the guidance in determining market direction.
Purple line, Blue line, Green line, Yellow line and Bollinger band line.
•Purple line represent volume base SnR .
•Blue line represent short term SnR .
•Green line represent long term SnR .
•Yellow line represent current market movement.
•Bollinger Band is to identify sideway market.
Ticks status
Ticks status is a status label that shows todays movement from the lowest and movement from the highest
•Going Up - total movement from the lowest of the day to current price.
•Going Down - total movement from the highest of the day to current price.
Volume Strength
Strong Volume Strength is shown as Purple or Blue candle.
•Purple Candle - shows strong volume pushing the price down.
•Blue Candle - shows strong volume pushing the price up.
ACV+ & Arrows
Accumulated Volume + is a tools that combine Relative Strength of volume and price together to evaluate Overbought and Oversold conditions.
•Purple Arrow - Displayed when Purple candle appeared and Relative Strength of volume changes in ACV+ move above Overbought value.
•Blue Arrow - Displayed when Blue candle appeared and Relative Strength of volume changes in ACV+ move below Oversold value.
Recommended Timeframe
TF 3min (Confirmation TF)
PIVOT EDGE - THE COMPLETE TRADING SETUP - CUSTOM TFIntroduction to the Indicator " PIVOT EDGE - The complete trading setup - CUSTOM TF " It means custom timeframe
The Foundation layout for this indicator is based on PIVOT's which are nothing but the most important levels that the price has respected in the past. The values for the pivots are derived from the key attributes of the price in any timeframe such as the OPEN, HIGH, LOW and CLOSE. These define the mood of the price and where it intends to move in relation to the previous range formed. Earlier HIGH - LOW i.e the RANGE indicates the possible movement that a stock can make in the current session and as per the calculated pivots we can possible find out the tentative supports and resistances. In addition to this indicator, It is advisable to use the price action theory which helps in taking a right decision for entries.
This indicator by itself is complete in nature, i.e it guides the user for possible entry levels and the projected targets that we can achieve and also the likely stop loss limit in case the price reverses. So beforehand even before entering into a trade position, the user can ascertain what can be his loss or max profit and then he can chose an optimum position size for favorable results.
The beauty of this Indicator lies in the fact that it can be used for all types of trading like Scalping, Intra day, Swing or Positional and Investments also. It works on all timeframes and across all market segments like EQUITY, COMMODITIES , FUTURES , OPTIONS , FOREX etc.
This indicator can be used for any exchange and any time zone also without any changes or adjustments needed.
Now let us understand the features of this Indicator in detail.
TIMEFRAME - It has options to choose between Day, week and month as timeframe. By default it is set to Day timeframe
DISPLAY MAJOR LEVELS - These are the important support and resistance levels calculated based on the past price data. Most important ones are marked in BOLD RED and BOLD GREEN between which the price tends to move generally.
Apart from these, We have breakout level marked in light green and if price breaks this level we can expect targets upto extended levels and beyond marked in blue.
we also have breakdown level marked in light red and if price breaks this level we can expect targets down up to extended levels and below it marked in blue.
In addition I have coded intermediate target levels that appear in light gray between the extended levels or blue lines. Sometimes when the gap between these targets are huge, price cannot reach the targets and reverses at these intermediate targets. You can use them as targets or trailing stop loss based on your plan
DISPLAY HIDDEN LEVELS - These levels are intermediate supports and resistances that can be used whenever the present day indicated range is very wide. Whenever we have an explosive moments in market the range of that day is very huge and so he next day support and resistance band becomes very wide indicating the sideways movement day within that range. And on those days we can switch on the hidden levels and the price respects these levels and most of the days it is inside this range only.
DISPLAY PREVIOUS HIGH / LOW / CLOSE - I have included Daily / Weekly and monthly levels. It is important to know the earlier highs / lows and close since price respects it very must just like support and resistance .
PEMA - This is an important EMA based indicator which potentially indicates curves of support and resistance during retracements or pullbacks. If the curves are breached then the trend is reversed and the price will tend to move to the next pivots .
IMPORTANT NOTE : This indicator does not guarantee any favorable results nor protect your from any loss. You own the complete risk of your trades. It is suggested that you use this indicator and do back testing for considerable period to understand how it works the the potential win rate it can give. If you have any doubts or need any clarifications of assistance in understanding, you can message me and I will try to help.
Happy and Safe trading - Mohan from PIVOT EDGE
Swing or scalping GOLD [RickAtwood] Swing or scalping - automatically determine the currently active trends. Various moving averages are used. It is also designed for any type of trader from scalping to swing.
The key 3 moving averages are designed to identify support and resistance. If the price bounces off them, boldly open and place a stop of 10-20 pips(currency pairs)
Functional
buy ---> green candles
sell ----> red candles
There are alerts for buy and sell based on crossovers
If the price is above the cloud then buy. If the price is below the cloud then sell. The main thing is to open deals only at the very beginning when the price starts to leave the cloud. Also, your stops will be minimal.
When testing this system, we opened 750 trades manually. Success rate of 71% for currency pairs and for gold
P.s If you have any questions about how to open, how to close deals. Always write to me, I will help you) Success to all.
T3 Gold Sniper [RickAtw]Gold Sniper based on support and resistance looks for a sniper entry for trades. Used together with EMA
Key signal
Buy ------> Green Line
Sell ------> Red Line
Functional
The system was made for gold and everything is tuned for it.
I am a professional investor and I test each system for how long. If the system makes an income, it gets to my page. Use it for gold, cryptocurrencies and pairs AUD/USD GBP/USD
Full CRYPTO pack macd, rsi, obv, ema alert versionThis is the indicator version of a simple, yet very efficient crypto strategy, adapted to 4h time frame, on big coins like ETH and BTC . However it can be adapted to other markets, timeframes etc
For this strategy I use a combination of a trend line , an oscillator, price action and volume .
This study has alert for both long and short entries/exit.
The rules are the next ones:
Long : we check that current candle is ascending and above the moving average, the macd is in positive range, rsi is below overbought level and volume is bigger than the moving avg of volume .
For short, we have the opposite long rules.
If you have any questions, please let me know !
Full CRYPTO pack macd, rsi, obv, ema strategyThis is a simple, yet very efficient crypto strategy, adapted to 4h time frame, on big coins like ETH and BTC. However it can be adapted to other markets, timeframes etc
For this strategy I use a combination of a trend line, an oscillator, price action and volume.
This strategy has both the opportunity to go long and short.
As well, it has a leverage simulator .
The rules are the next ones:
Long : we check that current candle is ascending and above the moving average, the macd is in positive range, rsi is below overbought level and volume is bigger than the moving avg of volume.
For short, we have the opposite long rules.
If you have any questions, please let me know !
Implied Volatility BandsThis script produces price bands around an EMA based on a manually inputted Implied Volatility. The idea builds on my previous "Implied Move" script which helps visualize the distribution of prices that the market is 'pricing in' via options/implied volatility. It's up to the user to determine the implied volatility level they use, I like using the free version of QuikStrike that you can access via the CME Group website and then update the script's input daily. Another way to use the script is to input the implied volatility based on a forecast that you produce independently. Say implied volatility on June 2021 Crude Oil is 30% and you think it's rich by 2%, you can input 28% into the script to tweak the bands for a declining vol regime.
[RickAtw] T2 Trend Signal GOLDTrend gold signal Ema strategy
The system finds the best entries for a trade. Use in gold, all numbers have been customized for it.
Functional
T2 trend gold is the second version of my trading system. Be sure to check out the first part! This system gives a signal earlier.
Key signals
Buy -----> Blue triangle to buy
Sell -----> Red triangle to sell
Remarks
I personally tested this system on my own trading and it helps me find entries for deals. The main thing is, if consolidation has begun, turn off the system, because the trading range is small at this moment, use oscillators
Thanks to everyone who supports me. Good luck to you friends
MasterChartsTrading Price Action Indicators-6.0These are upgraded MasterChartsTrading Price Action Indicators with future projections
---
How to understand price action.
It is very easy to read price action if you have a reference point. These support/resistance lines are there to help you read where the buyers and sellers are likely to make a stand.
You can also think of these indicators as moving pivot points .
MasterChartsTrading Price Action Indicators show good price levels to enter or exit a trade.
The Blue indicator line serves as a Bullish Trend setter.
If your instrument closes above the Blue line, we think about going Long (buying).
For commodities and Forex, when your trading instrument closes below the Red line, we think about Shorting (selling).
For Stocks, I prefer to use the Yellow line as my Bearish Trend setter (on Daily charts ). A stock has to close below the Yellow line first, then rally towards the Red line and top out there. This is where I would short it.
[astropark] Volume AnalyzerDear Followers,
today another awesome Analysis Tool, that you can use for day scalping: Volume Analyzer !
This indicator
works on every market, pair and timeframe
lets you see analysis of a different timeframes using the resolution parameter
has an optional trend colored background (I suggest to disable it if you use a different resolution)
integrates a tape profit strategy based on RSI (you can config it and enable/disable it)
lets you setup alarms on bull/bear signal as well as on TP RSI-based signals
I prefer to use this indicator in my day trading on low timeframes , like 5m - 15m - 1h, as you can have access to a more detailed volume information, but it works on high timeframes too as you can see in examples at the bottom of the description.
I truly think that Volume says a lot about future price action, as stated in my Cumulative Volume Delta (CVD) indicator, which you can find here below:
In this indicator, I'm much more interested in the bullish or bearish effect of volume generated by traders and following price action.
Be sure to understand that at current status this is not a complete automated strategy, but an analysis tool which aims to give you a positive bias, a profitable hedge in your trading journey.
As I always say, all tools are great if you use them correctly: this is not the "Holy Grail", so always use proper money and risk management strategies.
This indicator quite often calls bottoms and tops , most of the times it announces a coming reversals , sometimes it fails too of course.
Check this screenshot to have a clear idea of what I'm talking about:
You are supposed to discard signals of the same type that comes later and at a worse price (related to the trend) or you can use to re-fill your still-open position, using it as a re-entry.
You are supposed to act at first signals and average up/down if price goes against you when a new bear/bull signal appears at a better price.
Here it is another element you must consider: price action can deny a reversal stated by volume analysis .
In these cases, you must apply a stop loss in your trade and reverse your position. Don't average up/down your entry.
The reason in this screenshot below:
As you can see, the local downtrend was broken, as it was a simple pullback, previous bull trend was restored and price went up a lot!
The indicator here detected bears rejecting the run-up as much violently as they could, but that was a pullback, nothing more than that: main bull trend was still intact.
Another important advice: don't be greedy, always remember to take profits ! Avoid turning a winning trade into a losing one, which is a common mistake traders do.
That's why I decided to include an RSI based Take Profit algorithm inside:
when background is colored by green (and you can't see any bull signal), then you are in over bought region: start taking profits on you buy/long position or close it or set a trailing stop or a stop loss in profit!
when background is colored by red (and you can't see any bear signal), then you are in over sold region: start taking profits on you sell/short position or close it or set a trailing stop or a stop loss in profit!
when price is in a big overbought or oversold region, then you can see a "ob" label or a "os" label respectively
if you are in a bullish trend (you can see it from the trend colored green background as last signal was a "bull" one), "ob" becomes a clear "tp" - Take Profit advice
if you are in a bearish trend (you can see it from the trend colored red background as last signal was a "bear" one), "os" becomes a clear "tp" - Take Profit advice
Here some examples how you can use the signals produced by the indicator in order to be a successful trader.
I circled with pink signals you as supposed to take, then with a "$" pink backgrounded region where you are supposed to take profits, I finally put an X on failing signals, where you would theoretically have been stopped-out.
GBPUSD, 15m
ETHUSD, 1h
TSLA, 5m
BTCUSD, 15m
XAGUSD, 1h
EURUSD, 15m
SPX500, 1h
ETHUSD, 1D
ETHBTC, 6h
This is a premium indicator , so send me a private message in order to get access to this script.
Mayfair GoldGold Oscillator using SPX & DXY to measure the moving average cross of the 3.
Gold in Orange
DXY in Green
SPX in Blue
To use this indicator, you need to see the strength (Orange above the 50%) line, use your own configurations and settings for the two MA's as a cross.
The idea is not to enter trades but to know when either SPX or/and DXY is getting stronger or weaker to help with profit-taking of gold positions.
As per any Oscillator - look for patterns, cross-overs and momentum shifts. (Treat like a MACD, RSI or Stochastic).
Rate ConverterThis is a simple rate converter that can convert almost anything into almost anything else. It supports cryptocurrencies, currencies and most commodities.
On the chart we see the following:
USD (US Dollar) into EUR (Euro) as a candle stick chart
WTICO (West Texas Intermediate Crude Oil) into ISK (Icelandic Krona) as a bar chart
ADA (Cardano) into JMD (Jamaican Dollar) as a line chart
XPT (Platinum) into XAG (Silver) as a scatter plot
It supports plotting the rates as japanese candlesticks, bars, lines, or as a scatter plot.