Strength Comparison @joshuuuexample:
if you want to find the stronger/weaker pair between eurusd and gbpusd, what you can do is check the eurgbp charts. if eurgbp is bullish, that means, that longs longs on eurusd are better than on gbpusd.
Unfortunately, there is no such thing to compare for example usoil with ukoil, or us100 with us500.
That's where this indicator comes in handy. You can choose whatever two symbols you want, that are supported by tradingview and you will get a chart, which shows symbol1/symbol2.
Now you can use normal market structure, or the ema option, to find out the stronger symbol.
This can also help predicting the so called SMT Divergences, taught by ICT.
⚠️ Open Source ⚠️
Coders and TV users are authorized to copy this code base, but a paid distribution is prohibited. A mention to the original author is expected, and appreciated.
⚠️ Terms and Conditions ⚠️
This financial tool is for educational purposes only and not financial advice. Users assume responsibility for decisions made based on the tool's information. Past performance doesn't guarantee future results. By using this tool, users agree to these terms.
Comparison

Smoothing R-Squared ComparisonIntroduction
Heyo guys, here I made a comparison between my favorised smoothing algorithms.
I chose the R-Squared value as rating factor to accomplish the comparison.
The indicator is non-repainting.
Description
In technical analysis, traders often use moving averages to smooth out the noise in price data and identify trends. While moving averages are a useful tool, they can also obscure important information about the underlying relationship between the price and the smoothed price.
One way to evaluate this relationship is by calculating the R-squared value, which represents the proportion of the variance in the price that can be explained by the smoothed price in a linear regression model.
This PineScript code implements a smoothing R-squared comparison indicator.
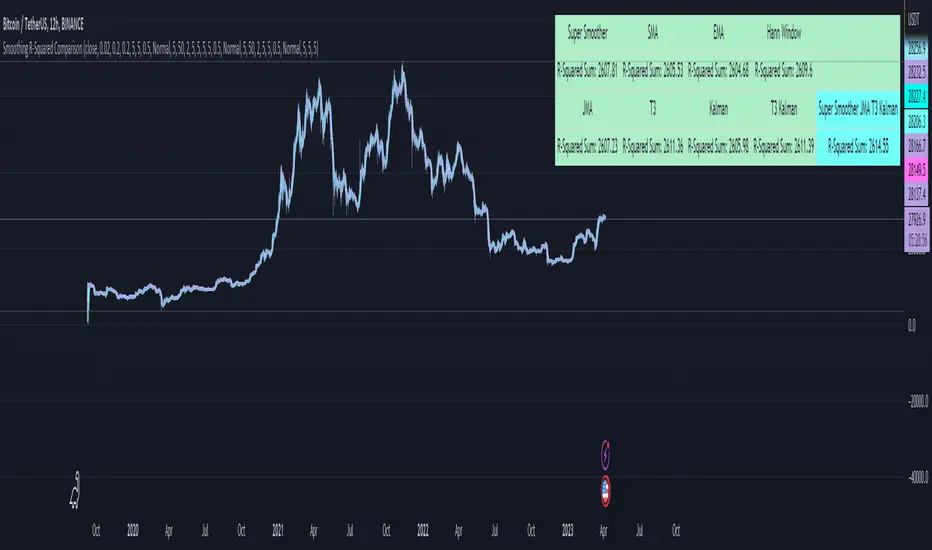
It provides a comparison of different smoothing techniques such as Kalman filter, T3, JMA, EMA, SMA, Super Smoother and some special combinations of them.
The Kalman filter is a mathematical algorithm that uses a series of measurements observed over time, containing statistical noise and other inaccuracies, and produces estimates of unknown variables that tend to be more accurate than those based on a single measurement.
The input parameters for the Kalman filter include the process noise covariance and the measurement noise covariance, which help to adjust the sensitivity of the filter to changes in the input data.
The T3 smoothing technique is a popular method used in technical analysis to remove noise from a signal.
The input parameters for the T3 smoothing method include the length of the window used for smoothing, the type of smoothing used (Normal or New), and the smoothing factor used to adjust the sensitivity to changes in the input data.
The JMA smoothing technique is another popular method used in technical analysis to remove noise from a signal.
The input parameters for the JMA smoothing method include the length of the window used for smoothing, the phase used to shift the input data before applying the smoothing algorithm, and the power used to adjust the sensitivity of the JMA to changes in the input data.
The EMA and SMA techniques are also popular methods used in technical analysis to remove noise from a signal.
The input parameters for the EMA and SMA techniques include the length of the window used for smoothing.
The indicator displays a comparison of the R-squared values for each smoothing technique, which provides an indication of how well the technique is fitting the data.
Higher R-squared values indicate a better fit. By adjusting the input parameters for each smoothing technique, the user can compare the effectiveness of different techniques in removing noise from the input data.
Usage
You can use it to find the best fitting smoothing method for the timeframe you usually use.
Just apply it on your preferred timeframe and look for the highlighted table cell.
Conclusion
It seems like the T3 works best on timeframes under 4H.
There's where I am active, so I will use this one more in the future.
Thank you for checking this out. Enjoy your day and leave me a like or comment. 🧙♂️
---
Credits to:
▪@loxx – T3
▪@balipour – Super Smoother
▪ChatGPT – Wrote 80 % of this article and helped with the research
Quad RSRelative Strength (RS) is an Indicator which measures a Stock's performance as compared to a Benchmark Index or another Stock.
For example: RS will tell you whether “A” is increasing more or less than “B” in any market condition. It is one of the tools which is best suited for Momentum Investing.
How RS can be used as a Momentum Indicator:
RS is used in identifying both the strongest and the weakest stock, or any asset class, within the market. Usually, the stocks which display strong or weak RS over a given time period tend to continue to move in the same direction.
How to calculate Relative Strength:
Divide change of "A" over some time period by the change of a particular index/stock "B" over the same time period.
This indicator oscillates around zero. If the value is greater than zero, "A" has been relatively strong compared to "B", during the selected period; if the value is less than zero, "A" has been relatively weak.
Configuration & Default settings:
The Relative symbol can be Input, default is Nifty50.
Time frame can be set, I recommend setting to Day. Default time frame is set to same as chart.
Four different periods can be set. Default values are 500, 250, 125 & 63. If time frame is set as 'Day', these numbers correspond to 2 years, 1 year, 1/2 year & 1 quarter.
Example chart: NiftyMidCap100 with Quad RS indicator with Nifty50 used as Relative Symbol, Four periods: 500, 250, 125 & 63

MarketronShows you how the asset on the chart is trending versus the market. You can customise the market that it uses, and there are some common markets programmed in as options.
Displays moving averages and a simple red/green bias.
You could do this yourself by typing, e.g., ADAUSDT/TOTAL into the asset box in TradingView and adding some EMAs manually and then interpreting them by eye. There's no hidden technology in this indicator. It just makes it a lot easier.
You can choose various bias options.
I'm not sure if it will work at resolutions lower than one day, depending on the level of your TradingView plan.
These are all the user-configurable settings and what they do.
Market (Auto) – Choose from various preselected markets.
Market Ticker Manual Override – You can type in the ticker for your market if it's not in the list. If you do, it overrides the Auto list.
Show Classic EMAs – Show customisable Exponential Moving Averages.
Bias Mode – Derive the red/green bias from whether price is above/below the Classic EMAs, or from a custom EMA function, or both.
Show Bias Background – Colour the background, or not, with the directional bias.
EMA 1 Length (smallest) – The length for the smallest EMA.
EMA 2 Length – Length for the second EMA.
EMA 3 Length – Length for the third EMA.

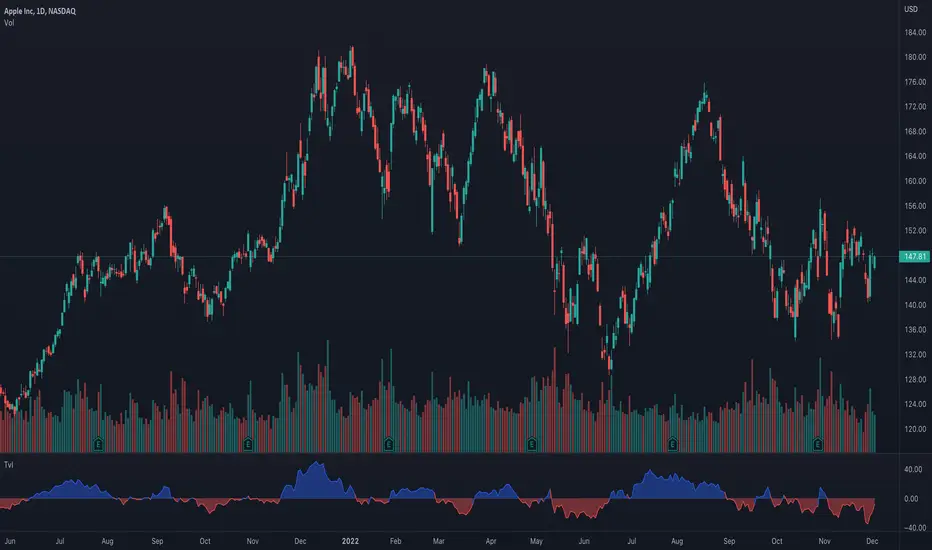
Ticker vs IndexI was exploring a simple idea how I can visualize the ticker performance against the underlying Index (or any other ticker) performance.
how it works:
When the line is moving up (blue zone), the ticker is performing better than the underlying index (e.g. SPX)(configurable).
When the line is moving down (red zone), the ticker is performing worse than the underlying index.
How to use it:
Use as confirmation always in conjunction with other (main) indicators, avoid "buy" when indicator is in the red zone
Also, crossing over the zero line is often an indication for an upcoming upward move
Try to different SMA length - default is 20 but 10 was often showing better results
(No financial advise, for testing purposes only)
FunctionDynamicTimeWarpingLibrary "FunctionDynamicTimeWarping"
"In time series analysis, dynamic time warping (DTW) is an algorithm for
measuring similarity between two temporal sequences, which may vary in
speed. For instance, similarities in walking could be detected using DTW,
even if one person was walking faster than the other, or if there were
accelerations and decelerations during the course of an observation.
DTW has been applied to temporal sequences of video, audio, and graphics
data — indeed, any data that can be turned into a linear sequence can be
analyzed with DTW. A well-known application has been automatic speech
recognition, to cope with different speaking speeds. Other applications
include speaker recognition and online signature recognition.
It can also be used in partial shape matching applications."
"Dynamic time warping is used in finance and econometrics to assess the
quality of the prediction versus real-world data."
~~ wikipedia
reference:
en.wikipedia.org
towardsdatascience.com
github.com
cost_matrix(a, b, w)
Dynamic Time Warping procedure.
Parameters:
a : array, data series.
b : array, data series.
w : int , minimum window size.
Returns: matrix optimum match matrix.
traceback(M)
perform a backtrace on the cost matrix and retrieve optimal paths and cost between arrays.
Parameters:
M : matrix, cost matrix.
Returns: tuple:
array aligned 1st array of indices.
array aligned 2nd array of indices.
float final cost.
reference:
github.com
report(a, b, w)
report ordered arrays, cost and cost matrix.
Parameters:
a : array, data series.
b : array, data series.
w : int , minimum window size.
Returns: string report.

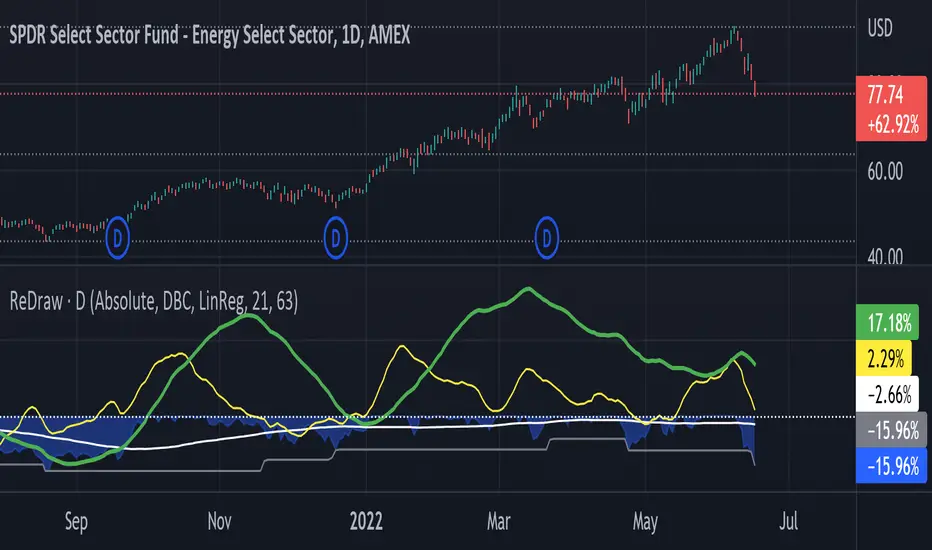
Return & Drawdown
ReDraw script calculates the historical returns and drawdown for the given periods.
By default, the return of the linear regression trends is displayed (can be turned off in settings). In this mode, two linear regression trends are being computed for both long and short periods, and the percent value indicates the "return of the trend" for the corresponding period. Observing the dynamic of the linear regression trends can give a great hint if the trend is slowing down.
When the smoothing method is set to "none" or WMA3/5, the real asset return is shown for both periods, using the formula (LastPrice-FirstPrice)/FirstPrice
The script calculates the maximum drawdown for the long period using the formula (max(Price) - LastPrice) / max(Price).
The white line under the zero is the average maximum drawdown over the long period.
When the mode is set to Compare, ReDraw will display the difference in metrics between the current and selected symbol (SPY by default).
EsIstTurnt's Relative Value Comparison Multi SymbolCompare the relative valuation of up to 8 tickers. By taking a shorter term moving average and dividing by a longer term moving average(optionally with an offset) we get a value that is either above or below 1. Easy to tell what is undervalued and overvalued with this setup. Useful for comparing different asset classes or sector specific securities looking for outperformers/underperformers. Overvalued and Undervalued levels marked by Red and Green background. Recommended in conjunction with other indicators of your choosing for confirmation of trend changes but this is good for getting a broader view of the market you're interested in. Multiple timeframes, sources available however you should tinker with it to find what gives you the best view for your preferred timeframe.

Artharjan Relative StrengthHi Guys,
I have created Artharjan Relative Strength indicator which shows the comparison of a Stock (script) either with Benchmark Index or with its respective sectoral index.
If the Relative Strength value is more than Zero (Above Zero Line) then it means the Stock is outperforming the index and vise-a-versa
A moving average is also added to smooth out data series.
Traders can chose from the Benchmark/Sectoral indices as well as Moving Average Lookback period and moving average type for extra convenience.
If the Relative Strength is strong then trader can look forward to taking bullish trade and Investor can think of investing in that particular script for a long term period (Or as long as Relative Strength line does not cross below zero line)
The Default Lookback period selected is 55 (Fib number) as it covers considerable /sufficient amount of range to find out relative strength of the stock.
The Relative Strength depends on the timeframe you chose... so feel free to adjust the Lookback period from 55 to any other number depending upon your trading/investment timeframe.
Hope you guys would find this indicator useful.
Regards
Rahul Desai
@Artharjan

Relative StrengthRelative strength is a calculation of the price trend of a stock or a financial instrument in comparison to another instrument, stock, or industry. It shall be determined by taking the price of one commodity and dividing it by another.
Relative strength is a strategy used for determining value stocks and is used in momentum investing as well. It involves investing in stocks that have done well, in relation to their index or benchmark. For example, a relative strength investor might pick technology companies that have outperformed the Nasdaq Composite Index or large-cap stocks that are lagging against the S&P 500 index(Adjustable in the settings).
This indiator will give you a plot for relative strength between the current pair with another pair (adjustable in the settings), with a plotshape for RSNHBP & RSNH
Features :
1. Relative Strength
2. Double EMA of Relative Strength
3. RSNHBP & RSNH
How to use it :
1. Adjust All the settings parameter
2. For Alerting, Just use any alert function call, it will give you an alert of RSNHBP and RSNH

Stock Rotation Model [CC]This is an original indicator so a true hidden gem in my opinion. I based this idea off of the work by Giorgos Siligardos (Stocks and Commodities Aug 2012) with his indicator called the Sector Rotation Model. This indicator is best used as a trend confirmation in combination with another indicator such as a leading indicator. This will show you how strong the current stock you are looking at is compared to the S&P 500 which almost everyone uses as a relative strength comparison. Feel free to change the default lengths if you would like as these were just the settings that I liked the best overall. Let me know if you find any good combos that works for most stocks in general. I have included strong buy and sell signals in addition to normal ones so strong signals are darker in color and normal signals are lighter in color. Buy when the line turns green and sell when it turns red.
Let me know if there are any other indicators or scripts you would like to see me publish!

Swing ComparatorHere I bring you an array of methods to compare the swings and consistency between assets.
This indicator is excellent for swing traders and scalpers looking to maximize their profits by examining which of two closely related pairs provides greater price fluctuation during given period.
This indicator works against two assets, which are to be configured in settings.
This indicator has 5 particular plots for you to examine, each which can be considered for you to contemplate which pair for you to next perform a trade on.
First off, let's start with the blue.
The blue is simply a pearson correlation coefficient, thankfully now included in tradingview. This provides a value of 1 as values show to be close correlation, 0 showing no correlation, and -1 showing negative correlation - meaning an increase in one pair correlates to a decrease in another pair. This will turn green when greater than 0.975, showing a very strong relationship between the two pairs, and red when below -0.975. This is the only plot to be interpreted on a scale from -1 to +1.
Next, we have the purple and yellow background plots, followed by the white and green moving averages. Though similar, these are all slightly different.
For each of these 4 plots, a value greater than 0 indicates greater price swings for your Symbol #1, while a value less than 0 indicates greater price swings for Symbol #2.
These calculations are performed on a per bar basis, meaning you're likely going to be examining bars longer than what you'll normally be trading on. Use confluence, as well as your own judgement for this.
For example, if symbol #1 provides a bar with an open value 1% greater or less than close, providing a 1% swing on a given bar, but symbol #2 provides 2%, the indicator will fall down toward the negative, as Symbol #2 had the greater swing.
First, yellow focuses on only open/close bar values, and thus the body of the candlestick.
Purple, on the other hand, focuses on the wicks of the candle - thus, the high/low values. I've opted to make these two different values as a wick focuses on the embodiment within the time period, and body focuses on the open/close instant.
Next, the green is an extended EMA of the purple - High/Low ratio. This is important to examine trend overtime, and reduce unneeded noise.
Lastly, the white is simply difference in the standard deviation of the particular bars, between the two symbols you have selected. The tends to usually tie up with the green pretty well.
Considering this is going to by nature be very noisy datasets, I have included in settings the option to extend an EMA for everything. They have their default settings, but if you'd like to examine the trend without an EMA, feel free to set it to 1 to eliminate its effects.
I have additionally added the ability to introduce clipping, as well as scale the correlation coefficient to remain visible when examining very short term time scales. In the future, I hope to properly normalize all plots to remain within a -1 to +1 basis. Please be patient as I have multiple projects ongoing.
Suggestions and constructive criticism are very well encouraged.
Anyone is welcome to utilize this in their code, as well, i just ask you provide credit.
As you reduce to time frames less than a day, you will likely have to reduce the coefficient min/max closer to 0.025, or just hide it entirely.
TODO:
Make it look better. Sorry, folks.
Introduce latency between pairs.
Examine significance of a coefficient of determination
Remove static weights and introduce z-score and linear normalization.
Consider adding room for a 3rd pair. This could get ugly, however.

Sectors ScreenerThis screener compares the corresponding market sectors in relation to the complete market.
If a sector rises or falls equal to the market, the value is on the dashed line.
If a sector rises faster or falls slower than the market, the sector's line is green and above the dashed line.
If a sector falls faster or rises slower than the market, the sector's line is red and below the dashed line.

ROC vs BTCThis is a modification of my Rate of Change Percentile script, used to compare the current ticker (e.g. Altcoins) to BTC.
Essentially we are looking at (Current Ticker ROC percentile) vs (Bitcoin ROC percentile).
In other words, we are using the ROC value of both the current ticker and BTC, and ranking each based on their previous ROC.
We compare the rankings to gauge the relative overperformance or underperformance of the current ticker vs BTC.
The blue line is BTC, the columns are the current ticker.
Green columns above the blue line indicate positive ROC and current ticker has higher ROC ranking than BTC.
Red columns below the blue line indicate negative ROC and current ticker has a higher ROC ranking than BTC.
*** PLEASE LEAVE A LIKE AND FOLLOW IF YOU ENJOY THE SCRIPT ***
Any questions, comments or feedback I'd love to hear from you below!

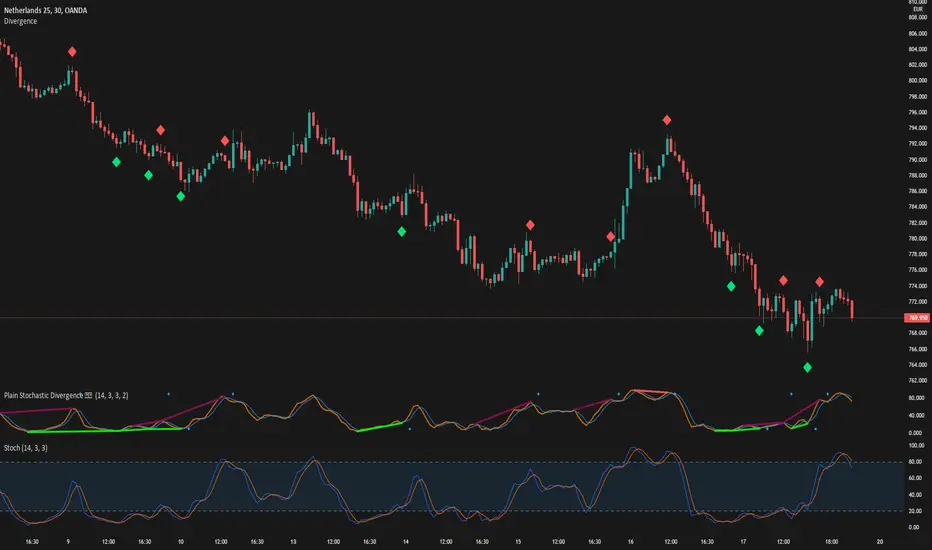
DivergenceLibrary "Divergence"
Calculates a divergence between 2 series
bullish(_src, _low, depth) Calculates bullish divergence
Parameters:
_src : Main series
_low : Comparison series (`low` is used if no argument is supplied)
depth : Fractal Depth (`2` is used if no argument is supplied)
Returns: 2 boolean values for regular and hidden divergence
bearish(_src, _high, depth) Calculates bearish divergence
Parameters:
_src : Main series
_high : Comparison series (`high` is used if no argument is supplied)
depth : Fractal Depth (`2` is used if no argument is supplied)
Returns: 2 boolean values for regular and hidden divergence
I created this library to plug and play divergences in any code.
You can create a divergence indicator from any series you like.
Fractals are used to pinpoint the edge of the series. The higher the depth, the slower the divergence updates get.
My Plain Stochastic Divergence uses the same calculation. Watch it in action.
TEWY - Magic Strength Indicator (SI)Detail about this indicator
1. This indicator is used to identify the trend based on the momentum of the counter selected.
2. This indicator is calculated three different metrics for selected script and it's Parent/Main Index as NSE:NIFTY (default) and Sector Index. Keep in mind below point
a) Parent/Main index is set to default NSE:NIFTY, though there is option to provide your own custom parent index e.g. US30, US 100'
B) Sector Index is identified automatically for set to predefined stocks and rest ate set to default NIFTY 500. Again you have option to change it to your preference
3. I have used the rate of change and RSI of it to calculate momentum for script, it's parent index and sector index.
4. I would typically use this indicator to see momentum on the Monthly and Weekly first and daily timeframe to get proper entry.
5. Also please try to stay in the long position only unless you understand the consequences for shorting a stock . why? because the imminent nature of the market is to go upward only.
6. Please try to keep base inputs as defaults, though it allows you to change input parameters
Let's understand this indicator
• On the tor right corner you would see three different numbers. 1st number is SI of the underlying Ticker. 2nd number is SI for the Sector Index and 3rd is for Parent Index SI.
• If selected ticker is outperforming it's parent index the you see one green "▲" and if ticker is also outperforming it's sector index then you would see two green "▲▲". Same on the downside.
• I would only take long position if selected ticker is at least outperforming Parent index, that means at least one green "▲".
• I would take exit from the position if I see no more green "▲".
Always respect RISKS and follow stop loss. In market stop loss is the only friend of yours.
I have given a sample illustrational image below, which should help you understand this indicator.
Best of luck

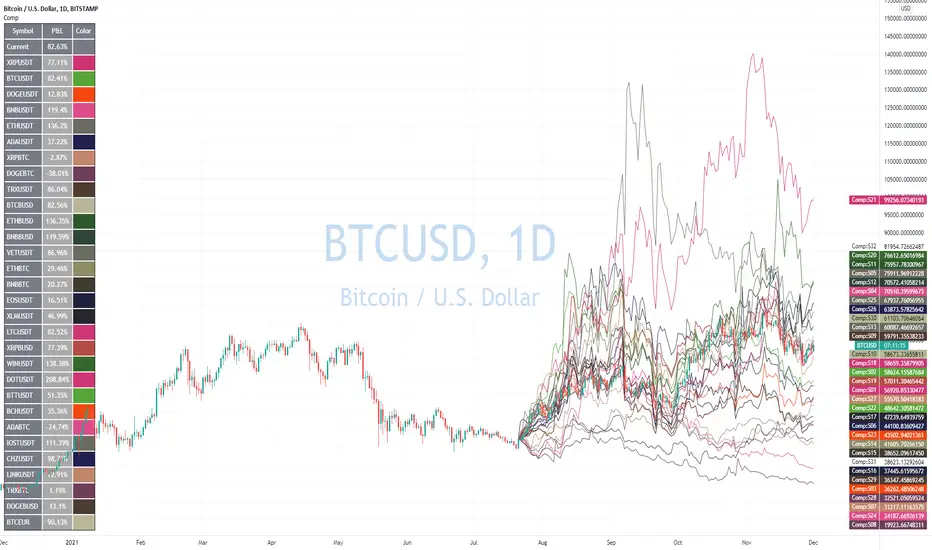
Advanced Comparison ToolWith the new Pine Script features you can build pretty interesting scripts.
Here is my try to expand functionality of basic comparison tool you have in TradingView.
When you apply it on your chart you can select a bar when do you want to start comparing your instrument from.
In parameters you can specify up to 32 symbols to compare. You can also disable symbols and change color for them as well.
As a result you'll see a table with summary and line for every instrument you selected as if it started from the close of the selected bar.
Disclaimer.
Please remember that past performance may not be indicative of future results.
Due to various factors, including changing market conditions, the strategy may no longer perform as well as in historical backtesting.
This post and the script don’t provide any financial advice
LibraryPrivateUsage001This is a public library that include the functions explained below. The libraries are considered public domain code and permission is not required from the author if you reuse these functions in your open-source scripts

Volatility IndexThis indicator is based on Historical Volatility (HV) built-in indicator with minor tweaks to match the Bitcoin Volatility Index (from Bybt).
Also, you can select a symbol to compare its volatility with the volatility of the currently selected symbol.

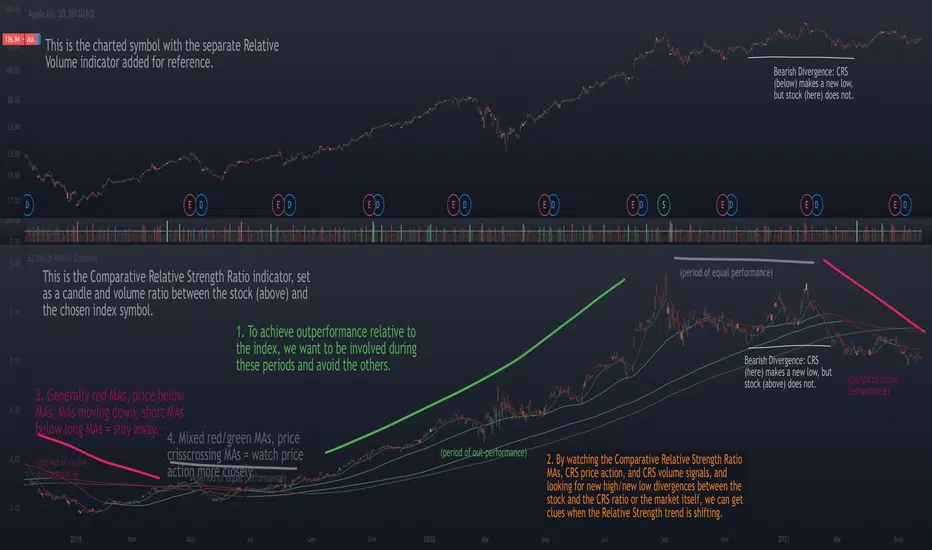
Relative Strength Ratio Chart + Relative Volume Gradient CandlesThe purpose of the Comparative Relative Strength Ratio indicator is to provide a way of looking at a relative strength ratio as a candle graph instead of only a closing price line, as well as to provide relative volume gradient coloration on the ratio-generated candles, and additionally to plot moving averages of the CRS ratio that can help display shifting trends in relative strength.
This is different from my Relative Volume Gradient Paintbars indicator, as well as my Comparison Chart with Relative Volume Gradient Paintbars indicator, in that the first looks at the charted symbol itself, the second looks at an alternate symbol, and this third indicator looks at a ratio between the charted symbol and the alternate symbol.
The idea behind this indicator is to provide additional means of evaluating relative strength, such as comparing the moving averages of the comparative relative strength ratio graph to the charted stock symbol's own MAs in order to gauge strength, comparing the price action of the ratio to that of the individual stock and its index, and comparing the volume gradient signal between the ratio, the stock, and the index.
The unique volume features allow comparing volume as a percent of the index volume, as well as stock's candle range as a percent of the range of the index. So when the volume as a percentage of the index's overall volume becomes high, this can be made to highlight the candles.
Combo Month-to-Month % ReturnA combined version of two already published indicators:
Combo Month-to-Month % Return (January - June)
Combo Month-to-Month % Return (July - December)
Allows to compare an asset's monthly returns over years.
Includes:
Customizable columns
Up to 20 columns per each chart
Customizable Min, Max, Mean, Median and Standard Deviation lines
Customizable labels

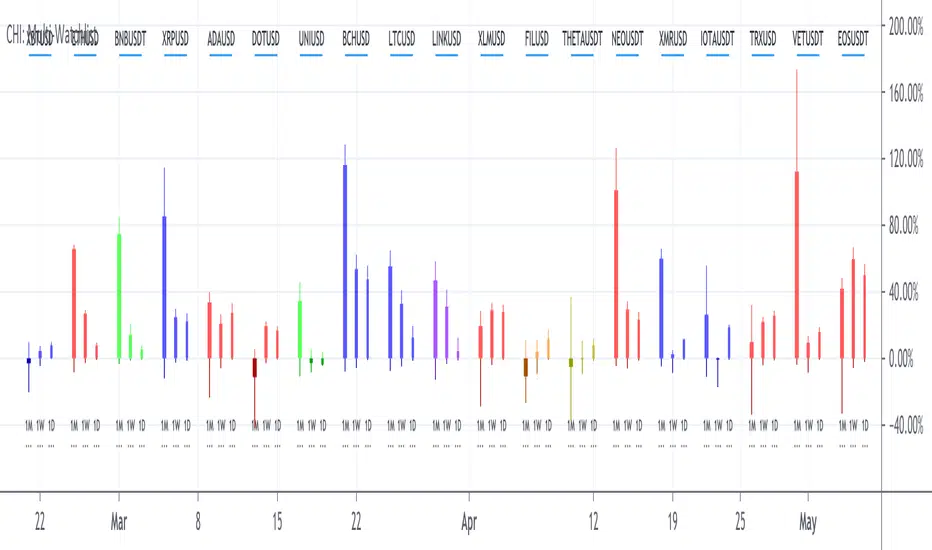
CH-I: Trend - Multi-Timeframe WatchlistWatchlists give only a flat perspective on changes in the market, as they show only the daily change of underlyings and give no comprehensible context to other underlyings and other timeframes to show the bigger picture.
With a cockpit showing price changes of different underlyings over several timeframes at the same time, a real understanding can be developed about shorter term momentum embedded into a longer term trend.
Look how major commodity currencies (in purple) have outrun other major currencies in recent months, but where the biggest losers in the last days as seen below. When now looking at the also displayed chart of the Norwegian Krone against the US Dollar, this gives more context, as the indication clearly shows, that commodity currencies in general have been rising for the last months and startet dropping recently.
By grouping related underlyings with the same kind of representation, it also becomes clear, in which of these sectors the action is gaining or losing momentum.
Here you can see how the major european markets (in green) are currently outperforming most other major markets with the major asian markets (in purple) being the laggards.
Another important benefit is the clear visibility of a shift in focus from one underlying or class of underlyings to another over time, which gives valuable insights into mode changes of differing markets to increase understanding of the current state of the relationships between different markets.
For more than half a year, mid and small caps have outperformed large caps in US equities, as much as Value caps have outperformed Growth caps. Here you see, how the outperformance of Value stocks has been maintained, but the focus shifted from smaller to bigger caps.
The indicator allows up to 20 individually selected ticker symbols classifiable into up to 6 separate groups with up to 12 different selectable time periods (including a custom time period) to be displayed.
The results can be displayed either only as a percentage change from start to end of the corresponding time period as well as additionally with highs and lows in the interval in a candlestick representation.
The output can be ordered by symbols as individually entered as well as by performance for a selectable time period.
For further convenience, a range of predefined sets of symbol is preconfigured to give insights into the development of markets for bonds, commodities, currencies, cryptos, equity markets and the economy without having to manually configure the corresponding symbols into the list of selectable symbols.
Additional details about Open, High, Low and Close values and the exact percentage changes as displayed as well as about selected symbols and allocated groups can be displayed by hovering the mouse over any time period or any symbol.
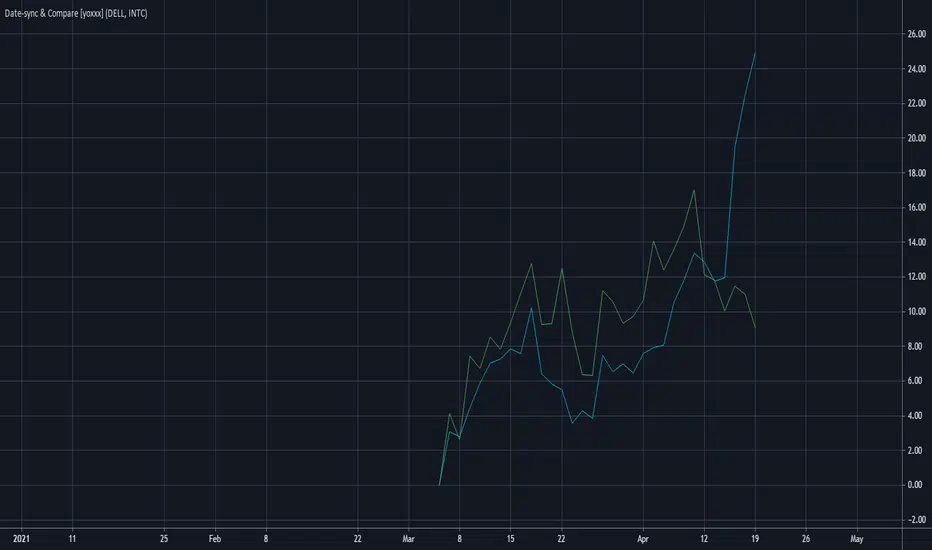
Date-selected Synch and Compare Script Module [yoxxx]This Script is a Convenience Script Module for calculations based or started on a fix time / date.
(In difference to bar_index-based where the reference point is shifting from bar to bar, thus is dynamic).
Purpose examples:
- Comparison by start date
- Time driven studies or strategies
- Measuring from Date of Interest
The script also contains a date input box with the feature of auto-converting the default time to local user time (a newer feature of Tradingview which too me a lot of research to find; so here integrated).
Last not least it the module gives you a ready to go example for multi security comparison on percentage scale with a free selectable start date.
Enjoy
Yoxxx
P.S:. For further notes look at the script code.
They are concerning usage and how avoiding some strange display issues.