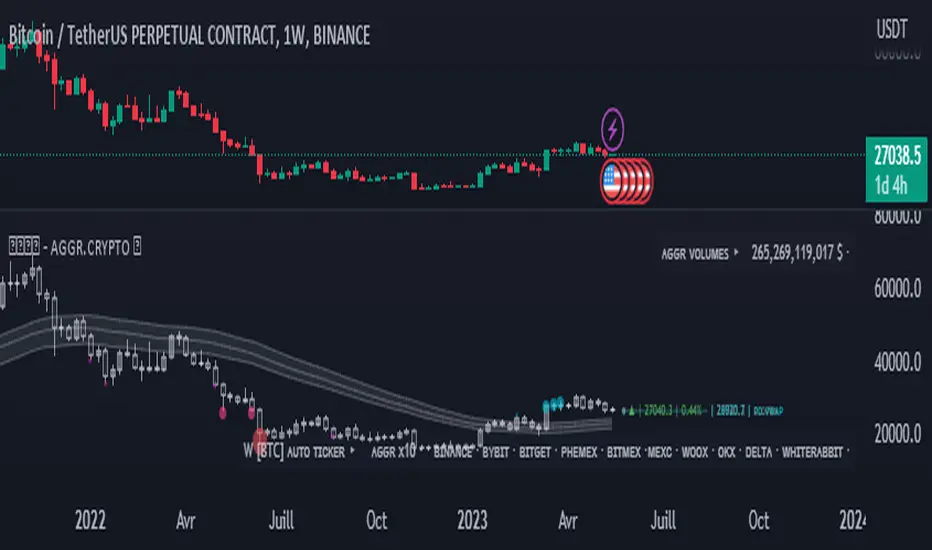
Opal - Aggr.Crypto█ OVERVIEW
The Multi-Exchange Crypto Aggregator is a unique concept ticker that gathers up to 10 tickers into one. A new OPAL Chart is created as an indicator, with its own candles and information. This information is meant to be interpreted as average information in order to reduce noise from a single ticker only. Everything is automated between assets. Our script will always check and ensure that data is received for calculations; otherwise, invalid tickers are ignored. This version is designed for Crypto Perpetual markets.
█ HOW DATA SLIPPAGE/DIFFERENCE IMPACT NOISE
This new average ticker aims to reduce noise in your candles and their live movements, avoiding most of the minor/last-second spikes, especially when they don't happen on every desired exchange at the same time. Our candles have different behaviors and highlight close-open slippage/gaps, as it seems to provide a strong reaction. Those gaps represent average slippage.
█ HOW TO USE
This should help you visualize market behaviors. Volume pressures are the origin of a lot of misunderstood things. Data analysis and observations show that makers target liquidity on both sides. Time and sessions have their own logic and will always need experience, as it is basically a gigantic Tetris game. Anyway, this should help with timing confirmations or bring confidence.
█ FEATURES
Aggregated (Tickers) Candles ▸ Aggregated OHLC candles, the idea behind the script. Set desired tickers to automate in settings. Value and Var% are displayed right next to the current candle.
Aggr. Dynamics/Levels ▸ Plot some strong levels as landmarks calculated on modified price, from Volume Weighted Average Price (VWAP) to Daily aggregated Open Price. The previous day's key level is included.
Aggr. Data Markers ▸ Plot some key markers on the chart, such as Open Pressure gaps, or estimated 3-scale liquidation bubbles with 2 confirmation modes (using different filters).
Aggr. Averages ▸ Plot up to 3 averages or HLC channels for visual ease.
█ SIGN
All of our contents are shared for educational purposes only.
Wishing you success;
OPAL - Strive for Greatness
Cripto
Crypto Trend IndicatorThe Crypto Trend Indicator is a trend-following indicator specifically designed to identify bullish and bearish trends in the price of Bitcoin, and other cryptocurrencies. This indicator doesn't provide explicit instructions on when to buy or sell, but rather offers an understanding of whether the trend is bullish or bearish. It's important to note that this indicator is only useful for trend trading.
The band is a visual representation of the 30-day and 60-day Exponential Moving Average (EMA). When the 30-day EMA is above the 60-day EMA, the trend is bullish and the band is green. When the 30-day EMA is below the 60-day EMA, the trend is bearish and the band is red. When the 30-day EMA starts to converge with the 60-day EMA, the trend is neutral and the band is grey.
The line is a visual representation of the 20-week Simple Moving Average (SMA) in the daily timeframe. "Bull" and "Bear" signals are generated when the 20-day EMA is either above or below the 20-week SMA, in conjunction with a bullish or bearish trend. When the band is green and the 20-day EMA is above the 20-week SMA, a “Bull” signal emerges. When the band is red and the 20-day EMA is below the 20-week SMA, a “Bear” signal emerges. The 20-week SMA can potentially also function as a leading indicator, as substantial price deviations from the SMA typically indicate an overextended market.
While this indicator has traditionally identified bullish and bearish trends in various cryptocurrency assets, past performance does not guarantee future results. Therefore, it is advisable to supplement this indicator with other technical tools. For instance, range-bound indicators can greatly improve the decision-making process when planning for entries and exits points.

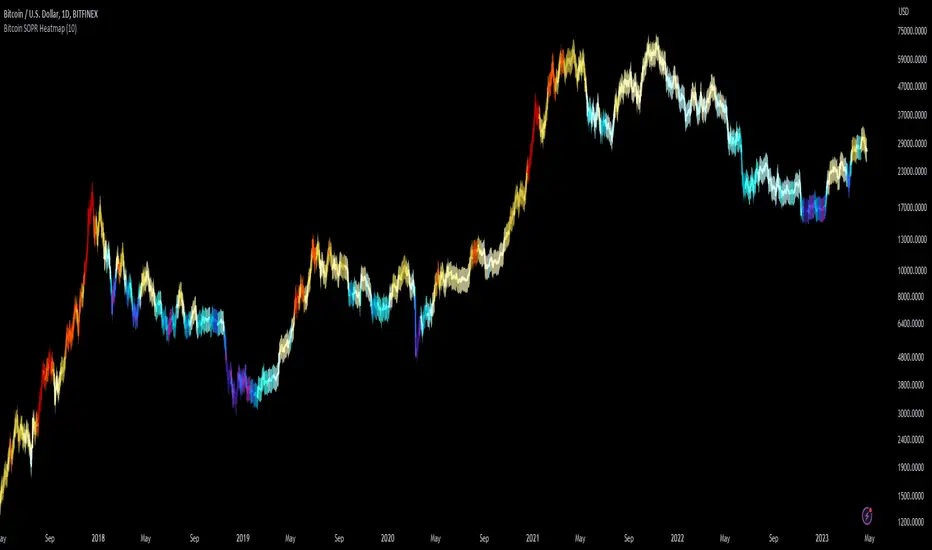
Bitcoin SOPR HeatmapSOPR (spent output profit ratio) is a metric, provided by Glassnode to measure if most BTC are moved in profit or in loss. The higher SOPR is, the more profits are realized (theoretically) and vice versa.
This indicator shows SOPR visually as a heatmap directly on the Bitcoin chart.
Cold temperatures (blue, purple) show bear markets. Bear market peaks should be visible in dark purple.
Hot temperatues (yellow, red) show bull markets. Hype phases should be visible in red.
I recommend to hide chart when using the indicator. Otherwise you can also enlarge the heatmap in the settings.
The indicator works best on BTCUSD standard charts on daily timeframe. Otherwise you will see an error message.
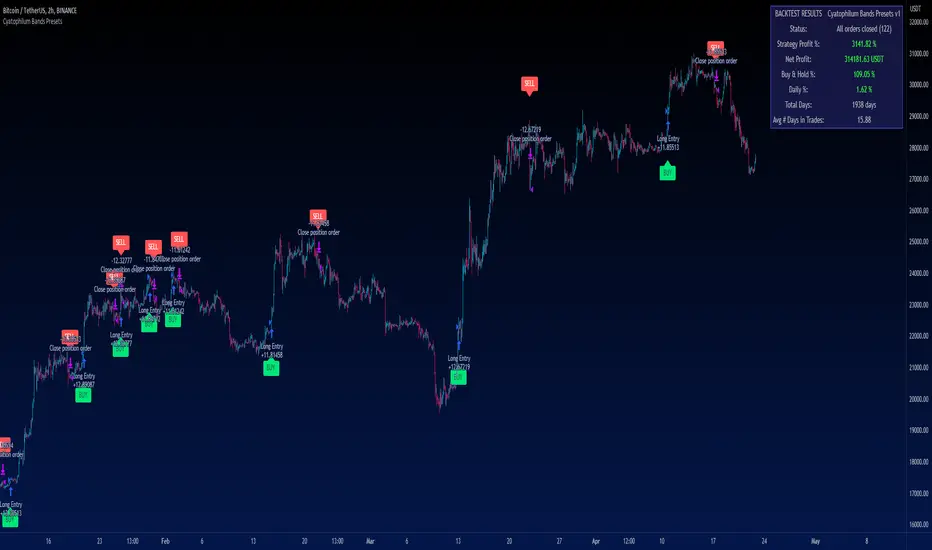
Cyatophilum Bands PresetsThis is a pre-configured strategy for swing trading Bitcoin on the 2 hours chart, Ethereum on the 4 hours, and BNB on the 2 hours. (More presets can be added later on)
Built upon my generic indicator "Cyatophilum Bands D.E.", this indicator removes the struggle of having to copy all the settings, instead, a single dropdown input lets you choose the preset.
More info about the complete strategy here:
The strategy has been backtested over 5 years of historical data and forward tested for +4 months (since january 2023) with the goal to beat buy and hold returns .
The indicator shows real time strategy results and has custom alerts for BUY and SELL signals which can be used to automate the strategy.
When creating your alert, first set your alert messages in the indicator settings. Then, select the indicator and create the alert using "alert() function calls only".
A warning will appear on the chart if the preset and chart configuration is incorrect.
Plots like bands and trailing lines are disabled by default to improve performance but can be turned on in the style tab.
BNBUSDT 2H
A combination of deviation and ATR bands based on Donchian channels.
ETHUSDT 4H
A combination of deviation and ATR bands based on SMA and an ATR trailing stop.
BTCUSDT 2H
Based on Donchian channels breakout type with a tight 2% stop loss, and a 3% take profit that gets disabled when price is trending up to let the trailing stop do its job.
Disclaimer: Backtest results are not representative of future results.
Net Positions (Net Longs & Net Shorts) - By LeviathanThis script is an experimental indicator that visualizes the entering and exiting of long and short positions in the market. It also includes other useful tools, such as NL/NS Profile, NL/NS Delta, NL/NS Ratio, Volume Heatmap, Divergence finder, Relative Strength Index of Net Longs and Net Shorts, EMAs and VWMAs and more.
To avoid misinterpretation, it's important to understand some basics. The “real” ratio between net long and net short positions in a given market is always 1:1. A futures contract is an agreement between two parties to buy or sell an underlying asset at an agreed-upon price. Each contract has a long side and a short side, with one party agreeing to buy (long) and the other party agreeing to sell (short) the asset at the agreed-upon price. The long position holder anticipates that the asset's price will rise, while the short position holder expects it to fall. Because every futures contract involves both a buyer and a seller, it is impossible to have more net longs than net shorts or vice versa (in terms of the net value). For every long position opened, there must be a corresponding short position taken by another market participant (and vice versa), thus maintaining the 1:1 ratio between longs and shorts. While there can be an imbalance in the number of traders/accounts holding long and short contracts, the net value of positions held on each side remains 1 to 1.
Open Interest (OI) is a metric that tracks the number of open (unsettled) contracts in a given market. For example, Open Interest of 100 BTC means that there are currently 100 BTC worth of longs and 100 BTC worth of shorts open in the market. There may be more traders on one side holding smaller positions, and fewer traders on the other side holding larger positions, but the net value of positions on one side is equal to the net value of positions on the other side → 100 BTC in longs and 100 BTC in shorts (1:1). Consider a scenario in which a trader decides to open a long position for 1 BTC at a price of HKEX:30 ,000. For this long order to be executed, a counterparty must take the opposite side of the contract by placing an order to short 1 BTC at the same price of HKEX:30 ,000. When both the long and short orders are matched and executed, the open interest increases by 1 BTC, reflecting the addition of this new contract to the market.
Changes in Open Interest essentially tell us 3 things:
- OI Increase - new positions entered the market (both longs and shorts!)
- OI Decrease - positions exited the market (both longs and shorts!)
- OI Flat - no change in open positions due to low activity or simply lots of transfers of contracts
However, different concepts can be used to analyze sentiment, aggressiveness, and activity in the market by analyzing data such as Open Interest, price, volume, etc. This indicator combines Open Interest data and price action to simplify the visualization of positions entering and exiting the market. It is based on the following concept:
Increase in Open Interest + Increase in price = Longs Opening
Decrease in Open Interest + Decrease in price = Longs Closing
Increase in Open Interest + Decrease in price = Shorts Opening
Decrease in Open Interest + Increase in price = Shorts Closing
When "Longs Opening" occurs, the OI Delta value is added to the running total of Net Longs, and when "Longs Closing" occurs, the OI Delta value is subtracted from the running total of Net Longs.
When "Shorts Opening" occurs, the OI Delta value is added to the running total of Net Shorts, and when "Shorts Closing" occurs, the OI Delta value is subtracted from the running total of Net Shorts.
To summarize:
Net Longs: Cumulative value of Longs Opening and Longs Closing (LO - LC)
Net Shorts: Cumulative value of Shorts Opening and Shorts Closing (SO - SC)
Net Delta: Net Longs - Net Shorts
Net Ratio: Net Longs / Net Shorts
This is the fundamental logic of how this script functions, but it also includes several other tools and options. Here is an overview of the settings:
Type:
- Net Positions (display values of Net Longs, Net Shorts, Net Delta, Net Ratio as described above)
- Relative Strength (display Net Longs, Net Shorts, Net Delta, Net Ratio in the form of a momentum oscillator that measures the speed and change of movements. Same logic as RSI for price)
Display as:
- Candles (display the data in the form of candlesticks)
- Lines (display the data in the form of candlesticks)
- Columns (display the data in the form of columns)
Cumulation:
- Visible Range (data is cumulated from the first visible bar on your chart)
- Full Data (data is cumulated from the beginning)
Quoted in:
- Base Currency (all data is presented in the pair’s base currency eg. BTC)
- Quote Currency (all data is presented in the pair’s quote currency eg USDT)
OI Sources
- Pick the sources from where the data is collected (if available).
Net Positions:
- NET LONGS (show/hide Net Longs plot, choose candle colors, choose line color)
- NET SHORTS (show/hide Net Shorts plot, choose candle colors, choose line color)
- NET DELTA (show/hide Net Delta plot, choose candle colors, choose line color)
- NET RATIO (show/hide Net Ratio plot, choose candle colors, choose line color)
Moving Averages:
- Type (choose between EMA and Volume Weighted Moving Average)
- NET LONGS (show/hide NL moving average plot, choose length, choose color)
- NET SHORTS (show/hide NS moving average plot, choose length, choose color)
- NET DELTA (show/hide ND moving average plot, choose length, choose color)
- NET RATIO (show/hide NR moving average plot, choose length, choose color)
Profile:
- Profile Data (choose the source data of the profile)
- Value Area % (set the percentage width of profile’s value area)
- Positions (set the position of the profile to left or right of the visible range)
- Node Size (set the relative size of nodes to make them appear smaller or larger)
- Rows (select the amount of rows displayed by the profile to control granularity)
- POC (show/hide POC- Point Of Control and select its color)
- VA (show/hide VA- Value Area and select its color)
Divergence finder
- Source (choose the source data used by the script to compare it with price pivot points)
- Maximum distance (the maximum distance between two divergent pivot points)
- Lookback Bars Left (the number of bars to the left of the current bar that the function will consider when looking for a pivot point)
- Lookback Bars Right (the number of bars to the right of the current bar that the function will consider when looking for a pivot point)
Stats:
- Show/Hide the Stats table
- Bars Back (choose the length of data analyzed for stats in number of bars)
- Position (choose the position of the Stats table)
- Select Data you want to display in the Stats table
Additional Settings:
- Volume Heatmap (show/hide volume heatmap and select its color)
- Label Offset (select how much the plot label is shifted to the right
- Position Relative Strength Length (select the length used in the calculation)
- Value Label (show/hide OI Delta values when candles are displayed)
- Plot Labels (show/hide the labels next to the plot)
- Wicks (show/hide wick when candles are displayed)
Code used for generating profiles is taken from @KioseffTrading's "Profile Any Indicator" script (used with author's permission)

Crypto Performance Index1. The Crypto Performance Index (CPI) estimates the price appreciation of a crypto asset relative to the overall crypto market performance. The indicator is calculated using a Sharpe Ratio principle enhanced with time-domain normalization and cumulative parametrization.
2. The CPI is based on the idea that the performance of an asset should be evaluated not only in terms of its absolute price movement, but also in terms of its risk-adjusted returns compared to the broader market. The Sharpe Ratio, which takes into account both the asset's return and its volatility, is a commonly used measure of risk-adjusted performance.
3. The CPI takes the Sharpe Ratio principle further by incorporating a time-domain normalization technique that adjusts for differences in volatility across different time periods. The cumulative parametrization ensures that the CPI considers the overall performance of the asset over a specified period of time.
4. To use the indicator, select a timeframe and set the standard deviation period (default is 20). The CPI line can be compared against various market benchmarks, including the total crypto market cap (white line), altcoins total market cap (blue line), low-cap altcoins (without ETH), and Bitcoin.
5. An upward slope of the CPI line indicates strong price performance of an asset, with a relatively high chance for the asset to continue growing faster than the market in the future. Conversely, a downward slope of the CPI line indicates weak price performance of an asset, with a relatively high chance for the asset to depreciate in price with respect to the rest of the market in the future.
6. Overall, the CPI provides a comprehensive measure of an asset's price performance, taking into account both its absolute return and its risk-adjusted return relative to the broader market. This makes it a valuable tool for investors looking to evaluate the performance of their crypto holdings and make informed decisions about buying, selling, or holding assets.

Trendmaster - Crypto Flow IndexWhat it is:
The Trendmaster Crypto Flow Index is a unique tool designed to give you an overview of the performance of different Crypto market sectors and sub-sectors. It helps you to identify where you should be focusing your investments for maximum portfolio efficiency and profitability.
What it does:
The Crypto Flow Index presents a visual overview of the flows of retail and institutional capital into the four main market sectors: Large Caps, Alts Coins, Shit Coins, and Stable Coins as well as several other sub-sectors. Each sector is assigned a "Flow Score", which indicates its current performance, demand, and strength in percentage terms. The "Flow Score" also provides insights into the current stage of the market cycle and the typical over and underperformances of assets that correlate to it. Additionally, the index factors in the sector have a "Correlation" to the broader market, allowing you to see the best sectors for trading and investing, either for positional hedging or differential plays.
How to Use it:
To use the Trendmaster Crypto Flow Index, you can simply observe the evolving colored line within the indicator and the table overview. You can identify which sectors are outperforming or underperforming the general market and make informed decisions about where to direct your focus and funds. By monitoring the transitions of Flow between sectors, you can gain invaluable insights into the market cycle and the typical over and underperformances of assets that correlate to it. This information will help you to maximize portfolio efficiency by targeting different market sectors based on their performance to the overall cryptocurrency market. The index covers different sectors, including Large caps, Alts, Shit, Stables, AI, Defi, Dex, Exchange, Gaming, Meme, Metaverse, Nft, Privacy, Smart, and Sports.
Examples of Cryptocurrencies represented in the different market sectors:
Large caps: The biggest market cap cryptocurrencies such as BTC and ETH.
Alts: High-cap and high-volume digital assets that are smaller than large caps, such as LTC and XRP.
Shit coins: Smaller cap projects that are highly speculative and experience significant price volatility, such as BAT and HOT.
Stables: Fiat-pegged assets that provide a stable value, such as USDT and USDC.
AI: Projects that are based on artificial intelligence, such as FET and AGIX.
DeFi: Leverages high volume smart contract platforms to provide financial products in crypto, mainly ERC20 tokens such as LINK and AAVE.
DEX: Decentralized exchanges with their own utility tokens, such as UNI and SUSHI.
Exchange: Centralized exchanges with their own utility tokens, such as BNB and CRO.
Gaming: Web3/crypto gaming platforms with their own utility tokens, such as AXS and GMT.
Meme: Similar to shit coins, but with no real functionality and based purely on social media and memes, such as DOGE and SHIB.
Metaverse: Projects that aim to provide Metaverse assets such as virtual land and assets, such as MANA and SAND.
NFT: Non-fungible tokens with their own token or NFT-based platforms that have their own utility tokens, such as APE and LOOKS.
Privacy: Anonymous and privacy-focused chains, such as XMR and ZEC.
Smart: Projects that provide smart contract alternatives to ETH, such as ADA and AVAX.
Sports: Fan tokens based on real-world sports teams or platforms that support and distribute them, such as CHZ and FLOW.

Shorting when Bollinger Band Above Price with RSI (by Coinrule)The Bollinger Bands are among the most famous and widely used indicators. A Bollinger Band is a technical analysis tool defined by a set of trendlines plotted two standard deviations (positively and negatively) away from a simple moving average ( SMA ) of a security's price, but which can be adjusted to user preferences. They can suggest when an asset is oversold or overbought in the short term, thus providing the best time for buying and selling it.
The relative strength index ( RSI ) is a momentum indicator used in technical analysis. RSI measures the speed and magnitude of a security's recent price changes to evaluate overvalued or undervalued conditions in the price of that security. The RSI can do more than point to overbought and oversold securities. It can also indicate securities primed for a trend reversal or corrective pullback in price. It can signal when to buy and sell. Traditionally, an RSI reading of 70 or above indicates an overbought situation. A reading of 30 or below indicates an oversold condition.
The short order is placed on assets that present strong momentum when it's more likely that it is about to reverse. The rule strategy places and closes the order when the following conditions are met:
ENTRY
The closing price is greater than the upper standard deviation of the Bollinger Bands
The RSI is less than 70.
EXIT
The trade is closed when the RSI is less than 70
The lower standard deviation of the Bollinger Band is less than the closing price.
This strategy was backtested from the beginning of 2022 to capture how this strategy would perform in a bear market.
The strategy assumes each order to trade 70% of the available capital to make the results more realistic. A trading fee of 0.1% is taken into account. The fee is aligned to the base fee applied on Binance, which is the largest cryptocurrency exchange by volume.

FlashTrade 20 Asset ScreenerThe FlashTrade 20 Asset Screener is a powerful screening tool written in Pinescript and designed for use in Tradingview. It simultaneously monitors a combination of seven (7) lagging and three (3) leading indicators for twenty (20) assets, such as; stocks, cryptocurrencies, or forex pairs.
The screener sends summarized numeric data as an alert to external programs that specialize in automated trading. This proprietary technology developed by the algorithmic trading firm known as FlashTrade.AI is now integrated with the rules-based trading platform TradeLab.AI.
The lagging indicators tracked by the screener are as follows:
1. The 8 Period Exponential Moving Average (8EMA): It determines whether it is over or under the 21 Period Exponential Moving Average (21EMA).
2. Two Closes of the 8 Period Exponential Average (8EMA): This confirms a trend as either bullish or bearish when it occurs over or under the 21 Period Exponential Moving Average (21EMA).
3. Ichimoku Cloud: This indicator identifies whether the price is above or below the cloud, indicating bullish or bearish trends.
4. Ichimoku Cloud: Conversion Line Above Base or Conversion Line Below Base: This measures the trend strength based on the distance between the conversion line and the base line.
5. Ichimoku Cloud: Lag Line Above Price or Lag Line Below Price: This tracks the lag line's position relative to the current price to confirm trend direction.
6. Ichimoku Cloud: Leading Cloud Green or Leading Cloud Red: This identifies the trend based on the color of the leading cloud.
7. MACD: This oscillator tracks the difference between two exponential moving averages and helps identify bullish or bearish momentum in the market.
The screener also tracks three leading indicators that primarily measure trading volume and momentum. These leading indicators are:
1. The Relative Strength Index (RSI): This oscillator measures the speed and change of price movements to identify overbought or oversold conditions in the market.
2. The Stochastic: This oscillator measures the momentum of price movements and helps identify potential trend reversals in the market.
3. The relative Vigor Index (RVGI): This indicator measures the strength of price movements by comparing the closing price to the trading range and helps identify trend reversals.
Overall, the FlashTrade 20 Asset Screener is a powerful tool for traders looking to automate their trading strategies. By monitoring multiple indicators for multiple assets simultaneously, it can identify trends and capitalize on opportunities when they present themselves.

Dynamic Volume Oscillator [CryptoScripts]The Dynamic Volume Oscillator uses a combination of volume and momentum to nail whenever a reversal is likely to happen. I've also included divergences (both regular and hidden) that you can toggle on/off and adjust the settings to fit your trading style.
Colors - The green wave indicates an uptrend while the purple wave indicates a downtrend.
Overbought/Oversold - Green backgrounds indicate the DVO is oversold and a reversal to the upside is likely to happen within the next few candles. Red backgrounds indicate the DVO is overbought and a reversal to the downside is likely to happen within the next few candles. You can adjust the levels to trigger when the signal flashes. Experiment with different timeframes/altcoins to see which settings work best. Some coins are more volatile than others and lower timeframes tend to reach higher levels vs higher timeframes.
Divergences - The settings of 1 and 3 for the lookbacks are so the divergence signal appears only 1 candle before the actual divergence happens (on the replay tool) vs 4-5 candles from other indicators. This means your entry on a divergence signal is 2 candles after it prints (for backtesting purposes).
Alerts - I also added alerts for Overbought, Oversold, Regular and Hidden Bearish/Bullish Divergences.
Let me know if you have any questions! Enjoy :)

Token Metrics IndicatorThe Token Metrics Combined Indicator v2 is a comprehensive technical analysis tool designed to output Long/Short signals for crypto assets on TradingView. It combines multiple indicators, including Token Metrics Clouds, Token Metrics Trend Lines , Token Metrics Channels, and signals, to give a comprehensive outlook on the market trend and potential entry/exit points.
Users can backtest the signals to understand the strategy's historical performance, learn how to use it, identify its pros and cons, and determine the market conditions it best suits. It is important to note that the backtesting performance does not indicate future results.
The methods for calculating fixed stop-losses vary depending on the trading pattern. A fixed stop-loss is used for long-term trading, while a trading stop-loss is used for high-frequency trading. This provides flexible investment risk management, allowing you to assign different stop-loss percentages to different trading strategies.
The Length input allows users to control the indicator’s sensitivity, with a default value of 20 bars for long-term trading and 9 bars for high-frequency trading. The Adjustment Factor input has a default value of 0.1 and can be adjusted to adapt to changing levels of volatility . The Stop-loss input allows users to control their risk tolerance, with a default value of 8% for long-term trading and 2% for high-frequency trading.
Token Metrics Clouds incorporates a bullish / bearish trend indicator, which uses two adaptive moving averages that adapt to volatility , reducing false trend signals during range-bound environments and providing a more accurate representation of market trends.
The Token Metrics Trendline is a long-term indicator that uses an adaptive moving average to identify long-term trends. This can also be used for long-term resistance and support levels, providing a comprehensive overview of the current market situation for both long-term and high-frequency traders.
The Token Metrics Signals indicator provides long, short, and close signals, indicating when to enter and exit long or short positions based on the TM trend-following strategy.
The Token Metrics Channels indicator is a top/bottom indicator that adjusts to current levels of volatility . This uses adaptive Donchian channels to determine the previous short-term swing high and low, providing insight into where short-term resistance or support might be forming and where breakouts can occur. The look-back periods change according to the strategy time frame, offering a flexible and dynamic approach to market analysis.
Long-term trading is a trend-following strategy best suited for daily and weekly timeframes. This strategy works well in trending markets but may produce false signals in choppy or range-bound markets.
High-frequency trading is a mean-reverting strategy best suited for 15-minute, 30-minute, and 1-hour timeframes. This strategy performs well in choppy or range-bound markets but may not be effective in strong trending markets.

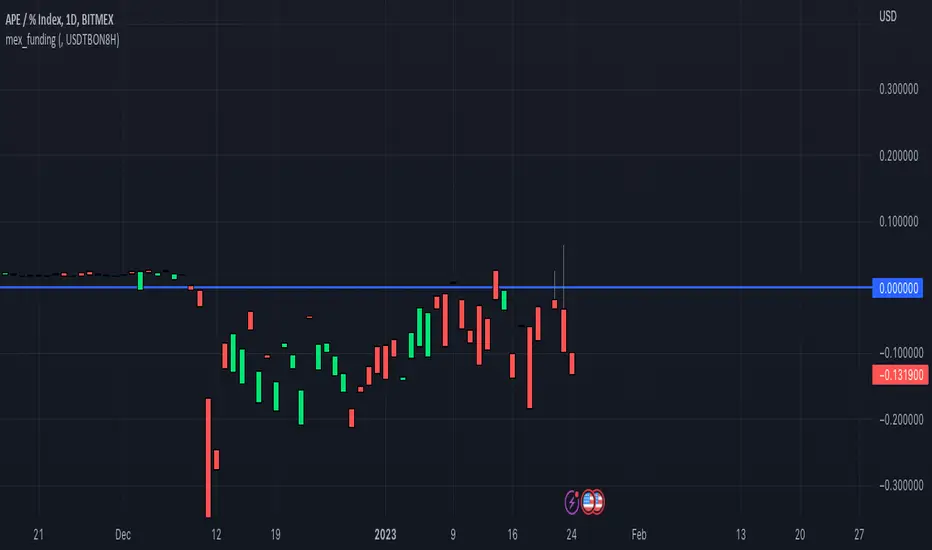
mex_fundingScript for calculating Bitmex funding based on the Premium tickers Bitmex submits to Tradingview
Make sure you add the correct Bitmex Interest Base and Quote Symbols in the input settings
For example for www.bitmex.com the inputs are:
Chart ticker: XBTUSDPI8H
Input Settings
Interest Base: XBTBON8H
Interest Quote: USDBON8H
Crypto Tipster v2 - Trend Oscillator---------------------
Crypto Tipster v2 - Trend Oscillator
Following on from the release of Crypto Tipster v2 toward the end of 2022, we've been working on a way to visually represent how our indicator works, so our members can utilize more tools and therefore make better informed trading decisions by setting up Crypto Tipster v2 more accurately to suit their individual trading needs.
Trend Oscillator is designed to work alongside Crypto Tipster v2 by providing an oscillating line graph between 0-100. This plot indicates the overall trend strength when all our Crypto Tipster algorithms combine and will help you understand the inherent movement behind the scenes within Crypto Tipster v2.
We have included options that have been previously unavailable within Crypto Tipster v2 - including:
- A variable threshold of trend strength before placing orders
- The ability to place orders when trend strength crosses the mid point of the oscillator (50)
- Placing orders when the trend oscillator detects a change in direction
As well as these options as listed above we've included a function to overlay a Moving Average onto the trend oscillator to help smooth out any potential whipsaw's and false moves. This is particularly helpful when combined with "placing orders on direction change" as listed. Numerous moving average options have been included which include (but are not limited to) SMA, EMA, WMA, VWMA, DEMA, TEMA, SMMA, Hull, ZEMA.. the list goes on!
We've been wanting to include several features like these and more within Crypto Tipster v2 for some time now, but have found it difficult to include these features without causing a certain amount of confusion over what they are, what they do, how they work and therefore what their benefits actually are - a few words and an input box just don't portray the message we need to get across when used solely within Crypto Tipster!
With "Trend Oscillator" we can now release all of these updates without concern of being mis-understood. The visual representation that this oscillator offers helpfully describes what we couldn't describe within Crypto Tipster v2 before.
This script is free to use for all, you don't even need to be a member of Crypto Tipster - however, those of you who are signed up with theCrypster will definately receive the biggest benefit from this script. Alerts are not available with our Trend Oscillator, as are "Buy", "Sell" or "Close" labels on the main chart.
We've got many more updates and add-ons planned for the coming weeks and months, stay tuned!
---------------------
We've tried to make Trend Oscillator as comprehensive and easy to understand as possible, we are however always in search of progression; we do really love to hear your feedback :)
For more information or for a 7-day free trial of Crypto Tipster v2 please visit the link in our signature!
Happy Trading Guys

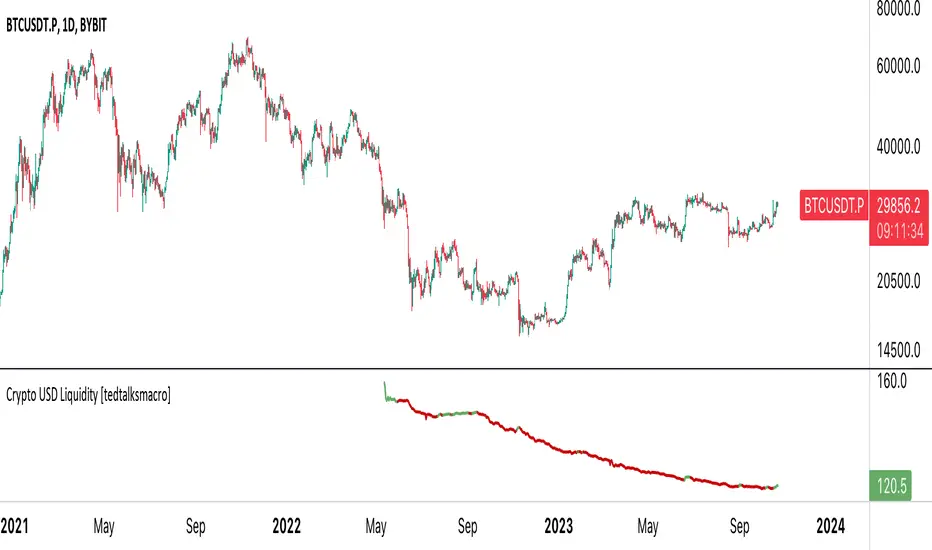
Stablecoin supplies [USD bn]This script shows crypto market inflows/outflows by showing the USD stablecoin supplies, using data from glassnode.com :
GLASSNODE:BUSD_SUPPLY
GLASSNODE:USDT_SUPPLY
GLASSNODE:USDC_SUPPLY
Using a simple 20 EMA, the line will change color showing stablecoin inflow or outflow. Traders can consider stable coin inflows (green) as bullish for Bitcoin price, while stable coin outflows (red) should be considered bearish for price.
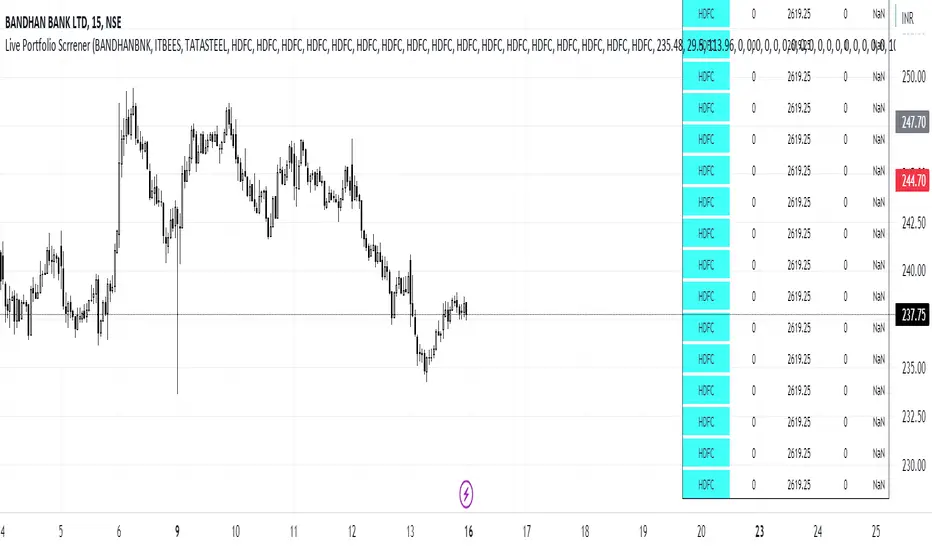
Live Portfolio ScreenerThe live portfolio screener indicator is a tool that help users to track the performance of their investments in real-time. The indicator provides a detailed breakdown of the user's portfolio, including the current profit and loss (P&L) for each stock that is invested in. This allows users to quickly and easily see how their portfolio is performing and make informed decisions about their investments on charts. Overall, this tool is an essential tool for anyone looking to stay on top of their investments and make data-driven decisions.
This indicator can load any symbol globally usable.
How to use this indicator ?
in this indicator firstly
you have add script name. (For example if you want to add symbol you have add in 's01 ' means the first symbol)
after that
you have to add price for each (For example if you want to add buy price for the first symbol then add the buy price in ' Bp01 ')
then the quantity comes in picture which is below price list and named here as Bq01 which means 'Buy quantity for first symbol'
Ichimoku Cloud and ADX with Trailing Stop Loss (by Coinrule)The Ichimoku Cloud is a collection of technical indicators that show support and resistance levels, as well as momentum and trend direction. It does this by taking multiple averages and plotting them on a chart. It also uses these figures to compute a “cloud” that attempts to forecast where the price may find support or resistance in the future.
The Ichimoku Cloud was developed by Goichi Hosoda, a Japanese journalist, and published in the late 1960s. It provides more data points than the standard candlestick chart. While it seems complicated at first glance, those familiar with how to read the charts often find it easy to understand with well-defined trading signals.
The Ichimoku Cloud is composed of five lines or calculations, two of which comprise a cloud where the difference between the two lines is shaded in.
The lines include a nine-period average, a 26-period average, an average of those two averages, a 52-period average, and a lagging closing price line.
The cloud is a key part of the indicator. When the price is below the cloud, the trend is down. When the price is above the cloud, the trend is up.
The above trend signals are strengthened if the cloud is moving in the same direction as the price. For example, during an uptrend, the top of the cloud is moving up, or during a downtrend, the bottom of the cloud is moving down.
DMI is simple to interpret. When +DI > - DI, it means the price is trending up. On the other hand, when -DI > +DI, the trend is weak or moving on the downside. The ADX does not give an indication of the direction but about the strength of the trend.
Typically values of ADX above 25 mean that the trend is steeply moving up or down, based on the -DI and +DI positioning. This script aims to capture swings in the DMI, and thus, in the trend of the asset, using a contrarian approach.
Trading on high values of ADX, the strategy tries to spot extremely oversold and overbought conditions. Values of ADX above 45 may suggest that the trend has overextended and is maybe about to reverse.
This strategy combines the Ichimoku Cloud with the ADX indicator to better enter trades.
Long orders are placed when these basic signals are triggered.
Long Position:
Tenkan-Sen is above the Kijun-Sen
Chikou-Span is above the close of 26 bars ago
Close is above the Kumo Cloud
MACD line crosses over the signal line
-DI is greater than +DI
ADX is greater than 45
Close Position:
3% increase trailing
3% decrease trailing
The script is backtested from December 2022 and provides good returns.
A trading fee of 0.1% is also taken into account and is aligned to the base fee applied on Binance.

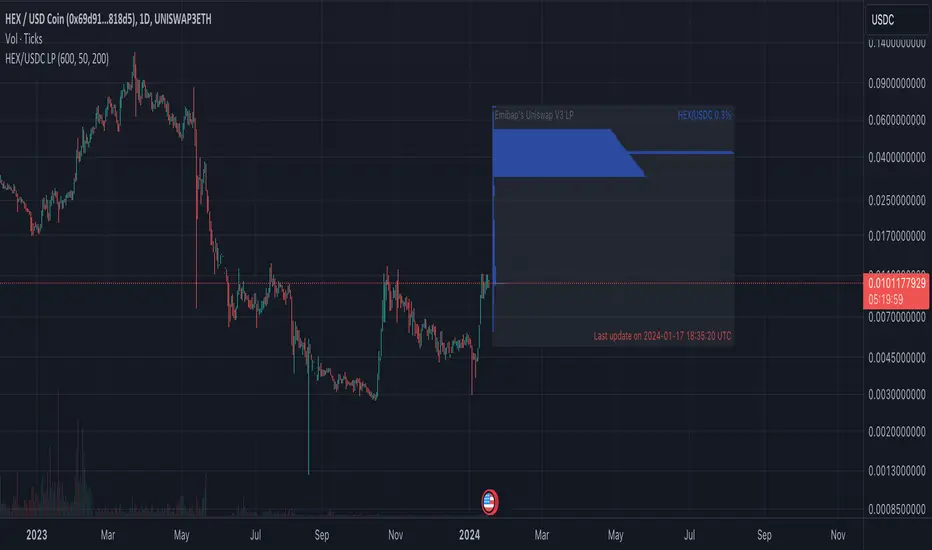
Emibap's Uniswap V3 HEX/USDC 3% Liquidity PoolThis script will display a histogram of the Uniswap V3 HEX / USDC 3% liquidity pool.
Similar to what you can see in the liquidity section of the Uniswap pool page but conveniently rendered alongside your chart.
It's meant to be used on any HEX / USDC chart only.
One of the main motivations for using this in your HEX / USDC chart is to get an idea of the current sentiment: If most of the volume is below the price it might be an indication of an upcoming move up, for instance.
I'll try to update the liquidity regularly; if possible several times a day.
Using the 4h, daily, or weekly time frames is highly recommended.
The options are straightforward:
Histogram bars color. Default is blue
Histogram background color. Default is black at 20% opacity
Upper price limit of the diagram: Visible upper bound price limit for the histogram, based on the current price. I.E: 200%: If the price is 1, the histogram will show 3 as the upper bound
Lower price limit of the diagram. Visible lower bound price limit for the histogram, based on the current price. I.E: 99%: If the price is 1, the histogram will show 0. 01 as the upper bound
Width of the widest bar: Width (in bars) for the widest bar of the histogram. The more the higher resolution you'll get
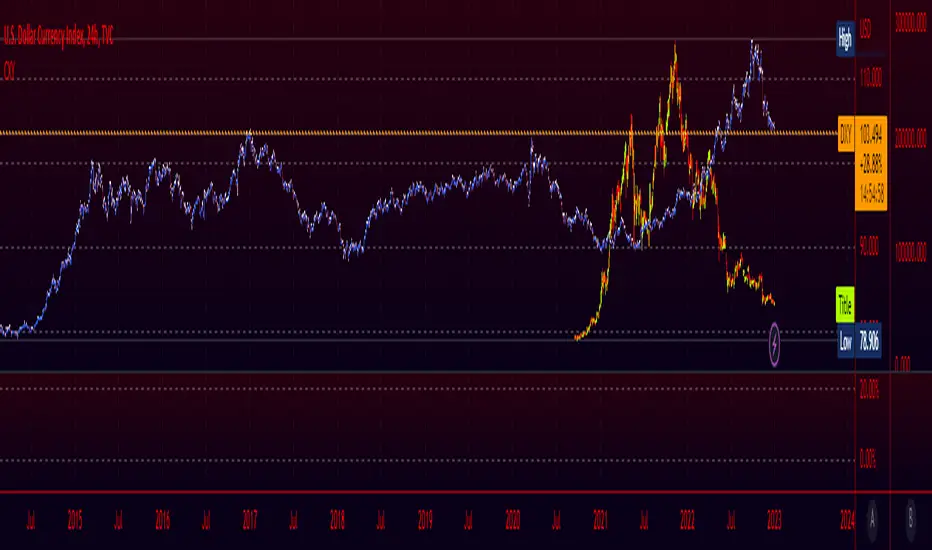
DXY Overlay CompareOverlays the DXY chart over the top of any other chart. When the dollar strength increases, asset prices can drop and vice versa. Was created personally to compare with the price of Bitcoin.

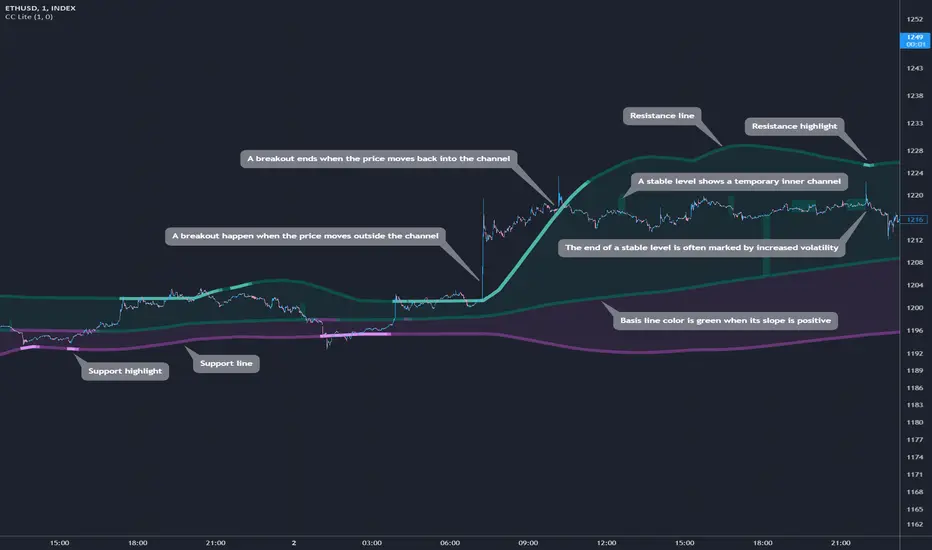
Cosmic Channel LiteCosmic Channel Lite ( CC Lite) draws dynamic non-repainting trendlines and helps
⭐ know when a breakout is about to begin
⭐ predict the position and timing of the next swing reversal
⭐ predict sudden changes in volatility
⭐ recognize whether the price is in bearish or bullish territory
👀 HOW IT WORKS
Cosmic Channel Lite draws a dynamic channel consisting of a support line, basis line and resistance line. These are calculated by applying the Reduced Median Method to groups of moving averages of different type over several periods each, effectively taking 20 data points and reducing them to 3. In between, 6 internal levels are left to give context inside the channel with stable levels, the extremes of which help highlight the SR lines (see chart). The basis line color is determined by its smoothed angle with positive angles in green and negative in purple. The aim of this indicator is to provide a consistent and generic price context that works out-of-the-box and accordingly the settings have been stripped to the bare minimum with no need to continually adjust them.
📗 HOW TO USE IT
The Cosmic Channel Lite plots are meant to be used as a guide for entering and exiting positions and setting stop-loss and take profit levels. The indicator is deemed effective for any particular timeframe as long as the price stays within the maximum bounds of the indicator's plots. For this reason it is recommended to use Cosmic Channel Lite in a multi-chart layout where each chart has a different timeframe. The 5 primary strategies are:
long when the price reverses off of the support line and short when the price reverses off of the resistance line
long when the support line is highlighted and short when the resistance line is highlighted
long when the price breaks above the resistance line and short when the price breaks below the support line
long when the price moves above the basis line after being below it for a prolonged period and visa-versa (short when the price moves below the basis line)
long/short in the direction the price takes after a stable level ends
🔔 SMART ALERTS
Get notified at the most critical times by settings just one alert. Simply select CC Lite and Any alert() function call as the conditions when creating an alert and you will be tipped-off on bar-close as follows:
R─ (resistance line is highlighted)
S─ (support line is highlighted)
For example, an alert such as CC Lite 6h R─ would mean that during the last 6-hour bar the resistance line has been highlighted. The highlight lasts at least 15 bars from the first highlight bar regardless of price action.
Crypto Index (DXY) CandlesA modification of @loxx's "Dollar Index (DXY) Candles" allowing for a user selected basket of tickers using the same weights as the standard DXY. Ticker Inputs are in descending order so highest weight is at the top by default, although weighting can be changed manually by modifying the symbol's corresponding weight input in the settings. The Idea was to get a bird's eye view of the crypto space using some of the more relevant names in the space. User's can use the toggle in the settings for viewing the default DXY for comparison. Indicator should be used as a confirmation when looking at long term trend changes in the space, shorter time frames may, or may not be as useful.
RSI and MA with Trailing Stop Loss and Take Profit (by Coinrule)The relative strength index is a momentum indicator used in technical analysis. It measures the speed and magnitude of a coin's recent price changes to evaluate overvalued or undervalued conditions in the price of that coin. The RSI is displayed as an oscillator (a line graph essentially) on a scale of zero to 100. When the RSI reaches oversold levels, it can provide a signal to go long. When the RSI reaches overbought levels, it can mark a good exit point or alternatively, an entry for a short position. Traditionally, an RSI reading of 70 or above indicates an overbought situation. A reading of 30 or below indicates an oversold condition.
A moving average (MA) calculates the average of a selected range of prices, usually closing prices, by the number of periods in that range. Essentially it is used to help smooth out price data by creating a constantly updated average price.
The Strategy enters and closes trades when the following conditions are met:
Entry Conditions:
RSI is greater than 50
MA9 is greater than MA50
RSI increases by 5
Exit Conditions:
Price increases by 1% trailing
Price decreases by 2% trailing
This strategy is back-tested from 1 January 2022 to simulate how the strategy would work in a bear market. The strategy provides good returns.
The strategy assumes each order is using 30% of the available coins to make the results more realistic and to simulate you only ran this strategy on 30% of your holdings. A trading fee of 0.1% is also taken into account and is aligned to the base fee applied on Binance.

MACD + RSI + ADX Strategy (ChatGPT-powered) by TradeSmartThis is a trading strategy made by TradeSmart, using the recommendations given by ChatGPT . As an experiment, we asked ChatGPT on which indicators are the most popular for trading. We used all of the recommendations given, and added more. We ended up with a strategy that performs surprisingly well on many crypto and forex assets. See below for exact details on what logic was implemented and how you can change the parameters of the strategy.
The strategy is a Christmas special , this is how we would like to thank the support of our followers.
The strategy has performed well on Forex, tested on 43 1-hour pairs and turned a profit in 21 cases. Also it has been tested on 51 crypto pairs using the 1-hour timeframe, and turned a profit in 45 cases with a Profit Factor over 1.4 in the top-5 cases. Tests were conducted without commission or slippage, unlike the presented result which uses 0.01% commission and 5 tick slippage.
Some of the top performers were:
SNXUSDT
SOLUSDT
CAKEUSDT
LINKUSDT
EGLDUSDT
GBPJPY
TRYJPY
USDJPY
The strategy was implemented using the following logic:
Entry strategy:
Long entry:
Price should be above the Simple Moving Average (SMA)
There should be a cross up on the MACD (indicated by the color switch on the histogram, red to green)
RSI should be above the 50 level
Volume is above the selected volume-based Exponential Moving Average (EMA)
ADX should also agree to this position: below 50 and over 20, and above the Regularized Moving Average (REMA)
Short entry:
Price should be under the Simple Moving Average (SMA)
There should be a cross down on the MACD (indicated by the color switch on the histogram, red to green)
RSI should be below the 50 level
Volume is above the selected volume-based Exponential Moving Average (EMA)
ADX should also agree to this position: below 50 and over 20, and above the Regularized Moving Average (REMA)
Exit strategy:
Stop Loss will be placed based on ATR value (with 1.5 Risk)
Take profit level will be placed with a 2.5 Risk/Reward Ratio
Open positions will be closed early based on the Squeeze Momentum (Long: change to red, Short: change to green)
NOTE! : The position sizes used in the example is with 'Risk Percentage (current)', according which the position size will be determined such
that the potential loss is equal to % of the current available capital. This means that in most of the cases, the positions are calculated using leverage.
Parameters of every indicator used in the strategy can be tuned in the strategy settings as follows:
Plot settings:
Plot Signals: true by default, Show all Long and Short signals on the signal candle
Allow early TP/SL plots: false by default, Checking this option will result in the TP and SL lines to be plotted also on the signal candle rather than just the entry candle. Consider this only when manual trading, since backtest entries does not happen on the signal candle.
Entry Signal:
Fast Length: 12 by default
Slow Length: 26 by default
Source: hlcc4 by default
Signal Smoothing: 9 by default
Oscillator MA Type: EMA by default
Signal Line MA Type: EMA by default
Exit Strategy:
ATR Based Stop Loss: true by default
ATR Length (of the SL): 14 by default
ATR Smoothing (of the SL): EMA by default
Candle Low/High Based Stop Loss: false by default, recent lowest or highest point (depending on long/short position) will be used to calculate stop loss value. Set 'Base Risk Multiplier' to 1 if you would like to use the calculated value as is. Setting it to a different value will count as an additional multiplier. Please select only one active stop loss. Default value (if nothing or multiple stop losses are selected) is the 'ATR Based Stop Loss'.
Candle Lookback (of the SL): 10 by default
Base Risk Multiplier: 1.5 by default, the stop loss will be placed at this risk level (meaning in case of ATR SL that the ATR value will be multiplied by this factor and the SL will be placed that value away from the entry level)
Risk to Reward Ratio: 2.5 by default, the take profit level will be placed such as this Risk/Reward ratio is met
Force Exit based on Squeeze Momentum: true by default, a Long position will be closed when Squeeze Momentum turns red inside an open position and a Short position will be closed when Squeeze Momentum turns green inside an open position
BB Length: 20 by default
BB Mult Factor: 1.0 by default
KC Length: 20 by default
KC Mult Factor: 1.5 by default
Use True Range (KC): Yes by default
Base Setups:
Allow Long Entries: true by default
Allow Short Entries: true by default
Order Size: 1.5 by default
Order Type: Risk Percentage (current) by default, allows adjustment on how the position size is calculated: Cash: only the set cash ammount will be used for each trade Contract(s): the adjusted number of contracts will be used for each trade Capital Percentage: a % of the current available capital will be used for each trade Risk Percentage (current): position size will be determined such that the potential loss is equal to % of the current available capital Risk Percentage (initial): position size will be determined such that the potential loss is equal to % of the initial capital
Trend Filter:
Use long trend filter: true by default, only enter long if price is above Long MA
Show long trend filter: true by default, plot the selected MA on the chart
MA Type (Long): SMA by default
MA Length (Long): 100 by default
MA Source (Long): close by default
Use short trend filter: true by default, only enter long if price is under Short MA
Show short trend filter: false by default, plot the selected MA on the chart
MA Type (Short): SMA by default
MA Length (Short): 100 by default
MA Source (Short): close by default
Simple RSI Limiter:
Limit using Simple RSI: true by default, if set to 'Normal', only enter long when Simple RSI is lower then Long Boundary, and only enter short when Simple RSI is higher then Short Boundary. If set to 'Reverse', only enter long when Simple RSI is higher then Long Boundary, and only enter short when Simple RSI is lower then Short Boundary.
Simple RSI Limiter Type:
RSI Length: 14 by default
RSI Source: hl2 by default
Simple RSI Long Boundary: 50 by default
Simple RSI Short Boundary: 50 by default
ADX Limiter:
Use ADX Limiter: true by default, only enter into any position (long/short) if ADX value is higher than the Low Boundary and lower than the High Boundary.
ADX Length: 5 by default
DI Length: 5 by default
High Boundary: 50 by default
Low Boundary: 20 by default
Use MA based calculation: Yes by default, if 'Yes', only enter into position (long/short) if ADX value is higher than MA (ADX as source).
MA Type: REMA by default
MA Length: 5 by default
Volume Filter:
Only enter trades where volume is higher then the volume-based MA: true by default, a set type of MA will be calculated with the volume as source, and set length
MA Type: EMA by default
MA Length: 10 by default
Session Limiter:
Show session plots: false by default, show crypto market sessions on chart: Sidney (red), Tokyo (orange), London (yellow), New York (green)
Use session limiter: false by default, if enabled, trades will only happen in the ticked sessions below.
Sidney session: false by default, session between: 15:00 - 00:00 (EST)
Tokyo session: false by default, session between: 19:00 - 04:00 (EST)
London session: false by default, session between: 03:00 - 11:00 (EST)
New York session: false by default, session between: 08:00 - 17:00 (EST)
Date Range:
Limit Between Dates: false by default
Start Date: Jul 01 2021 00:00:00 by default
End Date: Dec 31 2022 00:00:00 by default
Trading Time:
Limit Trading Time: false by default, tick this together with the options below to enable limiting based on day and time
Valid Trading Days Global: 1234567 by default, if the Limit Trading Time is on, trades will only happen on days that are present in this field. If any of the not global Valid Trading Days is used, this field will be neglected. Values represent days: Sunday (1), Monday (2), ..., Friday (6), Saturday(7) To trade on all days use: 123457
(1) Valid Trading Days: false, 1234567 by default, values represent days: Sunday (1), Monday (2), ..., Friday (6), Saturday(7) The script will trade on days that are present in this field. Please make sure that this field and also (1) Valid Trading Hours Between is checked
(1) Valid Trading Hours Between: false, 0930-1600 by default, hours between which the trades can happen. The time is always in the exchange's timezone
Fine-tuning is highly recommended when using other asset/timeframe combinations.

VWMA/SMA 3Commas BotThis strategy utilizes two pairs of different Moving Averages, two Volume-Weighted Moving Averages (VWMA) and two Simple Moving Averages (SMA).
There is a FAST and SLOW version of each VWMA and SMA.
The concept behind this strategy is that volume is not taken into account when calculating a Simple Moving Average.
Simple Moving Averages are often used to determine the dominant direction of price movement and to help a trader look past any short-term volatility or 'noise' from price movement, and instead determine the OVERALL direction of price movement so that one can trade in that direction (trend-following) or look for opportunities to trade AGAINST that direction (fading).
By comparing the different movements of a Volume-Weighted Moving Average against a Simple Moving Average of the same length, a trader can get a better picture of what price movements are actually significant, helping to reduce false signals that might occur from only using Simple Moving Averages.
The practical applications of this strategy are identifying dominant directional trends. These can be found when the Volume Weighted Moving Average is moving in the same direction as the Simple Moving Average, and ideally, tracking above it.
This would indicate that there is sufficient volume supporting an uptrend or downtrend, and thus gives traders additional confirmation to potentially look for a trade in that direction.
One can initially look for the Fast VWMA to track above the Fast SMA as your initial sign of bullish confirmation (reversed for downtrending markets). Then, when the Fast VWMA crosses over the Slow SMA, one can determine additional trend strength. Finally, when the Slow VWMA crosses over the Slow SMA, one can determine that the trend is truly strong.
Traders can choose to look for trade entries at either of those triggers, depending on risk tolerance and risk appetite.
Furthermore, this strategy can be used to identify divergence or weakness in trending movements. This is very helpful for identifying potential areas to exit one's trade or even look for counter-trend trades (reversals).
These moments occur when the Volume-Weighted Moving Average, either fast or slow, begins to trade in the opposite direction as their Simple Moving Average counterpart.
For instance, if price has been trending upwards for awhile, and the Fast VWMA begins to trade underneath the Fast SMA, this is an indication that volume is beginning to falter. Uptrends need appropriate volume to continue moving with momentum, so when we see volume begin to falter, it can be a potential sign of an upcoming reversal in trend.
Depending on how quickly one wants to enter into a movement, one could look for crosses of the Fast VWMA under/over the Fast SMA, crosses of the Fast VWMA over/under the Slow SMA, or crosses over/under of the Slow VWMA and the Slow SMA.
This concept was originally published here on TradingView by ProfitProgrammers.
Here is a link to his original indicator script:
I have added onto this concept by:
converting the original indicator into a strategy tester for backtesting
adding the ability to conveniently test long or short strategies, or both
adding the ability to calculate dynamic position sizes
adding the ability to calculate dynamic stop losses and take profit levels using the Average True Range
adding the ability to exit trades based on overbought/oversold crosses of the Stochastic RSI
conveniently switch between different thresholds or speeds of the Moving Average crosses to test different strategies on different asset classes
easily hook this strategy up to 3Commas for automation via their DCA bot feature
Full credit to ProfitProgrammers for the original concept and idea.
Any feedback or suggestions are greatly appreciated.
