TARVIS Labs - Bitcoin Macro Bottom/Top SignalsSCRIPT DESCRIPTION
This is a script specifically written to help provide indicators from a macro view. This script is best run on the 1 day interval on Bitstamp's $BTCUSD chart. It helps indicate when to accumulate bitcoin, and when its in a bull run when there are local tops, strong top warnings, and a signal to exit a bull run. This is described further below.
If you don't have interest in trading on the way to the top I suggest turning off the following indicators in the settings of the indicator:
- Opportunity To Buy Back In Indicator
- Local Top Near Bull Run Top Indicator
ACCUMULATION ZONE INDICATOR - LIGHT GREEN
Description
When we look at the history of Bitcoin every bottom has crossed below the 100 week EMA. Once it does its accompanied by hash ribbon cross with miner capitulation. After that is the prime time to accumulate as theres a clearer signal the bottom is in. Specifically, a signal to look for is the 14 day MACD/signal cross and the 14 day MACD continuing to stay above the signal until the price returns above the 100 week EMA. This is prime accumulation territory.
Strategy for Usage
A good strategy to use when accumulating the bottom is dollar-cost averaging over a 30 day period. The accumulation zone can last longer than 30 days but 30 days is a good range of time to DCA.
STRONG BUY IN ACCUMULATION ZONE INDICATOR - DARK GREEN
Description
We can add to the bottoming signal by looking for post-downtrend reversals inside the bottoming signal. We do this by using a 9/19 daily cross.
Strategy for Usage
These post-downtrend reversals can potentially provide better targeted days for accumulation than the broader bottoming signal and can be used to add more on that day than on an average day for the dollar cost average strategy. Say for example, use 1/3 of funds on these days rather than 1/30th.
OPPORTUNITY TO BUY BACK IN INDICATOR - BLUE
Description
When the 1d 18 EMA > 1d 63 EMA and the 12/52 1d crosses. These together provide good buy opportunities to buy bitcoin.
Strategy for Usage
If you happen to find yourself out of the market from your own TA or a trade, this signal can provide a buy opportunity to reenter the market if you're out of it.
BULL RUN LOCAL TOP INDICATOR - ORANGE
Description
We will similarly use the 100 week EMA to determine trend reversal into a bull run. When we see the 100 week EMA uptrending, we can begin to look for local tops using the 9/19 daily MACD/signal bearish cross along with the 12 EMA having a negative slope, which could be the beginning signal for a local top.
Strategy for Usage
This is a rather light indicator, but can be used in tandem with your own technical analysis to determine if you want to reenter after you exit from its signal.
LOCAL TOP NEAR BULL RUN TOP INDICATOR - RED
Description
When the 100 week EMA is in an uptrend we can look for significant loss of momentum in order to determine if a local top is in near a bull run top. Similar to the Bull Run Local Top Indicator, this strategy uses a MACD/signal cross but instead uses the 30/65 day EMAs.
Strategy for Usage
Ideally the right strategy to use here is to exit the market when this indicator starts. When the indicator ends if the "End of Bull Run Indicator" is not showing on the chart you can buy back into the market.
TOP IS LIKELY IN INDICATOR
Description
When the 100 week EMA is in a very strong uptrend and the 9/19 weekly MACD/signal bearish cross occurs, and the 63 EMA begins to downtrend.
Strategy for Usage
This signal typically accompanies the "Local Top Near Bull Run Top Indicator" therefore if you're following the strategy you would likely already be out of the market, but if you're not and this signal fires its a strong signal the top is in and we're likely going to start seeing a strong retrace. This is typically right before we see the "End of Bull Run Indicator". There is only one occurrence where it wasn't followed by a large drop & the "End of Bull Run Indicator" and that was in the 2017 bull run where there were many strong retracements post local top. The likelihood we see that again is low, but if it were to happen you can buy back into the market when the "Top is Likely In Indicator" and the "Local Top Near Bull Run Top Indicator" are not firing.
TOP IS LIKELY IN INDICATOR
Description
When the 100 week EMA is in a strong uptrend and the 9/19 weekly MACD/signal bearish cross occurs, and the 63 EMA begins to downtrend.
Strategy for Usage
This signal typically accompanies the "Local Top Near Bull Run Top Indicator" therefore if you're following the strategy you would likely already be out of the market, but if you're not and this signal fires its a strong signal the top is in and we're likely going to start seeing a strong retrace. This is typically right before we see the "End of Bull Run Indicator". There is only one occurrence where it wasn't followed by a large drop & the "End of Bull Run Indicator" and that was in the 2017 bull run where there were many strong retracements post local top. The likelihood we see that again is low, but if it were to happen you can buy back into the market when the "Top is Likely In Indicator" and the "Local Top Near Bull Run Top Indicator" are not firing.
END OF BULL RUN INDICATOR
Description
When the 100 week EMA is in an uptrend and the 1d 18 EMA crosses the 1d 63 EMA.
Strategy for Usage
When the 100 week EMA is a strong uptrend and the 18/63 cross occurs the top is very likely in. It has occurred in every bull run top leading to the bear market.
Cripto

MACD ULTRA with ALERTS - by OVARIDE WORK IN PROGRESS!
Coded by OVARIDE (littlegreenfish)
Made to be used with Dark Theme. Made to be used with Heikin Ashi bars (You can enable Real Price from chart settings). Test and use at your own risk. Not recommended for NEW/ INEXPERIENCED TRADERS using this for short-timeframe scalping. Bot integration is possible for high timeframes using the built-in alerts as a trigger via webhooks
Features
This is a reworked MACD code with added buffs for traders wanting more information from this basic indicator.
What this indicator does -
1. Plots a traditional MACD indicator with full input control from within the settings. All colors and values are editable , as you would expect from the standalone indicator.
2. Adds shape to the chart when MACD crosses over Signal line, while both MACD and Signal lines are below the ZERO line.
3. Adds shape to the chart when MACD crosses over ZERO line.
4. Highlights trend direction. Purple = Up Trend Likely , Yellow = Up Trend may end (use caution) , Red = Strong Down Trend Begins.
5. Ability to set alerts for -
a) When MACD crosses Signal Line.
b) When MACD crosses Zero line.
c) When an Up Trend is likely to begin.
d) When an Up Trend is slowing and may end.
e) When a Strong Down Trend begins.
Considerations -
1. Traders may use this indicator in conjunction with an existing strategy to confirm entries and exits. Traders may also use this indicator as a standalone indicator to assist with entries and exits.
2. Possible Long entries -
a) When MACD crosses Signal line while blow the Zero Line
b) When MACD crosses Zero
c) When Up Trend is Likely to begin and the background is highlighted in purple.
3. Possible stop-loss / exits (Omitted MACD crossing below Signal line and MACD crossing below Zero line)
a) When Up Trend Is slowing and the background is highlighted Yellow
b) When a Strong Down trend begins and the background is highlighted in Red. All open long position trades should be ended here.
4. The trend algorithm is hard-coded. Changing the MACD and Signal values from within the settings WILL NOT change the result of when and how the trend directions are highlighted.
5. Trend highlights are ONLY A GUIDE . You can still take entry positions in non-highlighted, yellow or red regions if your overall technical analysis tells you to.
UPDATE NOTES (IF ANY) WILL BE PUBLISHED BELOW

Bitfinex Shorts StratOverview
This strat applies the data from BITFINEX:USDSHORTS to the RSI indicator in order to provide SHORT/LONG entries as the number of contracts goes up and down. Although Bitfinex has lost relevance over the years its generally considered an exchange dominated by smart money rather than retail. I'd like to see if any insights can be gained by following their trading behaviour.
How to use
Select the underlying security you wish to trade and load the indicator. Select the appropriate short security by searching in the Bitfinex Short Symbol. RSI settings apply to short symbol not the actual asset. Strategy shorts the underlying asset when shorts rise and longs when they drop. The shorts symbol will follow the value of the loaded chart. Works best on 4 hour chart.
Why use shorts only rather than both long/shorts?
Bitfinex longs seem to be on a long-term uptrend accounting for 25x the number of shorts. Might be enormous confidence on part of the whales, but more likely reflects selling spot and buying perp. Given the size disparity and price action I don't think longs info is adding much.
Problems with script:
a) We don't really know the intentions of short players (e.g. speculation or hedging spot)
b) The script uses a decline in shorts as a long signal
c) RSI is a blunt tool there are probably better options for calculating high/lows in shorts
d) Shorts are accumulated both at highs and also when BTC price is already heavily trending down. This suggests some are speculative (at the highs) or protective/hedging during a decline
Takeaways:
Based on this strat Bitfinex whales are more wrong than right.
Results don't carry across well into altcoins using the accompanying short symbol. However, what is interesting is that applying the BITFINEX:BTCUSDSHORTS to altcoin charts does work pretty well.
Strat needs some refinement to control for entries under different circumstances.
Probably not a great idea to use this as a strategy in isolation, but highlights how Bitfinex whale behaviour is a good gauge to follow.

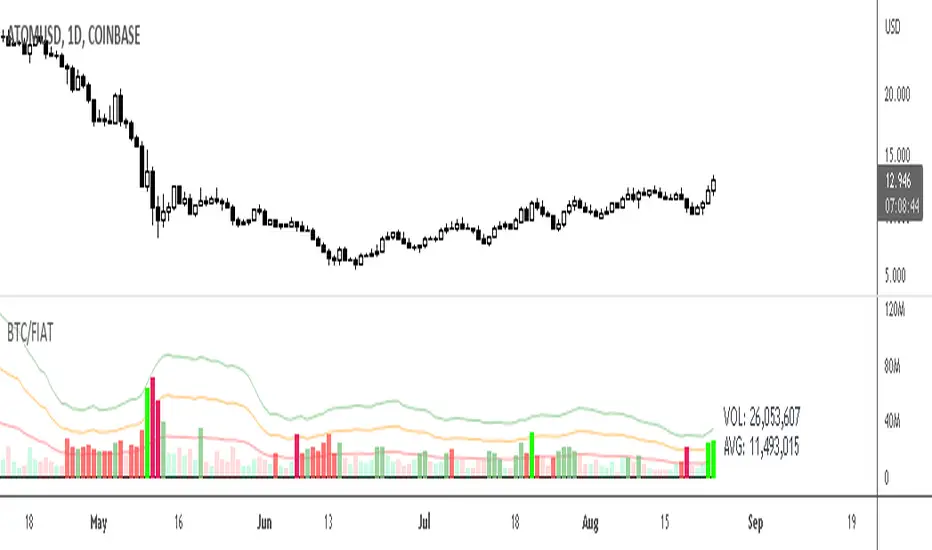
BTC/Fiat Inverse Volume Info for Altcoins
displays the Alt Coin volume in BTC if it is a BTC pair (or whatever the quote currency is)
displays the Alt Coin volume in USDT if it is a USDT pair (or whatever the quote currency)
displays the current volume and average volume in label beside bars
volume bars that exceed averages are highlighted
configuration options and moving average overrides available
alerts enabled
Ichimoku Cloud with ADX (By Coinrule)The Ichimoku Cloud is a collection of technical indicators that show support and resistance levels, as well as momentum and trend direction. It does this by taking multiple averages and plotting them on a chart. It also uses these figures to compute a “cloud” that attempts to forecast where the price may find support or resistance in the future.
The Ichimoku Cloud was developed by Goichi Hosoda, a Japanese journalist, and published in the late 1960s. It provides more data points than the standard candlestick chart. While it seems complicated at first glance, those familiar with how to read the charts often find it easy to understand with well-defined trading signals.
The Ichimoku Cloud is composed of five lines or calculations, two of which comprise a cloud where the difference between the two lines is shaded in.
The lines include a nine-period average, a 26-period average, an average of those two averages, a 52-period average, and a lagging closing price line.
The cloud is a key part of the indicator. When the price is below the cloud, the trend is down. When the price is above the cloud, the trend is up.
The above trend signals are strengthened if the cloud is moving in the same direction as the price. For example, during an uptrend, the top of the cloud is moving up, or during a downtrend, the bottom of the cloud is moving down.
DMI is simple to interpret. When +DI > - DI, it means the price is trending up. On the other hand, when -DI > +DI , the trend is weak or moving on the downside. The ADX does not give an indication about the direction but about the strength of the trend.
Typically values of ADX above 25 mean that the trend is steeply moving up or down, based on the -DI and +D positioning. This script aims to capture swings in the DMI, and thus, in the trend of the asset, using a contrarian approach.
Trading on high values of ADX , the strategy tries to spot extremely oversold and overbought conditions. Values of ADX above 45 may suggest that the trend has overextended and is may be about to reverse.
This strategy combines the Ichimoku Cloud with the ADX indicator to better enter trades.
Long/Short orders are placed when these basic signals are triggered.
Long Position:
Tenkan-Sen is above the Kijun-Sen
Chikou-Span is above the close of 26 bars ago
Close is above the Kumo Cloud
MACD line crosses over the signal line
-DI is greater than +DI
ADX is greater than 45
Short Position:
Tenkan-Sen is below the Kijun-Sen
Chikou-Span is below the close of 26 bars ago
Close is below the Kumo Cloud
MACD line crosses under the signal line
+DI is greater than -DI
ADX is less than 45
The script is backtested from 1 January 2022 and provides good returns.
The strategy assumes each order is using 30% of the available coins to make the results more realistic and to simulate you only ran this strategy on 30% of your holdings. A trading fee of 0.1% is also taken into account and is aligned to the base fee applied on Binance.
This script also works well on MATIC (15m timeframe), ETH (5m timeframe), and SOL (15m timeframe).

ALMA/EMA/SRSI Strategy + IndicatorBack with another great high hit rate strategy!!
Disclaimer* This strategy was sampled using source code written by @ClassicScott , as referred to in the script, there is a clear line where the source code was scripted by myself.
This Strategy consists of three key factors, the ALMA, EMA crossover, and a Stochastic Rsi
ALMA: The Alma is the step line shown, turning green and red at select times. This average value gives general oversight of the macro movement of price action. and this particular one was coded by Mr.ClassicScott.
EMA crossover: At the input screen you are given an option of the fast and slow ema's. The default is solely for the hit rate and correlation to the Alma of this strategy. The arrows you see depicted on the chart are the crossover events happening.
Stochastic Rsi: The Stochastic Rsi is a stochastic value, using data sampled from the rsi. The use of this indicator in my strategy is to prevent entries when too overbought and oversold, as well as closures and vice versa, to prevent holding bags either way.
Fixed % TP: In the input screen you are given a take profit and stop loss percentage, for good R/R the hit rate will take a notch down, but with no R/R it will be near perfect.
How to use this:
Add it to your chart to get the strategy inputs. (The strategy is really only useful on a 15min TF. However the indicator within it can be used on anything at anytime!)
Watch the yellow and aqua moving averages, these are your ema's and crossover's will trigger signals based on your integer inputs.
Find Correlation between other leading indicators, as well as crossover's down/up and a red/green alma.
DO NOT use the arrows as buy/sell signals. These are simply to show ema's are crossing under or over. Momentum indicator's paired with this can be useful to determine if it could be a buy signal or sell signal.
Cheat Code's Notes:
Almost at 1000 boosts!!! I appreciate the support from everyone and I will keep trying my best to deliver quality strategies for the people.
-Cheat Code
BYBIT:BTCUSDT

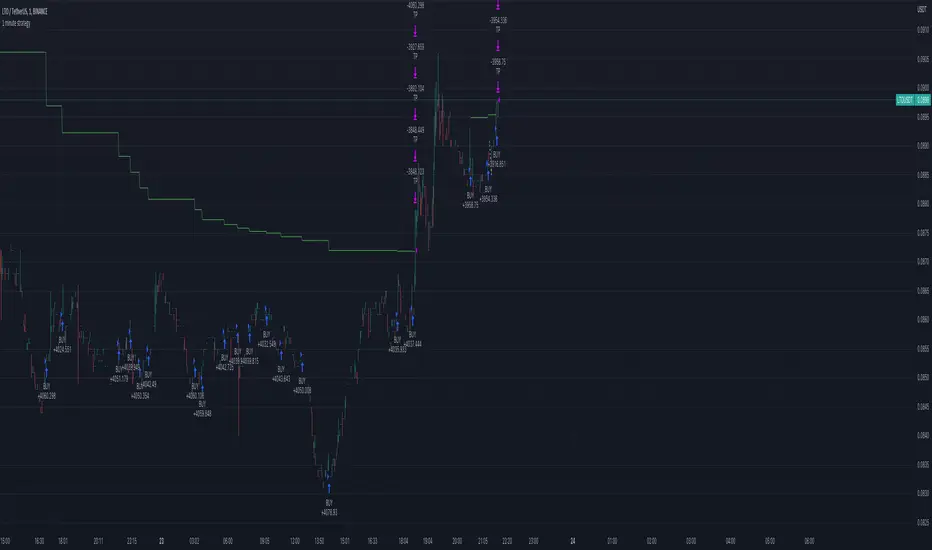
1 minute crypto strategy (MTF ZigZag)Please read the following explanation and notes before using this strategy.
This strategy is based on pyramiding. It uses two trend indicators(zigzag) in two different timeframes. One can be used to identify trend in higher timeframe and the other can be used to identify trend in smaller time frame. You can change them according to your preference. The default timeframes are set the same so the strategy only opens the trades according to one timeframe (20min). You can change the timeframe of the trend indicators to any timeframe in the settings but first you should add that timeframe to your chart timeframe so you can see that timeframe in the settings.
The first timeframe is for lower timeframe trend identification and the second timeframe is for higher timeframe identification in the settings.
IMPORTANT NOTES:
1. This strategy works best with low cap high volatile Cryptos. It is riskier on big cap cryptos in long term since it takes longer for them to recover from a big drop.
2. This strategy works in any timeframe. The lower the TF the higher profit.
3. This strategy is LONG only (spot).
4. It is very important to run a deep backtest (for example 1 year) and change the settings accordingly on the cryptos you want to trade to see how it performs in longterm.
5. The default pyramiding value is 30 and 3.33% of the portfolio (100/30=3.33%) is used for each trade. It means the strategy opens maximum 30 trades before the TP is hit. If you change the pyramiding you should also change order size as well in order for the strategy to show the exact calculation (your portfolio amount percentage/pyramiding value=ordersize percentage). If you increase pyramiding value the strategy performs safer in long term.
6. The default TP is 1% and the default SL is 80%. You can change the settings according to the backtest on the coins you want to trade. But it is better not to increase the TP.
7. The indicators don't repaint.
8. Please make sure to backtest and fully understand the way this strategy works before using it.
Fast v Slow Moving Averages Strategy (Variable) [divonn1994]This is a simple moving average based strategy that takes 2 moving averages, a Fast and a Slow one, plots them both, and then decides to enter a 'long' position or exit it based on whether the two lines have crossed each other. It goes 'long when the Fast Moving Average crosses above the Slow Moving Average. This could indicate upwards momentum in prices in the future. It then exits the position when the the Fast Moving Average crosses back below. This could indicate downwards momentum in prices in the future. This is only speculative, though, but sometimes it can be a very good indicator/strategy to predict future action.
I've tried some strategy settings and I found different promising strategies. Here are a few:
BTCUSD ( BitStamp ) 1 Day Timeframe : EMA, Fast length 25 bars, Slow length 62 bars => 28,792x net profit (default)
BTCUSD ( BitStamp ) 1 Day Timeframe : VWMA, Fast length 21 bars, Slow length 60 bars => 15,603x net profit
BTCUSD ( BitStamp ) 1 Day Timeframe : SMA, Fast length 18 bars, Slow length 51 bars => 19,507x net profit
BTCUSD ( BitStamp ) 1 Day Timeframe : RMA, Fast length 20 bars, Slow length 52 bars => 5,729x net profit
BTCUSD ( BitStamp ) 1 Day Timeframe : WMA, Fast length 29 bars, Slow length 60 bars => 19,869x net profit
Features:
-You can choose your preferred moving average: SMA , EMA , WMA , RMA & VWMA .
-You can change the length average for each moving average
-I made the background color Green when you're currently in a long position and Red when not. I made it so you can see when you'd be actively in a trade or not. The Red and Green background colors can be toggled on/off in order to see other indicators more clearly overlayed in the chart, or if you prefer a cleaner look on your charts.
-I also have a plot of the Fast moving average and Slow moving average together. The Opening moving average is Purple, the Closing moving average is White. White on top is a sign of a potential upswing and purple on top is a sign of a potential downswing. I've made this also able to be toggled on/off.
Let me know if you think I should change anything with my script, I'm always open to constructive criticism so feel free to comment below :)

Munich's Momentum Wave V2MUNICH'S MOMENTUM WAVE VERSION 2 IS LIVE!!!
There are a few big things to note with this one.
I decided to upload this as an entirely new script due to the number of changes differing from the first version, but as the last one, this will still work on ANY TIMEFRAME, ANY ASSET CLASS, ANY PRICE! .
This momentum wave indicator now will give you data for when trend could turn, and two momentum indicators to help you decide when to take an entry.
First off,
*I have added an alma ma (alma) that will track momentum alongside price action and further lead the indicator consisting of the Munich waves.
* The background feature will track the price using a method derived from the Bollinger bands, after calculations, it will color the background based on the average of the momentum's ema's, the alma ma, and also the alma in comparison to the alma's value pre offset ( the offset is 3, following the basis).
*There are now 5 basis values given from the increase in ema samples.
If anyone has any questions feel free to pm me or comment below. Thank you guys for the support! :)
INDEX:BTCUSD TVC:NDQ AMEX:SPY BITSTAMP:ETHUSD BINANCE:BTCUSDT FX:USDJPY NASDAQ:AAPL

München's Momentum WaveMUNICH'S MOMENTUM WAVE:
This momentum tracker has features sampled from Madrid's moving average ribbon but has differentiated many values, parameters, and usage of integers. It is derived using momentum and then creates moving averages and mean lengths to help support the strength of a move in price action, and also has the key mean length that helps determine HL/LH or rejections into trend continuation. This indicator works on ALL TIME FRAMES, ALL ASSET CLASSES ON ALL SETTINGS!!
HOW DO I USE IT?
*First off, I have arranged the input settings into groups based on the parts of the indicator it affects.
*You want to use the aqua/white/yellow (Munich's line) as your leading indicator, this is a combined average of the MoM indicator.
* When using Munich's line you want to look at the relation to the mean line (the flat line that adjusts based on price action. You will often see rejections of this line into trend continuation. I personally have caught perfect LH/HL bounce trades off of this indicator.
* Use the Background and other colored moving averages to help pre-determine moves based on the -3 offset value of Munich's line. This was by design not to create 'accurate' results, but to help predict momentum swings based on sharper moves in price action better than if all values lined up to the current bar.
Cheat Code's Notes:
I hope you guys find this indicator to be useful, this is most likely the best indicator that I have written. Simply for the fact it is useful on any chart, any timeframe with any setting. If you guys have any issues with it, shoot me a pm or drop a comment. Thanks!
-CheatCode1
BINANCE:BTCUSDT BITSTAMP:ETHUSD BITSTAMP:BTCUSD PEPPERSTONE:JPYX TVC:DXY TVC:NDQ AMEX:SPY

Ichimoku Cloud with MACD (By Coinrule)The Ichimoku Cloud is a collection of technical indicators that show support and resistance levels, as well as momentum and trend direction. It does this by taking multiple averages and plotting them on a chart. It also uses these figures to compute a “cloud” that attempts to forecast where the price may find support or resistance in the future.
The Ichimoku Cloud was developed by Goichi Hosoda, a Japanese journalist, and published in the late 1960s. It provides more data points than the standard candlestick chart. While it seems complicated at first glance, those familiar with how to read the charts often find it easy to understand with well-defined trading signals.
The Ichimoku Cloud is composed of five lines or calculations, two of which comprise a cloud where the difference between the two lines is shaded in.
The lines include a nine-period average, a 26-period average, an average of those two averages, a 52-period average, and a lagging closing price line.
The cloud is a key part of the indicator. When the price is below the cloud, the trend is down. When the price is above the cloud, the trend is up.
The above trend signals are strengthened if the cloud is moving in the same direction as the price. For example, during an uptrend, the top of the cloud is moving up, or during a downtrend, the bottom of the cloud is moving down.
The MACD is a trend following momentum indicator and provides identification of short-term trend direction. In this variation it utilises the 12-period as the fast and 26-period as the slow length EMAs, with signal smoothing set at 9.
This strategy combines the Ichimoku Cloud with the MACD indicator to better enter trades.
Long/Short orders are placed when three basic signals are triggered.
Long Position:
Tenkan-Sen is above the Kijun-Sen
Chikou-Span is above the close of 26 bars ago
Close is above the Kumo Cloud
MACD line crosses over the signal line
Short Position:
Tenkan-Sen is below the Kijun-Sen
Chikou-Span is below the close of 26 bars ago
Close is below the Kumo Cloud
MACD line crosses under the signal line
The script is backtested from 1 June 2022 and provides good returns.
The strategy assumes each order is using 30% of the available coins to make the results more realistic and to simulate you only ran this strategy on 30% of your holdings. A trading fee of 0.1% is also taken into account and is aligned to the base fee applied on Binance.
This script also works well on MATIC (1h timeframe), AVA (45m timeframe), and BTC (30m timeframe).

Short Term RSI and SMA Percentage ChangeThis strategy utilises common indicators like RSI and moving averages in order to enter and exit trades. The Relative Strength Index (RSI) is a momentum indicator that has a value between 0 and 100, where a value greater than 70 is considered overbought and a value less than 30 is oversold. If the RSI value is above or below these values, then it can signal a possible trend reversal.
The second indicator used in this strategy is the Simple Moving Average (SMA). A SMA is an arithmetic moving average calculated by adding recent prices and then dividing that figure by the number of time periods in the calculation average. For example, one could add the closing price of a coin for a number of time periods and then divide this total by that same number of periods. Short-term averages respond quickly to changes in the price of the underlying coin, while long-term averages are slower to react.
Long/Exit orders are placed when three basic signals are triggered.
Long Position:
RSI is greater than 50
MA9 is greater than MA100
MA9 increases by 6%
Exit Position:
Price increases 5% trailing
Price decreases 5% trailing
The script is backtested from 1 May 2022 and provides good returns.
A trading fee of 0.1% is also taken into account and is aligned to the base fee applied on Binance.
This script also works well on AVAX 45m/1h, MATIC 15m/45m/1h and ETH 4h.

Stablecoins CorrelationThe indicator shows the correlation between stablecoins and bitcoin by means of liquidity flowing from stables to crypto and back. Where the indicator has highs, the bitcoin is usually the bottom and vice versa.

Dap's Oscillator- Short Term Momentum and Trend. BINANCE:BTCUSDT BYBIT:BTCUSDT BYBIT:ETHUSDT BINANCE:ETHUSDT
DAP's OSCILLATOR:
WHAT IS IT?
This Oscillator was created to inspire confidence in the short-term trend of traders. This will work very well with a volatility metric (I recommend BBWP by @The_Caretaker)
WHAT IS IT MADE OF?
1. Consists of a series of equations (mainly the difference between simple to exponential moving averages) and Standard deviations of these moving average differences (length equivalent to the length of sampled ma's)
2. These equations are then boiled down through an averaging process array, after averaging the covariants are equated against the variants of the positive side of the array. This is what is presented as the aqua line.
3. The RC average (yellow) is the sma following the DAP'S Oscillator at a specified length
4. The most important part of this indicator is simply the momentum oscillator represented as a green or red line based on the value relative to the Oscillators.
HOW DO I USE THIS?
As I mentioned before mixed with a volatility metric, it should set you up for a good decision based on short-term trends. I would say to be careful for periods of consolidation, with the consolidation the momentum often meets hands with DAP's Oscillator and can cause fake-outs. You want to spot divergences from the price to the momentum difference, as well as room to work down or upward to secure a good entry on a position.
CHEAT CODE'S NOTES:
I appreciate everyone who has boosted my previous scripts, it means a lot. If you want to translate words to pine script onto a chart, feel free to PM me. I would be happy to help bring an indicator to life. I may take a quick break but will be back shortly to help create more cheat codes for yall. Thanks!
-Cheat Code

Trendmaster - Collated Funding RatesCollated Funding Rates is a Crypto Specific Indicator that pulls Exchange Funding Rate Data from several exchanges for both Bitcoin and Ethereum.
By combining both the Funding Data for Bitcoin and Ethereum across several exchanges, a Trader can see the Collated Funding Rates from several Crypto Exchanges.
What are Funding Rates?
Funding rates are periodic payments either to traders that are long or short based on the difference between perpetual contract markets and spot prices.
Therefore, depending on open positions, traders will either pay or receive funding. Crypto funding rates prevent lasting divergence in the price of both markets
These Funding Rates also incentivize Liquidity Providers to take certain positions whether Long or Short based on the Funding Rate.
What are Liquidity Providers?
A Liquidity Provider, also known as a Market Maker, is someone who provides their crypto assets to a platform to help with the decentralization of trading.
In return, they are rewarded with fees generated by trades on that platform, which can be thought of as a form of passive income.
H ow to use Collated Funding Rates:
When the Funding Rate is positive, the price of the perpetual contract is usually higher than the market price.
Thus, traders who are long pay for short positions. Conversely, a negative Funding Rate means that short positions pay for longs.
As the funding rate increases from negative to positive Traders and Liquidity Providers are incentivized to take short positions.
This can be seen on the indicator as it moves from down to up and changes from red to green.
As the funding rate decreases from positive to negative Traders and Liquidity Providers are incentivized to take long positions.
This can be seen on the indicator as it moves from up to down and changes from green to red.
Funding Rates are used by Exchanges to manipulate the price.
Because of this fact, Collated Funding Rates can show trend changes based on when a specific up or down move in Price is incentivized by Exchange Funding Rates.

Trendmaster - LiquidationsTrendmaster™ - Liquidations is a Crypto Specific Indicator that shows liquidation levels depending on the leverage of positions entered within a certain period.
What are Liquidation Levels?
A liquidation level is expressed as a percentage value of the assets in a trader's margin account.
If a Crypto trader's positions go against them, their account will eventually reach the liquidation level, unless the trader injects additional funds.
Another name for liquidation level is liquidation margin.
How to use Liquidations:
High leverage positions such as 100x or 50x traders have a higher probability of being liquidated within intraday trading.
The lower a trader's leverage is, can decrease the probability of their position getting liquidated.
This means that using the Liquidations Indicator, users can see other traders’ liquidation levels based on several time periods.
The liquidation levels shown by the Indicator are 100x, 50x, 20x, 10x, 5x, 3x, and 2x in the periods Daily, Weekly, Monthly, and Yearly.
This means that within a certain period users can see the liquidation positions of other traders at all of those periods and use that information to predict price movements and reversal points.

[B_2] 15min Crypto (Based on Technical Analysis)Republish.
HOW IT WORKS:
+ Open Long: When price close above Kumo Cloud 15m, SuperTrend 15m, RSI > 50, MACD signal (12,26,19) >0, break up Pivot High previous. Dont open long when price close just below resistants in higher timeframe (SuperTrend 2H, 4H).
+ Exit Long: When price hit TPs or SL or having Short Signals.
+ Open Short: When price close below Kumo Cloud 15m, SuperTrend 15m, RSI < 50, MACD signal (12,26,19) <0, break down Pivot Low previous.
+ Exit Short: When price hit TPs or SL or having Long Signals.
HOW TO DO IT:
Very easy to use this script. It only has 2 parts: SETUP ENTRY and SETUP EXIT.
1. SETUP ENTRY:
This strategy uses the rule of dividing capital to enter multiple orders. For example, a common rule 5-3-2 (ie: total capital is 100%, entry 1 is 50%, entry 2 is 30% and entry 3 is 20%). In this strategy, I split my capital into 4 entries. You can customize the capital percentage and price deviation for each entry.
2. SETUP EXIT:
+ Multi profit.
+ Stoploss: you have two options: Stoploss based on percentage or ATR.
+ When price hit TP1, you have two options: only move Stoploss to entry or active trailing.
BACKTEST: You can backtest this strategy on coins: ETH, CRV , RUNE, MATIC, SRM and some like: MKRUSDTPERP , AAVEUSDTPERP , SOLUSDTPERP , ETCUSDTPERP , FILUSDTPERP , BALUSDTPERP , NEARUSDTPERP , SRMUSDTPERP , ALPHAUSDTPERP , DGBUSDTPERP, ...
If you want use this scripts with setup alert or open code, please inbox to me, you are always welcome.

Ichimoku Cloud with RSI (By Coinrule)The Ichimoku Cloud is a collection of technical indicators that show support and resistance levels, as well as momentum and trend direction. It does this by taking multiple averages and plotting them on a chart. It also uses these figures to compute a “cloud” that attempts to forecast where the price may find support or resistance in the future.
The Ichimoku Cloud was developed by Goichi Hosoda, a Japanese journalist, and published in the late 1960s. It provides more data points than the standard candlestick chart. While it seems complicated at first glance, those familiar with how to read the charts often find it easy to understand with well-defined trading signals.
The Ichimoku Cloud is composed of five lines or calculations, two of which comprise a cloud where the difference between the two lines is shaded in.
The lines include a nine-period average, a 26-period average, an average of those two averages, a 52-period average, and a lagging closing price line.
The cloud is a key part of the indicator. When the price is below the cloud, the trend is down. When the price is above the cloud, the trend is up.
The above trend signals are strengthened if the cloud is moving in the same direction as the price. For example, during an uptrend, the top of the cloud is moving up, or during a downtrend, the bottom of the cloud is moving down.
This strategy combines the Ichimoku Cloud with the RSI indicator to better enter trades.
Long/Short orders are placed when three basic signals are triggered.
Long Position:
Tenkan-Sen is above the Kijun-Sen
Chikou-Span is above the close of 26 bars ago
Close is above the Kumo Cloud
RSI is greater less than 50
Short Position:
Tenkan-Sen is below the Kijun-Sen
Chikou-Span is below the close of 26 bars ago
Close is below the Kumo Cloud
RSI is greater than 50
The script is backtested from 1 June 2022 and provides good returns.
The strategy assumes each order is using 30% of the available coins to make the results more realistic and to simulate you only ran this strategy on 30% of your holdings. A trading fee of 0.1% is also taken into account and is aligned to the base fee applied on Binance.
This script also works well on SOL (45m timeframe), BNB (1h timeframe), and ETH (1h timeframe).

Gators Oscillator - Bitcoin Scalp Trader(T&M/e V3!!)Gator's Oscillator:
**For reference, all numbers, and settings displayed on the input screen are only what I HAVE FOUND to be profitable for my own strategy, Yours will differ. This is not financial advice and I am not a financial advisor. Please do your due diligence and own research before considering taking entries based on this strategy and indicator. I am not advertising investing, trading, or skills untaught, this is simply to help incorporate into your own strategy and improve your trading journey!**
INPUTS:
EV: This is an integer value set to default at 55. This value is equated to the lead value, volatility measurement, and standard deviation between averages
EV 2: This integer is used as the base value and is meant to always be GREATER THEN EV, the default is set at 163. There should be at least a 90+ integer difference between EVs for data accuracy.
EV TYPE & EV TYPE 2: This option only affects the output for the moving average histograms. (and data inserted for strategy)
Volatility Smoothing: This is the smoothness of the custom-made volatility oscillator. I have this default at 1 to show time-worthy-term (3.9%+) moves or significant trends to correspond with the standard deviation declination between EVMA and EVMA2.
Directional Length: This is the amount of data observed per candle in the bull versus bear indicator.
Take Profit: Pre-set takes profit level that is set to 4 but can be adjusted for user experience.
Style:
Base Length: Columns equated using a custom-made statistical equation derived from EV TYPE 2+EV2 to determine a range of differential in historic averages to a micro-scale.
Lead Length: Columns equated using a custom-made statistical equation derived from EV TYPE+EV to determine a range of differential in historic averages to a micro-scale.
Weighted EMA Differential: Equation expressing the differences between exponential and simple averages derived from EV+EV Type 2. Default is displaying none, but optional for use if found helpful.
Volatility: Represents volatility from multiple data sets spanning from Bollinger bands to HPV and translated through smoothing.
Bull Strength: The strength of Bulls in the current trend is derived from a DMI+RSI+MACD equation to represent where the trend lies.
Bear Strength: The strength of Bears in the current trend is derived from a DMI+RSI+MACD equation to represent where the trend lies.
(NEW) Standard Deviation between Moving Averages: Use this logarithmic indicator depicted as circles to help determine whether a move is a fake out or not. Compare the circles with the volatility line, if you see them deviating away, it is either a bull/bear trap or trend continuation is imminent until they correlate back together.
CHEAT CODE'S NOTES:
Do not use this indicator on high leverage. I have personally used this indicator for a week and faced a max of 8% drawdown, albeit painful I was on low leverage and still closed on my take profit level.
85% is not 100% do not overtrade using this indicator's entry conditions if you have made 4 consecutive profitable trades.
Mess around with the input values and let me know if you find an even BETTER hit rate, 30+ entries, and a good drawdown!!
V2 UPGRADES:
*Increased Opacity on Bull Bear Columns
*Removed the Stop Loss Input option
*Decreased EV2 to a default of 143 for accuracy
*Added additional disclaimers in the description
* Removed Bull/Bear offset values for accuracy
V3 UPGRADES:
*ADDED THE EMA DIFFERENTIAL FROM SMA STANDARD DEVIATION INDICATOR. REPRESENTED BY PURPLE BARS THAT PLOT BRIGHT AT EXTREME LEVELS (Translate this to the EMA's and SMA's are very far apart) This is a fantastic way to resolve volatility and momentum in one indicator!!
*Line Width increased for volatility
*plot's for Oversold Alma reduced to 3, also adjusted the plot shape to arrows corresponding to 'overbought/oversold values. Look for a cross-over from green/red plot to transparent for best signals.
*Histograms for bull/bear strength correspond to an increase or decrease in value
*Input screen converted into groups, with bull/bear color inline
*Converted base/lead length value's into areas with breaks. IF YOU SEE WHITE (Short/Lead Length), IT IS A SHORT TERM MOVE AND SCALPING OPPORTUNITY. IF YOU SEE BLUE(Long/Base Length) IT MEANS IT IS A MACRO MOVE, WHICH MAY LAST LONGER
-Cheat Code
BINANCE:BTCUSDT BYBIT:BTCUSDT COINBASE:BTCUSD

Crypto Terminal [Kioseff Trading]Hello!
Introducing Crypto Terminal (:
The indicator makes use of cryptocurrency data provided by vendor INTOTHEBLOCK.
NOTE: The cryptocurrency on your chart must be paired with USD or USDT. Data won't load otherwise - possibly transient. For instance, BTCUSD or BTCUSDT, ETHUSD or ETHUSDT.
Provided datasets:
Twitter Sentiment Data
Telegram Sentiment Data
Whale Data (i.e. % of Asset Belonging to Whales)
$100,000+ Transactions
Bulls/Bears (Bulls Buying | Bears Selling)
Current Position PnL (Currently Open Positions for the Coin are Retrieved and Plotted. Data is Split into Currently Profitable Positions, Losing Positions, and B/E Positions)
Average Balance
Holders/Traders Percentage (Addresses are Retrieved and Classified as Holding Accounts or Trader Accounts)
Correlation
Futures OI
Perpetual OI
Zero Balance Addresses
Flow (Money Inflow & Outflow)
Active Addresses
Average Transaction Time
Realized PnL (Addresses with Realized Profits, Realized Losses, and B/E)
Cruisers
A few more data points are provided.
Additionally, you can plot the values of any dataset in a pane below price.
Below are images of plottable data; different cryptocurrencies will be shown for each example (:
Twitter sentiment data.
Assess this data lightly; difficult to confirm accuracy.
Telegram sentiment data.
Assess this data lightly; difficult to confirm accuracy.
Percentage of asset belonging to whales.
$100,000+ transactions (volume oriented)
Bulls buying; bears selling.
Current positions at profit; current positions at loss; current positions at breakeven.
Average balance.
Percentage of asset belonging to traders; percentage of asset belonging to holders.
Asset's 30-interval correlation to BTC.
Perpetual open interest.
Zero-balance addresses.
Flows.
Active addresses.
Average transaction time.
Addresses at realized profit; addresses at realized loss; addresses at breakeven.
Cruiser data.
Futures open interest.
Naturally, this data isn't provided for every cryptocurrency; NaN values are returned in some instances.
Table 1
I provided three data tables, which load independently, so you don't have to change plotted data to access values.
Table 2
Lastly, you can create a 10-asset crypto index and run calculations against it.
The image shows an example.
I'll update this script with additional calculations/data in the near future. If you've any suggestions - please let me know!
Enjoy (:

LudovicaLudovica is a trend following strategy that works on intraday timeframes (15 minutes).
The stop loss is decided based on the last price movement, take profits are projected through a Fibonacci extension. Two different extensions are calculated, based on a filter that affects the last price movement it is chosen which one to use for take profits.
Money management is fixed fractional: regardless of the distance between entry point and stop loss, the risk on capital for each trade is decided by the user in the strategy inputs. Take profits from 1 to 4 plan to exit with 15% of the initial size, TPs from 5 to 8 plan to exit with 10% of initial size.
There is a trailing stop system to reduce the drawdown of the strategy (note that stop loss moves as the trade develops).
Take profits are limit orders, stops (loss or trailing) occur at candlestick close (set alerts on the strategy).
Optimized strategies selectable from input panel:
-ETHUSDTPERP 15 min
-CRVUSDTPERP 15 min v1
-CRVUSDTPERP 15 min v2
-SNXUSDTPERP 15 min
Other pairs in development and soon available.
This strategy is in beta stage.

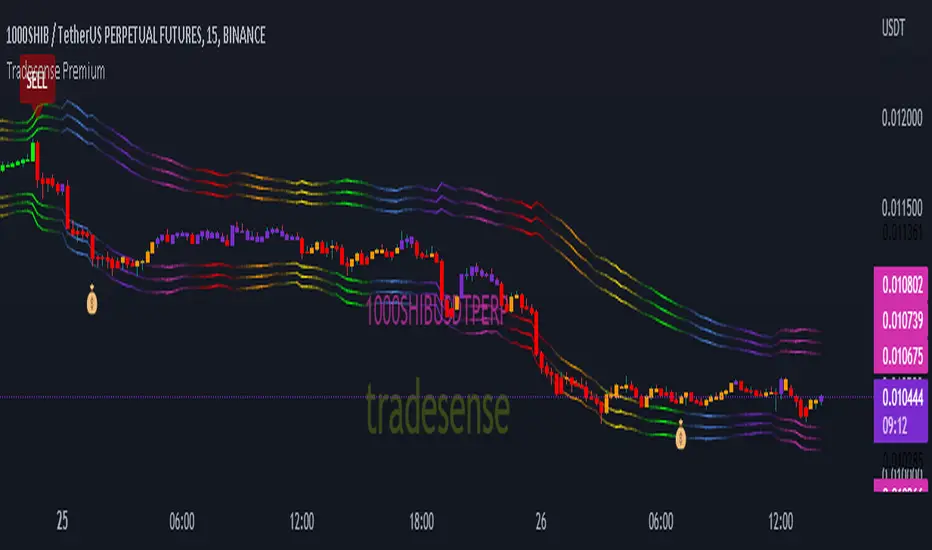
Tradesense PremiumTradesense Premium
Tradesense Premium indicator offers a buy & sell signal that is based from our senior analyst who have more than 10years of experience in Forex, Stock and Crypto trading and made it possible by our pine script developers.
Our script can detect market volatility based on the price direction and the absolute value of exponential moving average are multiplied to specific numbers to get a different trading style such as Scalper, Swing Trader and Trend Follower. We also filtered out all the signals using a different known indicators such as RSI, ATR, and ADX, and the results will allow you to enter a trade before the big moves occur. We also included all the important indicator which appears in real-time to get a competitive advantage in any market environment.
If you are a trader for a long time you should know that there is no way to avoid risk in trading. Every single trade could, theoretically at least, end up a loser. That is why our script also provides automatic risk management system which can gives you the ability to know exactly where to take the profit and to stop.
Trading style preset options - Will allows you to get the signals the way you wanted depending on your trading style. Ex. Scalper, Swing Trader or a Trend follower.
Bar color - Our bar colors are based on the price actions which detects the weakness of the bar or if the bar is ranging.
Reversal Zone - This indicator would identify possible price reversal zones.
Support & Resistance - This indicator draw a line at the pivot point to show possible support and resistance area.
Target Profit indicator based on price actions - This indicator will gives you an option to reduce your position or go out of the trade before the reversal happens.
Target Profit / Stop Loss based on ATR - This indicator will gives you a simple but effective risk management system to protect your capital. The TP/SL is based from the ATR.
Alert System - We are giving you an options to customize your alerts.
Our mission is to provide systematic way to build your success.
Release notes: Tradesense Premium V1.1
✅Trading style preset options
✅Bar color
✅Reversal Zone
✅Support & Resistance
✅Target Profit indicator based on price actions
✅Target Profit / Stop Loss based on ATR
✅Alert System
❓Trading style
Currently we have 3 sets of preset options that the user can use.
Scalp - this preset is made for the trader that wants a quick in and out of the trade. The best timeframe to this is 1min to 5mins chart.
Swing - this preset is for the trader who can wait a little bit longer in a trade. The best timeframe to use is 15mins to 1hour chart.
Trend - this preset is made for the busy people that can hold a trade more than a day. The best timeframe to use is 4hours to 1day chart.
❓Bar color
This options will change the color of your bars to lessen the noise of your chart.
Green Color is a bullish indicator
Red Color is a bearish indicator
Orange Color will signify that the trend is weakening
Purple Color is a consolidation/ranging price action
❓Reversal Zone
From the name it self, once the price is already hit the Reversal Zone the price will more likely to reverse or will make a correction.
❓Support & Resistance
When this option is enabled, the support and resistance levels will show up.
❓Target Profit indicator based on price actions
When this option is enabled, you will see a "💰" which means it's time to take profit or reduce your positions.
❓Target Profit / Stop Loss based on ATR
Most of the trader uses ATR as a stop loss level. When this option is enabled, the indicator for Stop Loss and Take Profit will show up and the TP/SL levels can be changed by changing the ATR Multiplier (Default is 1.8).
❓Alert System
Function alert is added and the user can customize it the way they want it.
Grid Settings & MMThis script is designed to help you plan your grid trading or when averaging your position in the spot market.
The script has a small error (due to the simplification of the code), it does not take into account the size of the commission.
You can set any values on all parameters on any timeframe, except for the number of orders in the grid (from 2 to 5).
The usage algorithm is quite simple:
1. Connect the script
2. Install a Fibo grid on the chart - optional (settings at the bottom of the description)
3.On the selected pair, determine the HighPrice & LowPrice levels and insert their values
4.Evaluate grid data (levels, estimated profit ’%’, possible profit ‘$’...)
And it's all)
Block of variables for calculating grid and MM parameters
Variables used regularly
--- HighPrice and LowPrice - constant update when changing pairs
--- Deposit - deposit amount - periodically set the actual amount
Variables that do not require permanent changes
--- Grids - set the planned number of grids, default 5
--- Steps - the planned number of orders in the grid, by default 5
--- C_Order - coefficient of increasing the size of orders in the base coin, by default 1.2
--- C_Price - trading levels offset coefficient, default 1.1
--- FirstLevel - location of the first buy level, default 0.5
--- Back_HL - number of candles back, default 150
*** For C_Order and C_Price variables, the value 1 means the same order size and the same distance between buy levels.
The fibo grid is used for visualization, you can do without it, ! it is not tied to the script code !
You can calculate the levels of the Fibo grid using the formula:
(level price - minimum price) / (maximum price - minimum price)
For default values, grid levels are as follows:
1 ... 0.5
2...0.359
3 ... 0.211
4...0.0564
5...-0.1043
Short description:
in the upper right corner
--- indicator of the price movement for the last 150 candles, in % !!! there is no task here to "catch" the peak values - only a relative estimate.
in the upper left corner
--- total amount of the deposit
--- the planned number of grids
--- “cost” of one grid
--- the size of the estimated profit depending on the specified HighPrice & LowPrice
in the lower left corner
--- Buy - price levels for buy orders
--- Amount - the number of purchased coins in the corresponding order
--- Sell - levels of profit taking by the sum of market orders in the grid
--- $$$ - the sum of all orders in the grid, taking into account the last active order
--- TP - profit amount by the amount of orders in the grid
