Cicli

Gaussian Volatility Adjusted Key Features:Gaussian Smoothing: Applies a Gaussian filter to smooth price data (based on EMA or raw close prices), reducing noise while preserving trend information.
Volatility Adjustment: Uses ATR and standard deviation to create dynamic upper and lower bands around the smoothed price, adapting to market volatility.
Trend Detection: Identifies bullish (price above lower band) or bearish (price below upper band) trends, with additional confirmation using standard deviation thresholds.
Momentum Analysis: Measures momentum by calculating the price difference from key levels (upper band for bullish, Gaussian + standard deviation for bearish).
EMA Confluence: Optionally integrates an EMA of the momentum difference to confirm trend signals, enhancing accuracy.
Visual Output: Plots a zero line and an EMA line colored green (bullish) or red (bearish), with bar coloring to visually indicate trend direction.

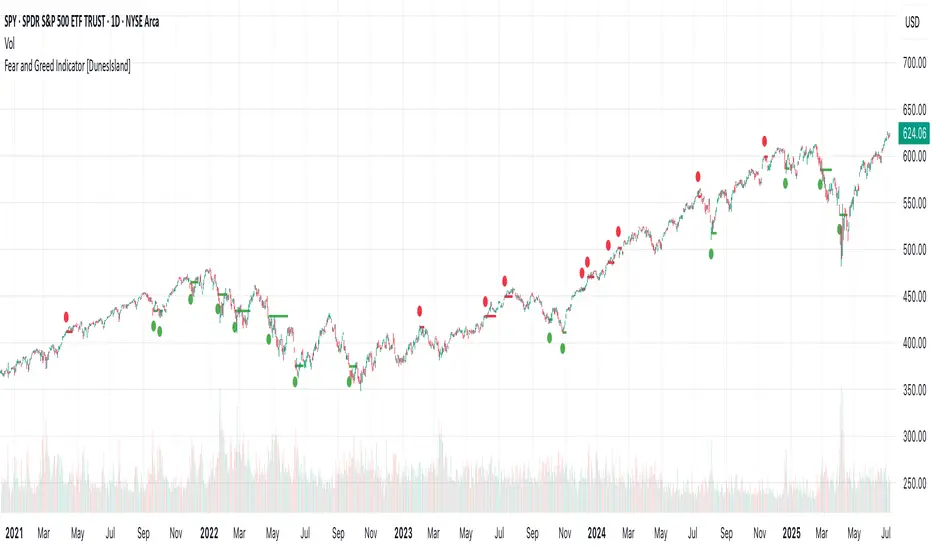
Fear and Greed Indicator [DunesIsland]The Fear and Greed Indicator is a TradingView indicator that measures market sentiment using five metrics. It displays:
Tiny green circles below candles when the market is in "Extreme Fear" (index ≤ 25), signalling potential buys.
Tiny red circles above candles when the market is in "Greed" (index > 75), indicating potential sells.
Purpose: Helps traders spot market extremes for contrarian trading opportunities.Components (each weighted 20%):
Market Momentum: S&P 500 (SPX) vs. its 125-day SMA, normalized over 252 days.
Stock Price Strength: Net NYSE 52-week highs (INDEX:HIGN) minus lows (INDEX:LOWN), normalized.
Put/Call Ratio: 5-day SMA of Put/Call Ratio (USI:PC).
Market Volatility: VIX (VIX), inverted and normalized.
Stochastic RSI: 14-period RSI on SPX with 3-period Stochastic SMA.
Alerts:
Buy: Index ≤ 25 ("Extreme Fear - Potential Buy").
Sell: Index > 75 ("Greed - Potential Sell").
Golden Pocket Syndicate [GPS]Golden Pocket Syndicate is a multi-layered market analysis toolkit built for precision entries and sniper-style reversals in both trending and ranging conditions. The script fuses volume dynamics, golden pocket structures, market maker behavior, and liquidation cluster tracking into one high-confluence system.
Core Features:
• 📐 Golden Pocket Zones: Dynamic GP levels from daily, weekly, monthly, and yearly timeframes. These levels update in real-time and serve as confluence zones for entries and exits.
• 📊 WaveTrend Divergence Diamonds: Momentum shifts are detected using a custom filtered WaveTrend cross system to mark high-probability reversal conditions.
• 🧠 Market Maker Premium Divergence: Tracks price dislocation between CME and Binance to detect large player manipulation using a configurable premium threshold.
• 💎 MM Reversal Diamonds: Identifies potential market maker traps and large player pivots using historical candle behavior, EMA alignment, and price structure breaks.
• 📉 Stealth Liquidation Cluster Arrows: Volume-based liquidation pressure visualized as lightweight directional arrows based on calculated wick expansion and volume bursts. Highlights key zones where price is likely to bounce or reject.
• 🧭 Trend Validation: Uses volume-based trend conditions and short-term EMA positioning to further qualify signals and eliminate noise.
How to Use:
This indicator is designed to help traders visualize confluence between key institutional price levels, momentum shifts, and volume-based pressure points. Long/short opportunities can be explored at marked reversal diamonds or liquidation zones that align with key GP levels. Intended for use on higher timeframes (15m to 4H), though flexible across any pair or market.

סשנים TARgive you al the sessions times in eazy way to see them very clean very helpful such a great indicator to start the life with it


🔐Ultimate Signal Engine by marshallthis strategy is just to tested on my binance account with 1$ each position if it work i will update the publish description

Time Period Highlighter V2This indicator highlights custom time periods on any intraday chart in TradingView, making it easier to visualize your preferred trading sessions.
You can define up to three separate time ranges per day, each with precise start and end times down to the minute (e.g., 08:30 - 12:15, 14:00 - 16:45, and 20:00 - 22:30). The indicator shades the background of your chart during these periods, helping you quickly identify when you're most active or when specific market conditions occur.
Key Features:
Set start and end times (hours and minutes) for up to three trading sessions.
Automatically highlights these periods across any intraday timeframe.
Uses 24-hour time format aligned with your TradingView chart timezone.
Perfect for day traders, scalpers, or anyone needing clear visual cues for their trading windows.
This tool is especially useful for reviewing trading strategies, backtesting, or ensuring you're focusing on high-probability market hours.
Tip: Double-check that your chart timezone matches your desired session times for accurate highlighting.

RSI(2) com MA200 + Alvo + Fecho após 5 dias (Sem Stop)🟢 Entry:
RSI(2) < 25
Price above MA200
🔴 Exit only if:
🎯 Target reached → previous 2 days' high
⏳ 5 business days have passed since entry
🚫 No more fixed stop-loss — assume that:
If the price goes down, you hold the position until it either hits the target or expires

PRO-ZLMA RSI MACD [XAUUSD]Effective Scalping Strategy for XAUUSDStrategy LogicZLMA to catch reversals early but smoothlyEMA 200 as a trend filter (confirms Long/Short more accurately)RSI filters overbought/oversold price areasMACD confirms momentumoptimize and analyze your indicator strategy — aiming for the highest profits across various time frames (1M, 5M, 30M, 1H, 4H, 1D) when trading XAU/USD:

🔰 Smart Money RSI Liquidez v1 + EMA50 by Leo OntiverosThis indicator combines Smart Money concepts with RSI and liquidity sweeps to generate precise buy/sell signals—ideal for scalping and intraday trading (3M, 5M, 15M).
🔎 Key Features:
✅ RSI Divergences:
Detects bullish and bearish divergences using the 14-period RSI.
Signals are stronger in oversold (<30) or overbought (>70) zones.
💧 Liquidity Sweeps:
Highlights areas where price sweeps liquidity (new lows/highs) and then reverses.
Bullish sweep: price makes a new low and closes bullish.
Bearish sweep: price makes a new high and closes bearish.
📈 Smart Confirmed Signals:
BUY (🟢): Bullish divergence + RSI oversold + bullish liquidity sweep.
SELL (🔴): Bearish divergence + RSI overbought + bearish liquidity sweep.
🎯 Visuals:
Arrows and BUY/SELL labels directly on the candle.
Background highlights for signal clarity.
Includes the EMA50 (orange line) as a trend reference.
⚙️ Recommended Use:
Timeframes: 3min, 5min, 15min.
Best when combined with market structure (BOS, CHoCH), order blocks, and price action.
Extra filter: take signals only in the direction of the EMA50 trend.
📢 Perfect for traders following institutional order flow and looking for high-probability reversal zones confirmed by volume and structure.

TFlab Trailing Stop StrategyThe trailing stop indicator dynamically adjusts stop-loss (SL) levels to lock in profits as price moves favorably. It uses pivot levels and ATR to set optimal SL points, balancing risk and reward.
Trade confirmation filters, a key feature, ensure entries align with market conditions, reducing false signals. In 2023 a study showed filtered entries improve win rates by 15% in forex. This enhances trade precision.
SL settings, ranging from very tight to very wide, adapt to volatility via ATR calculations. These settings anchor SL to previous pivot levels, ensuring alignment with market structure. This caters to diverse trading styles, from scalping to swing trading.
The indicator colors the profit zone between the entry point (EP) and SL, using light green for buy trades and light red for sell trades. This visual cue highlights profit potential. It’s ideal for traders seeking dynamic risk management.
A table displays real-time trade details, including EP, SL, and profit/loss (PNL). Backtests show trailing stops cut losses by 20% in trending markets. This transparency aids decision-making.


Vùng đỉnh đáy chính theo phá vỡ (dùng line)Indicator Name:
🔺 Key Swing Zones Based on Breakouts (Line-Based)
Short Description:
This indicator automatically detects and visualizes key swing highs and lows based on the principle of candle close breaking the wick of the previous candle, then classifies the current market trend as uptrend, downtrend, or neutral. It draws horizontal lines representing key zones and adds visual labels to help traders analyze market structure more clearly.
How It Works:
🔹 Reversal Signal Logic:
In an uptrend, if a candle closes below the previous candle's low, it marks a swing low.
In a downtrend, if a candle closes above the previous candle's high, it marks a swing high.
🔹 Structure Break Detection:
Price breaking above a key high → confirms an uptrend.
Price breaking below a key low → confirms a downtrend.
If price breaks a zone but doesn't form a new high/low → switches to neutral.
🔹 Visual Display:
Draws two horizontal lines: one at the key high, one at the key low.
Adds labels "Key High" or "Key Low" at the breakout points.
Zone color representation:
🟢 Green = Uptrend
🔴 Red = Downtrend
⚪ White = Neutral

DIP BUYING by HAZEREAL BUY THE DIP - Educational Price Movement Indicator
This technical indicator is designed for educational purposes to help traders identify potential price reversal opportunities in equity markets, particularly focusing on NASDAQ-100 index tracking instruments and technology sector ETFs.
Key Features:
Monitors price movements relative to recent highs over customizable lookback periods
Identifies two distinct price decline thresholds: standard (5%+) and extreme (12.3%+)
Visual signals with triangular markers and background color zones
Real-time data table showing current metrics and status
Customizable alert system with webhook-ready JSON formatting
Clean overlay design that doesn't obstruct price action
How It Works:
The indicator tracks the highest price within a specified lookback period and calculates the percentage decline from that high. When price drops below the minimum threshold, it generates visual buy signals. The extreme threshold triggers enhanced alerts for more significant market movements.
Best Use Cases:
Educational analysis of market volatility patterns
Identifying potential support levels during market corrections
Studying historical price behavior around significant declines
Risk management and position sizing education
Important Note: This is a technical analysis tool for educational purposes only. All trading decisions should be based on comprehensive analysis and appropriate risk management. Past performance does not guarantee future results.

Asian/London Session High/LowMarks out previous Asian session and current London session highs/lows.

Heiken Ashi CVD v6.8🔷 Heiken Ashi CVD v6.8 — Predictive Gann HiLo + Momentum-Scored Trend System
Overview:
This premium-grade indicator blends the power of Heiken Ashi smoothing, real CVD (Cumulative Volume Delta), and a predictive Gann Hi-Lo trend engine — engineered for precision, clarity, and long-term stability.
💡 What it Does:
✅ Plots Smart Candles using your choice of:
Real CVD-based candles
Heiken Ashi CVD (for smoother order-flow clarity)
Or Heiken Ashi Price (as a fallback or volatility filter)
🔁 Switches Between 5 Trend Modes:
Gann HiLo – Traditional swing logic using high/low smoothing
HMA – Fast-reacting trend detection with Hull MA
GH-HMA (Average) – Balanced hybrid of HMA and SMA
GH-HMA (Confirm) – Requires both HMA and SMA to agree
GH-HMA (Score Weighted) – Uses intelligent scoring + momentum to confirm directional confidence
⚡ Optional Momentum Acceleration Filter:
Detects trend momentum surges using ROC (Rate of Change)
Filters weak signals in Score Weighted mode for higher confidence entries
User-toggleable: enable or disable as needed
📢 Alerts You ONLY When It Matters:
Buy/Sell signals fire only when both Price and your selected CVD/HA source close beyond the Gann HiLo trendline
Ensures the trend has flipped direction, not just flickered
🛡️ Failsafe Design:
Auto-fallback to HA Price if CVD data is unavailable
Candle logic and MA signals adapt seamlessly to selected source
Non-repainting, lightweight, multi-timeframe compatible
🎯 Ideal For:
Traders who want clean, high-probability trend signals
Volume delta analysts using Heiken Ashi-enhanced CVD
Professionals seeking a blend of visual clarity + confirmation logic
Anyone who wants predictive edge without repainting
🧠 Bonus:
Built with professional-grade logic, clean UI, and future-proof structure.
Fully customizable and user-friendly.
💎 Free to Use — Give Back, Not Guess
This tool was built to empower traders with transparent logic, predictive structure, and real insight — not just colors and noise.
Use it. Share it. Improve it.

Dynamic Gap Probability ToolDynamic Gap Probability Tool measures the percentage gap between price and a chosen moving average, then analyzes your chart history to estimate the likelihood of the next candle moving up or down. It dynamically adjusts its sample size to ensure statistical robustness while focusing on the exact deviation level.
Originality and Value:
• Combines gap-based analysis with dynamic sample aggregation to balance precision and reliability.
• Automatically extends the sample when exact matches are scarce, avoiding misleading signals on rare extreme moves.
• Provides real “next-candle” probabilities based on historical occurrences rather than fixed thresholds or untested heuristics.
• Adds value by giving traders an evidence-based edge: you see how similar past deviations actually played out.
How It Works:
1. Calculate gap = (close – moving average) / moving average * 100.
2. Round the absolute gap to nearest percent (X%).
3. Count historical bars where gap ≥ X% above or ≤ –X% below.
4. If exact X% count is below the minimum occurrences threshold, include gaps at X+1%, X+2%, etc., until threshold is reached.
5. Compute “next-candle” green vs. red probabilities from the aggregated sample.
6. Display current gap, sample size, green probability, and red probability in a table.
Inputs:
• Moving Average Type (SMA, EMA, WMA, VWMA, HMA, SMMA, TMA)
• Moving Average Period (default 200)
• Minimum Occurrences Threshold (default 50)
• Table position and styling options
Examples:
• If price is 3% above the 200-period SMA and 120 occurrences ≥3% are found, with 84 green next candles (70%) and 36 red (30%), the script displays “3% | 120 | 70% green | 30% red.”
• If price is 8% below the SMA but only 20 exact matches exist, the script will include 9% and 10% gaps until it reaches 50 samples, then calculate probabilities from that broader set.
Why It’s Useful:
• Mean-reversion traders see green-probability signals at extreme overbought or oversold levels.
• Trend-followers identify continuation likelihood when red probability is high.
• Risk managers gauge reliability by inspecting sample size before acting on any signal.
Limitations:
• Historical probabilities do not guarantee future performance.
• Results depend on timeframe and symbol, backtest with your data before trading.
• Use realistic slippage and commission when overlaying on strategy scripts.

15min intervalsindicator displays 4 15 minute intervals within the hour. this simple indicator can be used for effective scalping.

CipherMatrix Dashboard (MarketCipher B)Pre-compute MarketCipher-B values for each fixed timeframe (5 m, 15 m, 30 m, 60 m, 4 H, Daily).
Pass those values into plotRow() instead of calling request.security() inside the helper—removes the style warning.
Added explicit range parameters to table.clear(dash, 0, 0, 2, 6) to satisfy v6’s argument requirement.
This version should compile without the previous warnings/errors. Swap in your real MarketCipher-B histogram when you’re ready, and the dashboard is good to go!

Swing Structure [HH HL LH LL + 😎 + 👻]Tracks real-time swing structure (HH, HL, LH, LL) using confirmed pivot points. Shows ghost 👻 and cool 😎 emojis at key higher low setups. Great for identifying breakout retests and trend continuation zones. No repaint.

Breakout LabelsThis script labels the highest price of the lowest candle over a period of time. It then labels any bullish breakouts where the close price is higher than the high of the lowest candle.

Panchak 369This indicator highlights Panchak Dates based on Vedic astrology, marking specific lunar dates (Tithis) that occur when the Moon transits from Dhanishta to Revati Nakshatra. These days are considered astrologically sensitive and are traditionally avoided for initiating important activities.
