AZ Dynamic Trend Indicator with Heikin-Ashi### Dynamic Trend Indicator with Heikin-Ashi (v2.7)
**Effortlessly identify trends and reversals** with this versatile tool combining multi-timeframe analysis, adaptive moving averages, and Heikin-Ashi smoothing. Here's what it offers:
#### 🔍 **Core Features**
1. **Dual Timeframe Analysis**:
- Track trends on higher timeframes (e.g., 1H/D) while viewing signals on your current chart.
- Toggle between **Heikin-Ashi** or standard candles for cleaner trend visualization.
2. **8 Customizable MAs**:
- Choose from **ALMA, HMA, SMA, SWMA, VWMA, WMA, ZLEMA, or EMA** with adjustable periods.
- Unique "Trend Strength" metric: `(MA_Close - MA_Open) / (MA_High - MA_Low)` highlights momentum direction.
3. **Smart Signals**:
- **Entry/Exit**: Triangles mark crossovers between MA Close/Open.
- **Reversal Alerts**: Detects counter-trend moves within a user-defined window (default: 3 bars) after signals.
- Color-coded plots: Bullish (🟢), Bearish (🔴), Reversal Bull (🔵), Reversal Bear (🟠).
#### 🎨 **Visual Customization**
- Toggle **High/Low MA lines**, **Close line**, and **fill colors**.
- Adjust colors for all elements to match your chart theme.
- Hide signals or reversal markers as needed.
#### ⚙️ **Practical Use**
- **Trend Following**: Use the MA Close/Open crossover with trend fill colors to confirm direction.
- **Reversal Trading**: Capitalize on pullbacks with reversal signals (e.g., after a bearish signal, watch for Bull Reversal markers).
- **Multi-Timeframe Confirmation**: Avoid false signals by aligning higher-timeframe trends with your entries.
*Ideal for swing traders and trend riders!*
**Note**: Adjust `MA Period`, `Reversal Window`, and `Trend Timeframe` for your strategy. Disable Heikin-Ashi in choppy markets for faster reactions.
---
*Code v2.7 updates: Optimized reversal logic, added ALMA/ZLEMA support, and enhanced visual controls.*
Cicli

محدد الأوقات المطور جداً v6
Determine the candle times at any hour you want. If the strategy you are working on is CRT, specify the 4-hour frame and choose the time 1-5-9.

BTC Correlation CoefficientThe BTCUSDT Correlation Coefficient indicator measures the strength and direction of the relationship between the selected asset (e.g., a stock or altcoin) and the price of BTCUSDT over a chosen time period. It uses a custom correlation function to calculate how closely the asset's price movements align with Bitcoin, returning a value between -1 and +1. A coefficient near +1 indicates strong positive correlation, while values near -1 indicate inverse correlation. This helps traders assess whether the asset tends to follow Bitcoin’s price trends or behave independently, enabling more informed decisions on portfolio diversification and market sentiment alignment.


EMA 200 & EMA 20EMA20\200 Golden & Death cross
you can use it for all time frame trading in market
it make more easy way to find the way for market if its going up or down


Alt Market Index (Halving-Adjusted BTC Supply, EMA)
암호화폐 알트코인 시총 상위 125개를 모아서
나스닥 기반의 계산식을 활용한 알트코인지수125를 만들었습니다.
반감기에 따른 비트코인 하루 채굴량 갯수 추가까지 포함한 버전입니다.
일봉이 기준이 됩니다.
I created the Altcoin Index 125 by compiling the top 125 altcoins by market capitalization in the cryptocurrency market, using a calculation method based on the Nasdaq index.
This version also includes adjustments for Bitcoin’s halving events, reflecting changes in daily mining output. The index is based on daily candles.

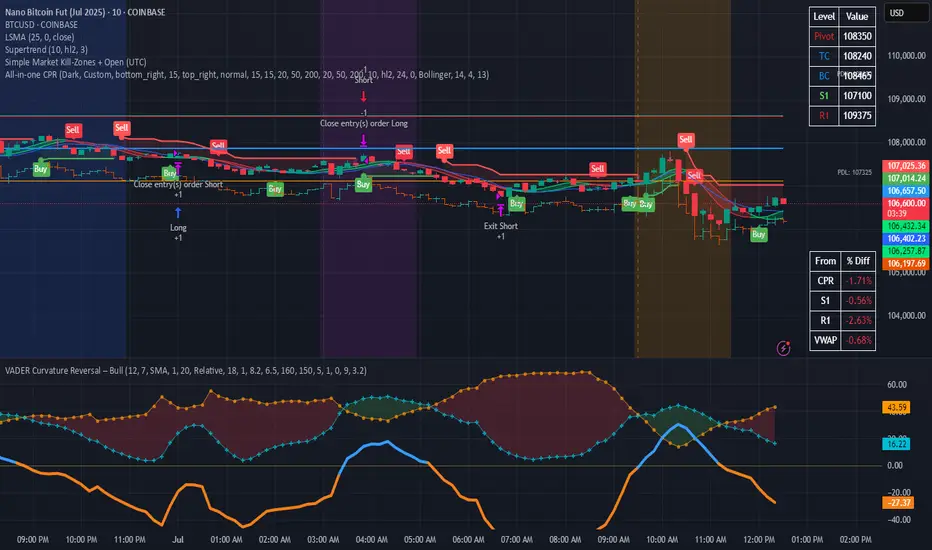
Simple Market Kill-Zones + Open (UTC)What it does
This Pine v6 indicator highlights the “kill-zones” around the big session opens—Asian (23:00–03:00 UTC), London (07:00–09:00 UTC) and New York (13:30–15:30 UTC)—by reading each bar’s actual UTC timestamp. It also draws dashed vertical lines at exactly 23:00, 07:00 and 13:30 UTC, so you never miss the liquidity ramps. Because it uses raw UTC hours/minutes, it stays accurate even when exchanges pause (e.g. Nano-BTC’s daily halt) or your chart’s display timezone changes.
Key Inputs
Show Asia/London/NY Kill Zone – toggle each shaded band on/off
Zone Colors – pick your own semi-transparent hues
Show Session-Open Lines – enable dashed verticals at the exact open times
Line Colors – customize the line opacity and style
How to use
Apply on your favorite timeframe (15 min–1 h is a sweet spot).
Toggle the zones you care about and pick readable colors.
Use the dashed lines as entry triggers or as visual bookmarks.
In your own Pine strategies, wrap order logic with the zone booleans to only trade when liquidity’s alive.
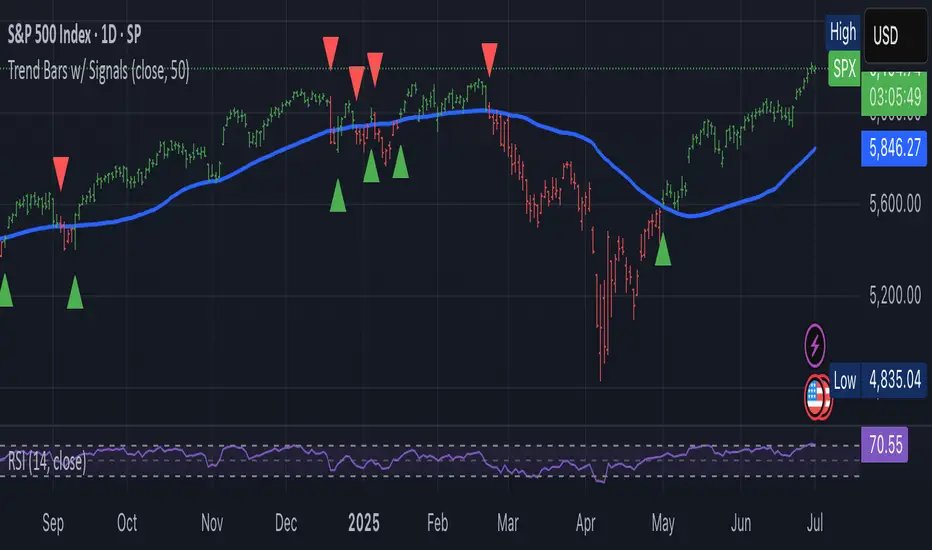
Trend-Following Colored Bars w/ SignalsTheTechnicalTraders trendfollowing
Easy way to follow the trend.
Price Reaction Analysis by Day of WeekOverview
The "Price Reaction Analysis by Day of Week" indicator is a tool that enables traders to analyze historical price reaction patterns to technical indicator signals on a selected day of the week. It examines price behavior on a chosen candle (from 1 to 30) in the next day or subsequent days after a signal, depending on the timeframe, and provides success rate statistics to support data-driven trading decisions. The indicator is optimized for timeframes up to 1 day (e.g., 1D, 12H, 8H, 6H, 4H, 1H, 15M), as the analysis relies on day-of-week comparisons. Lower timeframes generate more signals due to the higher number of candles per day.
Key Features
1. Flexible Technical Indicator Selection
Users can choose one of four technical indicators: RSI, SMI, MA, or Bollinger Bands. Each indicator has configurable parameters, such as:
RSI length, oversold/overbought levels.
SMI length, %K and %D smoothing, signal levels.
MA length.
Bollinger Bands length and multiplier.
2. Day-of-Week Analysis
The indicator allows users to select a day of the week (Monday, Tuesday, Wednesday, Thursday, Friday) for generating signals. It analyzes price reactions on a selected candle (from 1 to 30) in the next day or subsequent days after the signal. Examples:
On a daily timeframe, a signal on Monday can be analyzed for the first, fourth, or later candle (up to 30) in subsequent days (e.g., Tuesday, Wednesday).
On timeframes lower than 1 day (e.g., 12H, 8H, 6H, 4H, 1H, 15M), the analysis targets the selected candle in the next day or subsequent days. For example, on a 4H timeframe, you can analyze the second Tuesday candle following a Monday signal. The maximum timeframe is 1 day to ensure consistent day-of-week analysis.
3. Visual Signals
Signals for the analysis period are marked with background highlights in real-time when the indicator’s conditions are met. The last highlighted candle of the selected day is always analyzed. Arrows are displayed on the chart at the candle specified by the “Candles to Compare” setting (e.g., the first candle if set to 1):
Green upward triangles (below the candle) for successful buy signals (the closing price of the selected candle is higher than the signal candle’s close).
Red downward triangles (above the candle) for successful sell signals (the closing price of the selected candle is lower than the signal candle’s close).
Gray “x” marks for unsuccessful signals (no price reversal in the expected direction). Arrow positions are intuitive: buy signals below the candle, sell signals above. Highlights and arrows do not require waiting for future signals but are essential for calculating statistics.
Note: The first candle of the next day may appear shifted on the chart due to timezone differences, which can affect the timing of signal appearance.
4. Signal Conditions (Highlights) for Each Indicator
RSI: The oscillator is in oversold (buy) or overbought (sell) zones.
SMI: SMI returns from oversold (buy) or overbought (sell) zones.
MA: Price crosses the MA (upward for buy, downward for sell).
Bollinger Bands: Price returns inside the bands (from below for buy, from above for sell).
5. Success Rate Statistics
A table in the top-right corner of the chart displays:
The number of buy and sell signals for the selected day of the week.
The percentage of cases where the price of the selected candle in the next day or subsequent days reversed as expected (e.g., rising after a buy signal). Statistics are based on comparing the closing price of the signal candle with the closing price of the selected candle (e.g., first, fourth) in the next day or subsequent days.
Important: Statistics do not account for price movements within the candle or after its close. The price on the selected candle (e.g., fourth) may be lower than earlier candles but still higher than the signal candle, counting as a positive buy signal, though it does not guarantee profit.
6. Date Range
Users can specify the analysis date range, enabling strategy testing on historical data from a chosen period. Ensure the start and end dates are set correctly.
Applications
The indicator is designed for traders who want to leverage historical patterns for position planning. Examples:
On a 4-hour timeframe: If a sell signal highlight appears on Monday and statistics show an 80% chance that the fourth Tuesday candle is bearish, traders may consider playing a correction at the open of that candle.
On a daily timeframe: If a highlight indicates market overheating, traders may consider entering a position at the open of the first candle after the signal (e.g., Tuesday), provided statistics suggest an edge. Users can analyze the signal on the first candle and check later candles to validate results, increasing confidence in consistent patterns.
Key Settings
Indicator Type: Choose between RSI, SMI, MA, or Bollinger Bands.
Selected Day: Monday, Tuesday, Wednesday, Thursday, or Friday.
Candles to Compare: The number of the candle in the next day or subsequent days (from 1 to 30).
Indicator Parameters: Lengths, levels (e.g., oversold/overbought for RSI).
Background Colors: Configurable highlights for buy and sell signals.
Notes
Timeframes: The indicator is optimized for timeframes up to 1 day (e.g., 1D, 12H, 8H, 6H, 4H, 1H, 15M), as the analysis relies on day-of-week patterns. Timeframes lower than 1 day generate more signals due to the higher number of candles per day.
Candle Shift: The first candle of the next day may appear shifted on the chart due to timezone differences, affecting the timing of signals across markets or platforms.
Statistical Limitations: Results are based on the closing prices of the selected candle, ignoring fluctuations in earlier candles, within the candle, or subsequent price movements. Traders must assess whether entering at the open or after the close of the selected candle is profitable.
Testing: Effectiveness depends on historical data and parameter settings. Testing different configurations across markets and timeframes is recommended.
Who Is It For?
Swing and position traders who base decisions on technical analysis and historical patterns.
Market analysts seeking patterns in price behavior by day of the week.
TradingView users of all experience levels, thanks to an intuitive interface and flexible settings.

Aetherium Institutional Market Resonance EngineAetherium Institutional Market Resonance Engine (AIMRE)
A Three-Pillar Framework for Decoding Institutional Activity
🎓 THEORETICAL FOUNDATION
The Aetherium Institutional Market Resonance Engine (AIMRE) is a multi-faceted analysis system designed to move beyond conventional indicators and decode the market's underlying structure as dictated by institutional capital flow. Its philosophy is built on a singular premise: significant market moves are preceded by a convergence of context , location , and timing . Aetherium quantifies these three dimensions through a revolutionary three-pillar architecture.
This system is not a simple combination of indicators; it is an integrated engine where each pillar's analysis feeds into a central logic core. A signal is only generated when all three pillars achieve a state of resonance, indicating a high-probability alignment between market organization, key liquidity levels, and cyclical momentum.
⚡ THE THREE-PILLAR ARCHITECTURE
1. 🌌 PILLAR I: THE COHERENCE ENGINE (THE 'CONTEXT')
Purpose: To measure the degree of organization within the market. This pillar answers the question: " Is the market acting with a unified purpose, or is it chaotic and random? "
Conceptual Framework: Institutional campaigns (accumulation or distribution) create a non-random, organized market environment. Retail-driven or directionless markets are characterized by "noise" and chaos. The Coherence Engine acts as a filter to ensure we only engage when institutional players are actively steering the market.
Formulaic Concept:
Coherence = f(Dominance, Synchronization)
Dominance Factor: Calculates the absolute difference between smoothed buying pressure (volume-weighted bullish candles) and smoothed selling pressure (volume-weighted bearish candles), normalized by total pressure. A high value signifies a clear winner between buyers and sellers.
Synchronization Factor: Measures the correlation between the streams of buying and selling pressure over the analysis window. A high positive correlation indicates synchronized, directional activity, while a negative correlation suggests choppy, conflicting action.
The final Coherence score (0-100) represents the percentage of market organization. A high score is a prerequisite for any signal, filtering out unpredictable market conditions.
2. 💎 PILLAR II: HARMONIC LIQUIDITY MATRIX (THE 'LOCATION')
Purpose: To identify and map high-impact institutional footprints. This pillar answers the question: " Where have institutions previously committed significant capital? "
Conceptual Framework: Large institutional orders leave indelible marks on the market in the form of anomalous volume spikes at specific price levels. These are not random occurrences but are areas of intense historical interest. The Harmonic Liquidity Matrix finds these footprints and consolidates them into actionable support and resistance zones called "Harmonic Nodes."
Algorithmic Process:
Footprint Identification: The engine scans the historical lookback period for candles where volume > average_volume * Institutional_Volume_Filter. This identifies statistically significant volume events.
Node Creation: A raw node is created at the mean price of the identified candle.
Dynamic Clustering: The engine uses an ATR-based proximity algorithm. If a new footprint is identified within Node_Clustering_Distance (ATR) of an existing Harmonic Node, it is merged. The node's price is volume-weighted, and its magnitude is increased. This prevents chart clutter and consolidates nearby institutional orders into a single, more significant level.
Node Decay: Nodes that are older than the Institutional_Liquidity_Scanback period are automatically removed from the chart, ensuring the analysis remains relevant to recent market dynamics.
3. 🌊 PILLAR III: CYCLICAL RESONANCE MATRIX (THE 'TIMING')
Purpose: To identify the market's dominant rhythm and its current phase. This pillar answers the question: " Is the market's immediate energy flowing up or down? "
Conceptual Framework: Markets move in waves and cycles of varying lengths. Trading in harmony with the current cyclical phase dramatically increases the probability of success. Aetherium employs a simplified wavelet analysis concept to decompose price action into short, medium, and long-term cycles.
Algorithmic Process:
Cycle Decomposition: The engine calculates three oscillators based on the difference between pairs of Exponential Moving Averages (e.g., EMA8-EMA13 for short cycle, EMA21-EMA34 for medium cycle).
Energy Measurement: The 'energy' of each cycle is determined by its recent volatility (standard deviation). The cycle with the highest energy is designated as the "Dominant Cycle."
Phase Analysis: The engine determines if the dominant cycles are in a bullish phase (rising from a trough) or a bearish phase (falling from a peak).
Cycle Sync: The highest conviction timing signals occur when multiple cycles (e.g., short and medium) are synchronized in the same direction, indicating broad-based momentum.
🔧 COMPREHENSIVE INPUT SYSTEM
Pillar I: Market Coherence Engine
Coherence Analysis Window (10-50, Default: 21): The lookback period for the Coherence Engine.
Lower Values (10-15): Highly responsive to rapid shifts in market control. Ideal for scalping but can be sensitive to noise.
Balanced (20-30): Excellent for day trading, capturing the ebb and flow of institutional sessions.
Higher Values (35-50): Smoother, more stable reading. Best for swing trading and identifying long-term institutional campaigns.
Coherence Activation Level (50-90%, Default: 70%): The minimum market organization required to enable signal generation.
Strict (80-90%): Only allows signals in extremely clear, powerful trends. Fewer, but potentially higher quality signals.
Standard (65-75%): A robust filter that effectively removes choppy conditions while capturing most valid institutional moves.
Lenient (50-60%): Allows signals in less-organized markets. Can be useful in ranging markets but may increase false signals.
Pillar II: Harmonic Liquidity Matrix
Institutional Liquidity Scanback (100-400, Default: 200): How far back the engine looks for institutional footprints.
Short (100-150): Focuses on recent institutional activity, providing highly relevant, immediate levels.
Long (300-400): Identifies major, long-term structural levels. These nodes are often extremely powerful but may be less frequent.
Institutional Volume Filter (1.3-3.0, Default: 1.8): The multiplier for detecting a volume spike.
High (2.5-3.0): Only registers climactic, undeniable institutional volume. Fewer, but more significant nodes.
Low (1.3-1.7): More sensitive, identifying smaller but still relevant institutional interest.
Node Clustering Distance (0.2-0.8 ATR, Default: 0.4): The ATR-based distance for merging nearby nodes.
High (0.6-0.8): Creates wider, more consolidated zones of liquidity.
Low (0.2-0.3): Creates more numerous, precise, and distinct levels.
Pillar III: Cyclical Resonance Matrix
Cycle Resonance Analysis (30-100, Default: 50): The lookback for determining cycle energy and dominance.
Short (30-40): Tunes the engine to faster, shorter-term market rhythms. Best for scalping.
Long (70-100): Aligns the timing component with the larger primary trend. Best for swing trading.
Institutional Signal Architecture
Signal Quality Mode (Professional, Elite, Supreme): Controls the strictness of the three-pillar confluence.
Professional: Loosest setting. May generate signals if two of the three pillars are in strong alignment. Increases signal frequency.
Elite: Balanced setting. Requires a clear, unambiguous resonance of all three pillars. The recommended default.
Supreme: Most stringent. Requires perfect alignment of all three pillars, with each pillar exhibiting exceptionally strong readings (e.g., coherence > 85%). The highest conviction signals.
Signal Spacing Control (5-25, Default: 10): The minimum bars between signals to prevent clutter and redundant alerts.
🎨 ADVANCED VISUAL SYSTEM
The visual architecture of Aetherium is designed not merely for aesthetics, but to provide an intuitive, at-a-glance understanding of the complex data being processed.
Harmonic Liquidity Nodes: The core visual element. Displayed as multi-layered, semi-transparent horizontal boxes.
Magnitude Visualization: The height and opacity of a node's "glow" are proportional to its volume magnitude. More significant nodes appear brighter and larger, instantly drawing the eye to key levels.
Color Coding: Standard nodes are blue/purple, while exceptionally high-magnitude nodes are highlighted in an accent color to denote critical importance.
🌌 Quantum Resonance Field: A dynamic background gradient that visualizes the overall market environment.
Color: Shifts from cool blues/purples (low coherence) to energetic greens/cyans (high coherence and organization), providing instant context.
Intensity: The brightness and opacity of the field are influenced by total market energy (a composite of coherence, momentum, and volume), making powerful market states visually apparent.
💎 Crystalline Lattice Matrix: A geometric web of lines projected from a central moving average.
Mathematical Basis: Levels are projected using multiples of the Golden Ratio (Phi ≈ 1.618) and the ATR. This visualizes the natural harmonic and fractal structure of the market. It is not arbitrary but is based on mathematical principles of market geometry.
🧠 Synaptic Flow Network: A dynamic particle system visualizing the engine's "thought process."
Node Density & Activation: The number of particles and their brightness/color are tied directly to the Market Coherence score. In high-coherence states, the network becomes a dense, bright, and organized web. In chaotic states, it becomes sparse and dim.
⚡ Institutional Energy Waves: Flowing sine waves that visualize market volatility and rhythm.
Amplitude & Speed: The height and speed of the waves are directly influenced by the ATR and volume, providing a feel for market energy.
📊 INSTITUTIONAL CONTROL MATRIX (DASHBOARD)
The dashboard is the central command console, providing a real-time, quantitative summary of each pillar's status.
Header: Displays the script title and version.
Coherence Engine Section:
State: Displays a qualitative assessment of market organization: ◉ PHASE LOCK (High Coherence), ◎ ORGANIZING (Moderate Coherence), or ○ CHAOTIC (Low Coherence). Color-coded for immediate recognition.
Power: Shows the precise Coherence percentage and a directional arrow (↗ or ↘) indicating if organization is increasing or decreasing.
Liquidity Matrix Section:
Nodes: Displays the total number of active Harmonic Liquidity Nodes currently being tracked.
Target: Shows the price level of the nearest significant Harmonic Node to the current price, representing the most immediate institutional level of interest.
Cycle Matrix Section:
Cycle: Identifies the currently dominant market cycle (e.g., "MID ") based on cycle energy.
Sync: Indicates the alignment of the cyclical forces: ▲ BULLISH , ▼ BEARISH , or ◆ DIVERGENT . This is the core timing confirmation.
Signal Status Section:
A unified status bar that provides the final verdict of the engine. It will display "QUANTUM SCAN" during neutral periods, or announce the tier and direction of an active signal (e.g., "◉ TIER 1 BUY ◉" ), highlighted with the appropriate color.
🎯 SIGNAL GENERATION LOGIC
Aetherium's signal logic is built on the principle of strict, non-negotiable confluence.
Condition 1: Context (Coherence Filter): The Market Coherence must be above the Coherence Activation Level. No signals can be generated in a chaotic market.
Condition 2: Location (Liquidity Node Interaction): Price must be actively interacting with a significant Harmonic Liquidity Node.
For a Buy Signal: Price must be rejecting the Node from below (testing it as support).
For a Sell Signal: Price must be rejecting the Node from above (testing it as resistance).
Condition 3: Timing (Cycle Alignment): The Cyclical Resonance Matrix must confirm that the dominant cycles are synchronized with the intended trade direction.
Signal Tiering: The Signal Quality Mode input determines how strictly these three conditions must be met. 'Supreme' mode, for example, might require not only that the conditions are met, but that the Market Coherence is exceptionally high and the interaction with the Node is accompanied by a significant volume spike.
Signal Spacing: A final filter ensures that signals are spaced by a minimum number of bars, preventing over-alerting in a single move.
🚀 ADVANCED TRADING STRATEGIES
The Primary Confluence Strategy: The intended use of the system. Wait for a Tier 1 (Elite/Supreme) or Tier 2 (Professional/Elite) signal to appear on the chart. This represents the alignment of all three pillars. Enter after the signal bar closes, with a stop-loss placed logically on the other side of the Harmonic Node that triggered the signal.
The Coherence Context Strategy: Use the Coherence Engine as a standalone market filter. When Coherence is high (>70%), favor trend-following strategies. When Coherence is low (<50%), avoid new directional trades or favor range-bound strategies. A sharp drop in Coherence during a trend can be an early warning of a trend's exhaustion.
Node-to-Node Trading: In a high-coherence environment, use the Harmonic Liquidity Nodes as both entry points and profit targets. For example, after a BUY signal is generated at one Node, the next Node above it becomes a logical first profit target.
⚖️ RESPONSIBLE USAGE AND LIMITATIONS
Decision Support, Not a Crystal Ball: Aetherium is an advanced decision-support tool. It is designed to identify high-probability conditions based on a model of institutional behavior. It does not predict the future.
Risk Management is Paramount: No indicator can replace a sound risk management plan. Always use appropriate position sizing and stop-losses. The signals provided are probabilistic, not certainties.
Past Performance Disclaimer: The market models used in this script are based on historical data. While robust, there is no guarantee that these patterns will persist in the future. Market conditions can and do change.
Not a "Set and Forget" System: The indicator performs best when its user understands the concepts behind the three pillars. Use the dashboard and visual cues to build a comprehensive view of the market before acting on a signal.
Backtesting is Essential: Before applying this tool to live trading, it is crucial to backtest and forward-test it on your preferred instruments and timeframes to understand its unique behavior and characteristics.
🔮 CONCLUSION
The Aetherium Institutional Market Resonance Engine represents a paradigm shift from single-variable analysis to a holistic, multi-pillar framework. By quantifying the abstract concepts of market context, location, and timing into a unified, logical system, it provides traders with an unprecedented lens into the mechanics of institutional market operations.
It is not merely an indicator, but a complete analytical engine designed to foster a deeper understanding of market dynamics. By focusing on the core principles of institutional order flow, Aetherium empowers traders to filter out market noise, identify key structural levels, and time their entries in harmony with the market's underlying rhythm.
"In all chaos there is a cosmos, in all disorder a secret order." - Carl Jung
— Dskyz, Trade with insight. Trade with confluence. Trade with Aetherium.

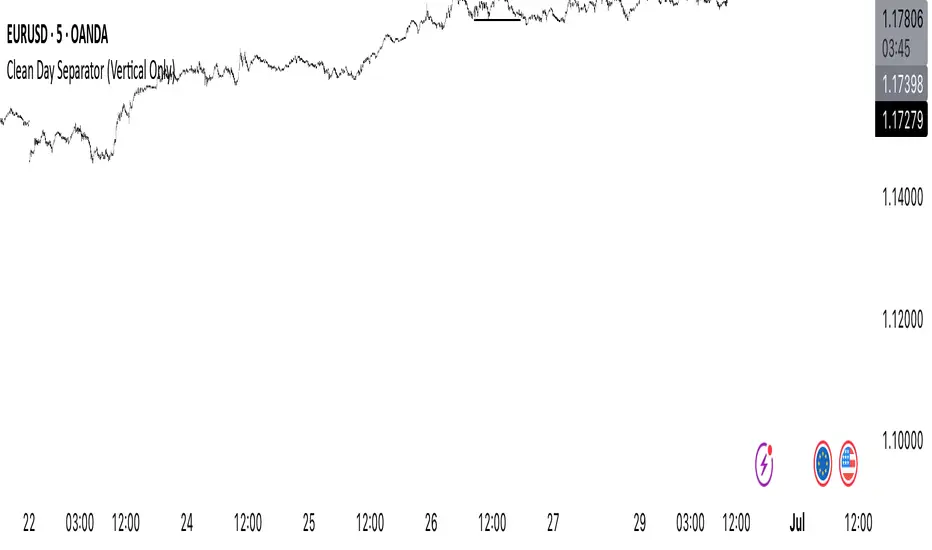
Clean Day Separator (Vertical Only)Clean Day Separator (Vertical Only) is a minimalist indicator for traders who value clarity and structure on their charts.
This tool draws:
✅ Vertical dashed lines at the start of each new day
✅ Optional day-of-week labels (Monday, Tuesday, etc.)
It’s designed specifically for clean chart lovers — no horizontal lines, no boxes, just what you need to mark time and keep your focus.
Perfect for:
Intraday traders who track market rhythm
Price action purists
Anyone who wants to reduce visual noise
Customizable settings:
Toggle day labels on/off
Choose line and text colors
Set label size to match your chart style
Navy Seal Trading - EdgarTrader📌 Navy Seal Trading – Asia, London, and NY Sessions
This indicator clearly displays the ranges of the Asia, London, and New York sessions, featuring:
✅ Full range visualization for each session
✅ Asia session high, low, and midline, with extended projection lines for precise reaction analysis
✅ Clean, minimalistic, and professional colors to keep your chart focused
🔷 Designed for the Navy Seal Trading community, focused on precision, discipline, and professional execution in the markets.
Use it to:
✔️ Mark liquidity zones
✔️ Identify Asia manipulation ranges
✔️ Prepare executions in London and NY with clear context
💡 Remember: Clarity in your zones gives you the confidence and discipline to execute like a true Navy Seal Trader.

Rolling 250-Day Sharpe RatioThis Pine Script indicator, “Rolling 250-Day Sharpe Ratio”, computes the trailing Sharpe Ratio for any traded asset over a 250-session window, equivalent to approximately one trading year. The script first derives daily log returns and adjusts them by subtracting the daily equivalent of the 3-month US Treasury yield to obtain the excess return. It then calculates the rolling mean and standard deviation of these excess returns to produce the annualized Sharpe Ratio, which is displayed as a continuous time series on the chart. This allows traders and analysts to assess how the asset’s risk-adjusted performance evolves over time relative to a risk-free benchmark.
A persistently high Sharpe Ratio can indicate strong risk-adjusted returns, but it is essential to approach extreme values with caution. Elevated Sharpe readings can sometimes reflect unsustainable trends, excessive leverage, or periods of unusually low volatility that may revert abruptly. Conversely, a low or negative Sharpe Ratio does not automatically imply an asset should be avoided; it might signal an opportunity if the risk environment normalizes.

Session Makers v1
Session Makers v1 - Professional Trading Session Visualizer
This advanced indicator highlights key trading sessions and market structure levels, helping traders identify optimal trading times and important price levels.
Key Features:
Session Time Markers
- Vertical dotted lines at major market opens (London/New York)
- Appears 30 minutes before each session for early preparation
Interactive Session Boxes
- Asia Session (22:00-06:00 GMT) - Blue shaded area
- London AM (08:00-09:00 GMT) - Gray shaded area
- London/New York Overlap (14:00-15:00 GMT) - Gray shaded area
Key Reference Levels
- Yesterday's high/low (with touch alerts)
- Previous week's high/low (with touch alerts)
- Asia session high/low/mid lines
Smart Visual Design
- Clean, non-cluttered visuals that adapt to your chart
- Customizable colors and transparency for all elements
- Optimized for all timeframes (M1-H4)
only use in timeframes <= 15 min

Hourly Markers 09:00 - 20:00 Adjusted for UTC+2A line for every hour from 0900 to 2200
Description:
This TradingView Pine Script plots small red markers (downward arrows) at the top of the chart for every full hour between 09:00 AM and 08:00 PM (20:00) based on UTC+2 time. The markers appear precisely at the opening minute of each hour within the defined range, helping traders visually track key time intervals during the day.
Features:
✔ Displays markers from 09:00 to 20:00 local time (UTC+2 adjustment)
✔ Only plots markers at the first minute of each hour
✔ Uses clear, unobtrusive triangle-down symbols above the bars
✔ Works on any chart timeframe that captures hourly intervals
Use Case:
Ideal for traders who want a quick visual reference of hourly intervals during the main trading hours, especially when working with charts set to UTC or different time zones.

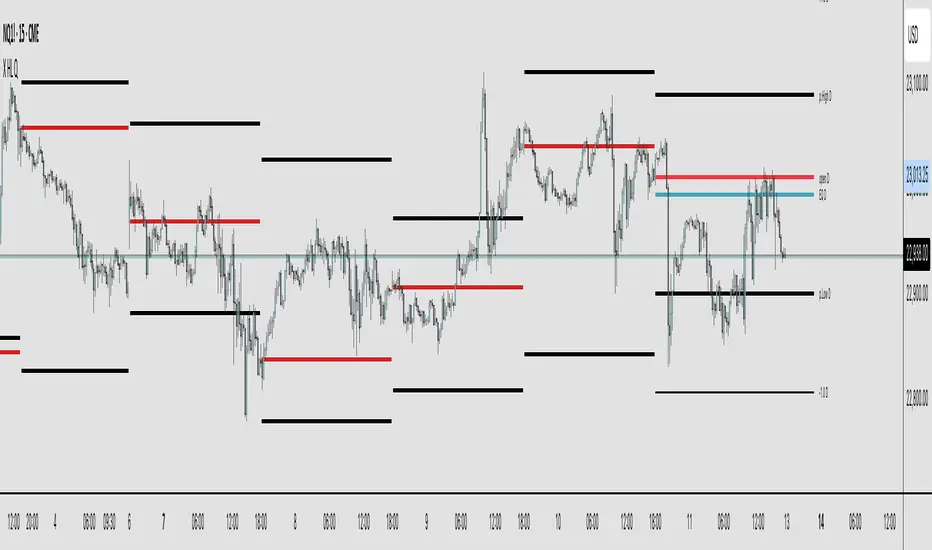
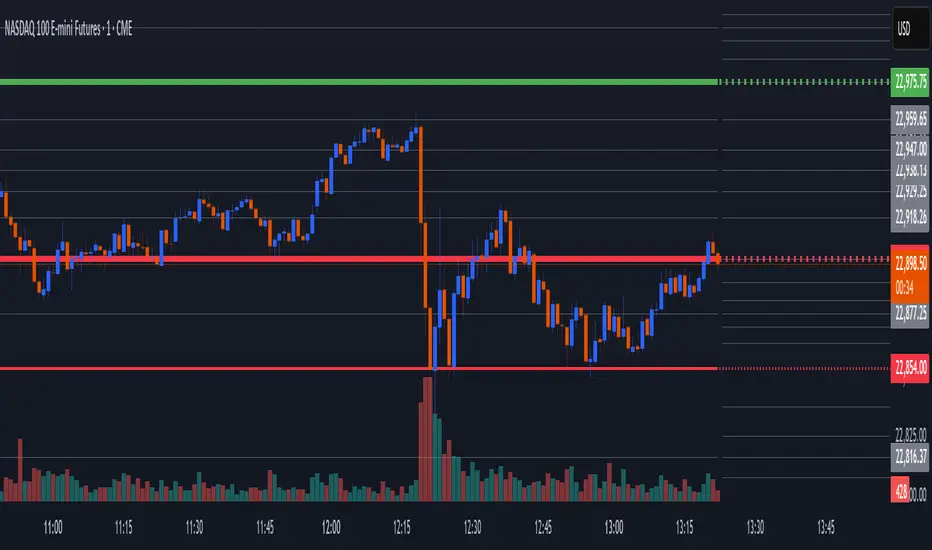
X HL QA market structure tool designed to frame price action within a defined context of prior session dynamics. It accomplishes this by anchoring a set of reference levels to the high, low, and open prices of a user-specified higher timeframe (e.g., 4H, 1D, etc.) and projecting those levels onto the current chart for ongoing analysis.
At its core, the indicator establishes a reference range—derived from the previous completed instance of the selected timeframe—and overlays this on the current timeframe. This range serves as a foundational structure for price interpretation in the current session.
Building upon this framework, the script constructs a set of symmetrical quadrants (or deviation zones) both inside and outside of the prior range. These include:
The midpoint (EQ) of the prior range
Levels at ±0.25x, ±0.75x, ±1.0x, ±1.5x, and ±2.0x the range height
These levels act as contextual zones that traders can use to interpret price behavior—whether it's consolidating within the prior range, approaching fair value (EQ), or expanding into directional continuation or reversal zones beyond the range.
The script operates in both real-time and historical contexts. On live bars, it dynamically updates the key levels to provide an evolving view of current price positioning. Simultaneously, it supports the display of historical levels for past sessions, enabling robust backtesting and comparative analysis of price behavior relative to previous quadrant structures.
Ultimately, this tool serves as a positional map, helping traders assess where price is trading relative to significant levels from the prior session, offering insights into potential support/resistance, overextension, or mean reversion scenarios.
Key Technical Features
Multi-Timeframe Support:
request.security() is used to pull data from a user-defined higher timeframe regardless of the current chart interval.
Visual Flexibility:
Toggle between "line" and "channel" mode.
Line color, width, and visibility are all user-controlled.
Anchoring Options:
Deviation levels can be calculated from either the previous period's open or its EQ (midpoint), giving flexibility depending on analytical preference.
Efficient Labeling:
Labels are only rendered on the last bar and are automatically cleared and redrawn to prevent duplication.
Label style, size, text color, and background color are all user-configurable.
Trading Application
This indicator is especially suited for:
1. Mean Reversion Strategies
When price moves beyond +1.0 or +1.5 deviations from the EQ or open, it may signal overextension and a potential snap back to the midpoint or range.
2. Breakout Confirmation
Sustained price action beyond ±1.0 levels may indicate trend strength or continuation beyond historical balance zones.
3. Contextual Range Awareness
EQ and Open provide structure from which traders can judge whether price is in a state of balance or imbalance.
Labels offer at-a-glance interpretation of key levels across any chosen timeframe.
4. Fractal and Multi-Session Analysis
Analysts can layer daily, weekly, and monthly versions of this indicator to observe confluence or divergence of higher timeframe structure.
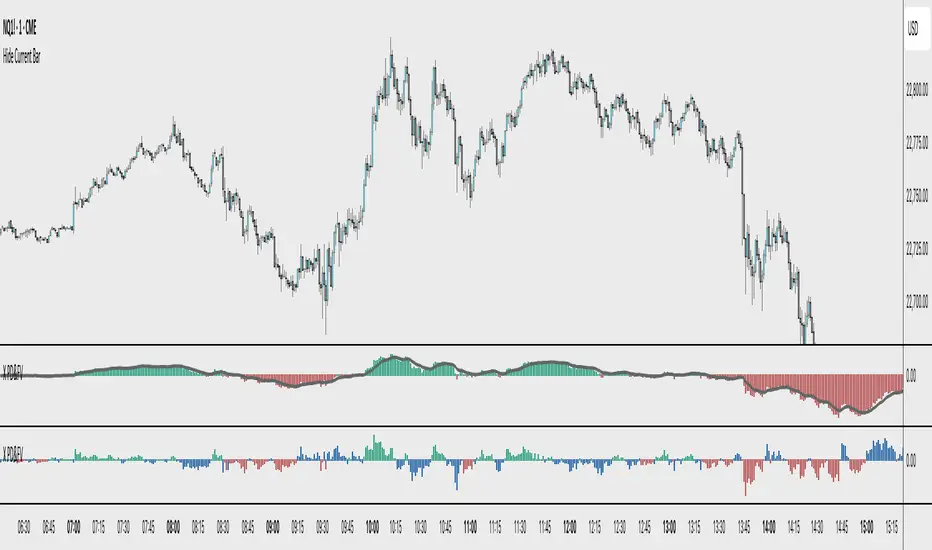
X PD&FVVisualizes the price's premium or discount relative to a moving average benchmark, highlighting mean-reversion and trend-continuation opportunities. While the underlying math is simple, the application is nuanced and can enhance decision-making in both trending and ranging market conditions.
Core Logic:
This tool calculates a custom **spread value**, defined as the distance between the current price and a chosen exponential moving average (EMA). Specifically:
When the current price is **above** the EMA, the spread is calculated as `low - EMA`.
When the price is **below** the EMA, the spread is calculated as `high - EMA`.
This approach creates a dynamic spread that reflects deviation from the EMA, with histogram bars:
Green when the spread is positive (suggesting a price premium),
Red when the spread is negative (suggesting a discount).
A secondary EMA (default 9-period) is applied to the spread itself, plotted as a smoother line over the histogram. This "EMA of spread" line can be interpreted as a moving reference level for detecting directional shifts in momentum.
Interpretation:
Zero Line = Fair Value: The horizontal zero axis represents equilibrium relative to the moving average. Movement toward or away from this line signals potential shifts in market bias.
Trend Following Use: In trending markets, traders can:
Buy when the spread dips below its EMA (discount within uptrend),
Sell when the spread rises above its EMA (premium within downtrend).
Mean Reversion Use: A return to the zero line (fair value) often acts as an **inflection point**, which traders can monitor for either:
Trend continuation (bounce away from zero), or
Reversal (cross through zero).
Customization:
EMA length (default 50) is adjustable to fit different timeframes or asset volatility.
HMA Crossover + ATR + Curvature (Long & Short)📏 Hull Moving Averages (Trend Filters)
- fastHMA = ta.hma(close, fastLength)
- slowHMA = ta.hma(close, slowLength)
These two HMAs act as dynamic trend indicators:
- A bullish crossover of fast over slow HMA signals a potential long setup.
- A bearish crossunder triggers short interest.
⚡️ Curvature (Acceleration Filter)
- curv = ta.change(ta.change(fastHMA))
This calculates the second-order change (akin to the second derivative) of the fast HMA — effectively the acceleration of the trend. It serves as a filter:
- For long entries: curv > curvThresh (positive acceleration)
- For short entries: curv < -curvThresh (negative acceleration)
It helps eliminate weak or stagnating moves by requiring momentum behind the crossover.
📈 Volatility-Based Risk Management (ATR)
- atr = ta.atr(atrLength)
- stopLoss = atr * atrMult
- trailStop = atr * trailMult
These define your:
- Initial stop loss: scaled to recent volatility using ATR and atrMult.
- Trailing stop: also ATR-scaled, to lock in gains dynamically as price moves favorably.
💰 Position Sizing via Risk Percent
- capital = strategy.equity
- riskCapital = capital * (riskPercent / 100)
- qty = riskCapital / stopLoss
This dynamically calculates the position size (qty) such that if the stop loss is hit, the loss does not exceed the predefined percentage of account equity. It’s a volatility-adjusted position sizing method, keeping your risk consistent regardless of market conditions.
📌 Execution Logic
- Long Entry: on bullish HMA crossover with rising curvature.
- Short Entry: on bearish crossover with falling curvature.
- Exits: use ATR-based trailing stops.
- Position is closed when trend conditions reverse (e.g., bearish crossover exits the long).
This framework gives you:
- Trend-following logic (via HMAs)
- Momentum confirmation (via curvature)
- Volatility-aware execution and exits (via ATR)
- Risk-controlled dynamic sizing
Want to get surgical and test what happens if we use curvature on the difference between HMAs instead? That might give some cool insights into trend strength transitions.

Opening Range Breakout (ORB) with Fib RetracementOverview
“ORB with Fib Retracement” is a Pine Script indicator that anchors a full Fibonacci framework to the first minutes of the trading day (the opening-range breakout, or ORB).
After the ORB window closes the script:
Locks-in that session’s high and low.
Calculates a complete ladder of Fibonacci retracement levels between them (0 → 100 %).
Projects symmetric extension levels above and below the range (±1.618, ±2.618, ±3.618, ±4.618 by default).
Sub-divides every extension slice with additional 23.6 %, 38.2 %, 50 %, 61.8 % and 78.6 % mid-lines so each “zone” has its own inner fib grid.
Plots the whole structure and—optionally—extends every line into the future for ongoing reference.
**Session time / timezone** – Defines the ORB window (defaults 09:30–09:45 EST).
**Show All Fib Levels** – Toggles every retracement and extension line on or off.
**Show Extended Lines** – Draws dotted, extend-right projections of every level.
**Color group** – Assigns colors to buy-side (green), sell-side (red), and internal fibs (gray).
**Extension value inputs** – Allows custom +/- 1.618 to 4.618 fib levels for personalized projection zones.
Previous 2 Days High/LowCan you give me a summary of this indicator
The "Previous 2 Days High/Low" indicator, written in Pine Script v5 for TradingView, plots horizontal lines representing the combined high and low prices of the previous two trading days on a chart. Here's a summary of its functionality, purpose, and key features:
Purpose
The indicator helps traders identify significant price levels by displaying the highest high and lowest low from the previous two days, which can act as potential support or resistance levels. These levels are plotted as lines that extend across the current trading day, making it easier to visualize key price zones for trading decisions.
Key Features
Calculates Combined High and Low:
Retrieves the high and low prices of the previous day and the day before using request.security on the daily timeframe ("D").
Computes the combined high as the maximum of the two days' highs and the combined low as the minimum of the two days' lows.
Dynamic Line Plotting:
Draws two horizontal lines:
Red Line: Represents the combined high, plotted at the highest price of the previous two days.
Green Line: Represents the combined low, plotted at the lowest price of the previous two days.
Lines are created at the start of a new trading day and extended to the right edge of the chart using line.set_x2, ensuring they span the entire current day.
Labels for Clarity:
Adds labels to the right of the chart, displaying the exact price values of the combined high ("Combined High: ") and combined low ("Combined Low: ").
Labels are updated to move with the lines, maintaining alignment at the current bar.
Clutter Prevention:
Deletes old lines and labels at the start of each new trading day to avoid overlapping or excessive objects on the chart.
Dynamic Requests:
Uses dynamic_requests=true in the indicator() function to allow request.security calls within conditional blocks (if ta.change(time("D"))), enabling daily data retrieval within the script's logic.
First Candle🕯️ First Candle Indicator (First 5-Minute Candle High/Low)
The First Candle indicator automatically marks the high and low of the first 5-minute candle of the U.S. trading session . These levels can act as key intraday support and resistance zones, often used in breakout, scalping, or opening-range trading strategies.
📌 Key Features:
Automatic detection of the first candle of the U.S. session based on the selected timeframe (default is 5 minutes).
Horizontal lines are plotted at the high and low of that candle, with fully customizable colors and thickness.
Labels show the exact level and timeframe used for the high and low.
Resets daily, removing previous session data at the start of a new session.
Displays a visual marker (blue triangle) when the first candle is detected.
Allows users to select different timeframes for defining the "first candle" (e.g., 1, 5, 15 minutes).
⚙️ Customizable Inputs:
Show First Candle Lines: toggle the display of high/low lines.
Timeframe for Marking: choose the timeframe to detect the first candle (e.g., 5 minutes).
High Line Color / Low Line Color: set the color of each level line.
Line Thickness: adjust the width of the lines (1 to 5 pixels).
🧠 Strategic Applications:
Identify breakout zones right after the market opens.
Define opening range for pullback or continuation setups.
Set clear reference levels for intraday trading decisions.

LANZ Strategy 1.0 [Backtest]🔷 LANZ Strategy 1.0 — Time-Based Session Trading with Smart Reversal Logic and Risk-Controlled Limit Orders
This backtest version of LANZ Strategy 1.0 brings precision to session-based trading by using directional confirmation, pre-defined risk parameters, and limit orders that execute overnight. Designed for the 1-hour timeframe, it allows traders to evaluate the system with configurable SL, TP, and risk settings in a fully automated environment.
🧠 Core Strategy Logic:
1. Directional Confirmation at 18:00 NY:
At 18:00 NY, the system compares the 08:00 open vs the 18:00 close:
If the direction matches the previous day, the signal is reversed.
If the direction differs, the current day's trend is kept.
This logic is designed to avoid momentum exhaustion and capture corrective reversals.
2. Entry Level Definition:
Based on the confirmed direction:
For BUY, the Low of the day is used as Entry Point (EP).
For SELL, the High of the day becomes EP.
The system plots a Stop Loss and Take Profit based on user-defined pip inputs (default: SL = 18 pips, TP = 54 pips → RR 1:3).
3. Time-Limited Entry Execution (LIMIT Orders):
Orders are sent after 18:00 NY and can be triggered anytime between 18:00 and 08:00 NY.
If EP is not touched before 08:00, the order is automatically cancelled.
4. Manual Close Feature:
If the trade is still open at the configured hour (default 09:00 NY), the system closes all positions, simulating realistic intraday exit scenarios.
5. Lot Size Calculation Based on Risk:
Lot size is dynamically calculated using the account size, risk percentage, and SL distance.
This ensures consistent risk exposure regardless of market volatility.
⚙️ Step-by-Step Flow:
08:00 NY → Captures the open of the day.
18:00 NY → Confirms direction and defines EP, SL, and TP.
After 18:00 NY → If conditions are met, a LIMIT order is placed at EP.
Between 18:00–08:00 NY → If price touches EP, the trade is executed.
At 08:00 NY → If EP wasn’t touched, the order is cancelled.
At Configured Manual Close Time (default 09:00 NY) → All open positions are force-closed if still active.
🧪 Backtest Settings:
Timeframe: 1-hour only
Order Type: strategy.entry() with limit=
SL/TP Configurable: Yes, in pips
Risk Input: % of capital per trade
Manual Close Time: Fully adjustable (default 09:00 NY)
👨💻 Credits:
Developed by LANZ
Strategy logic and trading concept built with clarity and precision.
Code structure and documentation by Kairos, your AI trading assistant.
Designed for high-confidence execution and clean backtesting performance.
