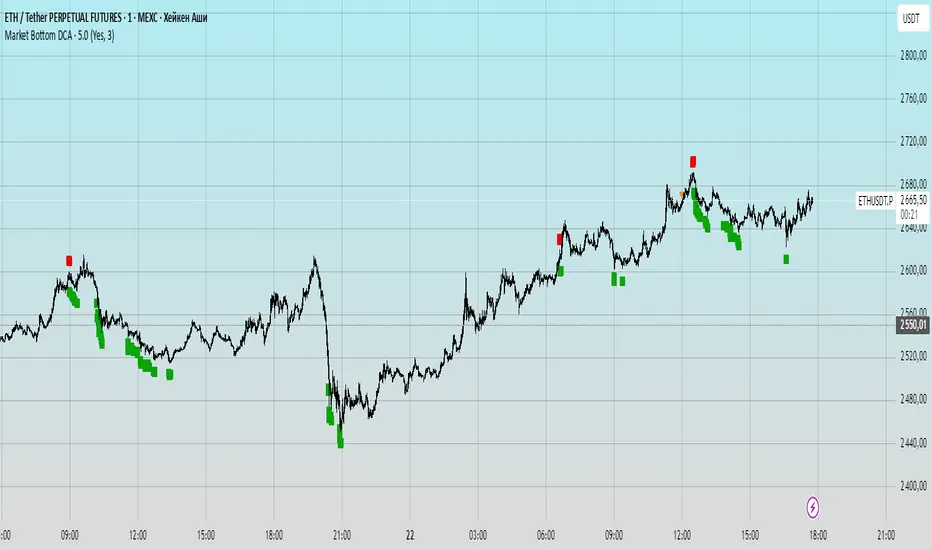
Market BottomDiscover the "Market Bottom" Indicator: Your Ultimate Trading Companion.
Unlock the power of precision trading with the Market Bottom indicator. This indicator is engineered to help traders identify optimal buying and selling opportunities while providing actionable insights through advanced Dollar-Cost Averaging (DCA) strategies and customizable take-profit settings. Whether you're a seasoned trader or just starting, Market Bottom empowers you to navigate the markets with confidence.
Why Choose Market Bottom?
Versatile Trading Styles: Whether you prefer quick scalps or long-term DCA strategies, Market Bottom adapts to your approach with its flexible settings.
Data-Driven Decisions: Leverage real-time trade cycle data, average entry prices, and customizable take-profit levels to make informed trades.
User-Friendly Interface: Intuitive visuals and customizable options make it accessible for traders of all levels.
Automation-Ready: Set up alerts to act on opportunities instantly, streamlining your trading process.
Get Started Today!
Transform your trading with the Market Bottom indicator. Perfect for stocks, forex, crypto, and more, this tool equips you with the insights needed to capitalize on market opportunities. Add it to your TradingView charts and start trading smarter today!
DCA
SmartScale Envelope DCA This is a Dollar-Cost Averaging (DCA) long strategy that buys when price dips below a moving average envelope and adds to the position in a stepwise, risk-controlled way. It uses up to 8 buy-ins, applies a cooldown between entries, and exits based on either a take profit from average entry price or a stop loss. Backtest range limits trades to the last 365 days for backtest control.
All input settings can and should be adjusted to the chart, as volatility in price action varies. Simply go into the inputs settings, and start from the top and move down to get better backtest results. Moving from the top down has been proven to give the best results. Then, move to properties and set your order size, pyramiding, and so on. It may be necessary to then fine tune your adjustments a second time to dial it in.
Works well on 1 hour time frames and in volatility.
Happy Trading!

DCA OptimizedMonthly or Daily DCA strategy, with adjustable capital allocation percentages at the beginning of each quarter (January, April, July, and October) as well as for the other months of the year. Capital allocation settings are also customizable for daily DCA.
The strategy consists of performing annual DCA, taking profits at the end of the year, specifically on December 31st of each year, and repeating the process the following year.
If the year ends with an unrealized loss on the total invested, hold the assets until December 31st, until the asset is in profit.
Purchases are made on the first day of each month, at the daily opening price. The same applies to monthly or daily DCA (daily opening price).
By default, it is recommended to invest twice as much at the beginning of each quarter (January/April/July/October) compared to other months of the year. This allows you to optimize the average acquisition price over the long term, thus maximizing profits and reducing potential unrealized losses.
Example: January/April/July/October > 12.5% of the capital / Other months of the year > 6.25% of the capital (Total over 12 months = 100%)
You can select/unselect the months of the year in which to invest as you wish to optimize your periodic preferences.

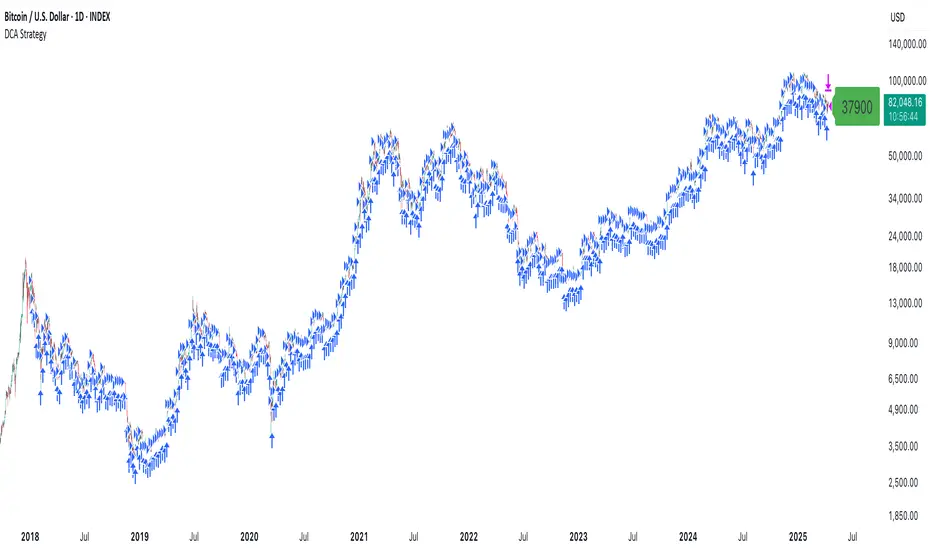
DCA StrategyThis strategy makes it easy for you to backtest and automate the DCA strategy based on 2 triggers:
Day of the week
Every X candles
This way you can set up your DCA strategy the way you like and automate on any exchange or even a DEX, which offers an API.
The strategy is auto selling on the last candle, otherwise you won't see any performance numbers because all positions will still be open (non conclusive).
Settings
Start Date & End Date
Use those dates to help you with your backtest period. It also helps when automating, to start at a specific time to mimic what you have already done on your own portfolio and thus be in sync in TV as well.
Capital to invest per trade
Set how capital to use per DCA buy signal. Hover over the tooltip to understand, which currency is used.
Close All on last candle
When backtesting, you must close open positions, otherwise the Strategy Tester won't show you any numbers. This is why the strategy automatically closes all positions on the last candle for your convenience (ON per default).
BUT, when automating, you cannot have this checked because it would sell all of your asset on every candle open. So turn this OFF when automating.
Use Day of Week Mode
This checkbox switches between the "Day of Week" mode or the "Every X Candles" mode.
Day of Week
Opens a long position at the start of the weekday you have set it to.
Hover over the tooltip to understand, which number to use for the day of the week you need.
Every X Candles
Opens a long position after every x candles. Always at the start of every such candle.
On the daily chart, this number represents "1 day", on the 1h chart, it's "1 hour" and so on.
Properties
Initial Capital
DCA has a special quirk and that is that it invests more and more and more funds the longer it runs. But TradingView takes the Initial Capital number to calculate Net Profit, thus the Initial Capital number has to grow with every additional dollar (money) that is being invested over time, otherwise the Net Profit number will be wrong.
Sadly PineScript does not allow to set the Initial Capital number dynamically. So you have to set it manually.
To that end, this strategy shows a Label on the last candle, which shows the Invested Capital. You must take that number and put it into the Initial Capital input and click Ok .
If you don't do this, your Net Profit Number will be totally wrong!
The label must show green .
If it shows red it means you need to change the Initial Capital number before looking at the performance numbers.
After every timeframe or settings change, you must adapt the Initial Capital, otherwise you will get wrong numbers.
BTC DCA RangeBTC DCA Range indicator is designed to help traders identify potential Dollar-Cost Averaging (DCA) opportunities for Bitcoin (BTC) based on deviations from a reference moving average (MA). It highlights price zones where BTC is trading significantly below a long-term moving average, suggesting potential undervaluation or buying opportunities.
The indicator dynamically adjusts the moving average length based on the selected chart timeframe, ensuring consistency across different timeframes (e.g., daily, weekly, or monthly). It also allows users to set a custom deviation threshold to identify when the price is trading at a significant discount relative to the moving average.
Adjust the Reference MA Length and Deviation Threshold inputs to suit your trading strategy

Altcoins DCA ScalperIntroduction
The Altcoins DCA Scalper is a Pine Strategy Script designed to automate Altcoins trading through 3Commas integration. It implements a Dollar-Cost Averaging (DCA) strategy that expands upon 3Commas' standard DCA capabilities, helping to manage risk while trading both long and short positions automatically.
This tool aims to assist both beginners exploring automated trading and experienced 3Commas users seeking dynamic DCA automation. The script is specifically designed for the 1-minute timeframe , where it has shown a good balance between performance and risk management. Complete setup typically takes less than 10 minutes, with a detailed guide making configuration straightforward for users of all experience levels.
------------------------------
🔶 What is DCA?
------------------------------
Dollar-cost averaging (DCA) refers to the practice of gradually increasing your position size at lower prices when trading long, or at higher prices when trading short, to achieve a better average entry price if the market moves against the initial entry . Instead of investing all capital at once, which could result in a significant drawdown if the price moves unfavorably, DCA spreads entries across different price levels to help manage potential drawdowns as they occur.
In this script, DCA is implemented through a system that:
🔹 Triggers safety orders only when/if needed (if take profit isn't reached quickly)
🔹 Dynamically adjusts order sizing based on market volatility
🔹 Automatically reduces take profit targets after each DCA order to increase the likelihood of a positive outcome
🔹 Can handle drawdowns depending on market volatility and settings
The images below illustrate two scenarios: one where an entry reaches the take profit directly, without activating DCA orders, and another where DCA is utilized, with the order closing positively after two DCA orders.
Case 1: Order closes in profit after entry
Case 2: Order closes in profit after 2 DCA orders (dynamically placed based on trend and volatility)
This DCA implementation aims to enhance standard 3Commas DCA by adding market-adaptive features while maintaining risk management principles.
------------------------------
🔶 Could this strategy script benefit you?
------------------------------
This script may be helpful if you are:
✅ Looking to automate your trading through 3Commas integration while maintaining full control of your assets
✅ Wanting to enhance 3Commas' standard DCA with market-adaptive features that consider:
Multi-timeframe trend analysis
Real-time volatility assessment
Dynamic safety order sizing and timing
✅ Seeking to minimize chart monitoring through full automation of:
Entry and exit decisions
Safety order management
Risk controls
✅ Interested in comprehensive performance tracking with:
Real-time position metrics
Detailed backtesting capabilities
Risk/reward analysis
Backtesting Metrics (script performance over the backtesting period - which is approx. 15 days on the 1min timeframe with the TradingView Pro Plan):
Current/Open Deal Metrics (the deal is currently under DCA, and waiting for further actions to close):
✅ Looking for trading automation that remains easy to set up and use
Note: While this script provides trading automation, successful trading requires proper education, risk management, and regular performance monitoring. No automated tool can guarantee trading success or profits.
------------------------------
🔶 How it Works
------------------------------
The Altcoins DCA Scalper provides trading automation through:
Market Analysis
* Multi-timeframe trend analysis (1m to 1d) for market direction and entry validation
* Volatility assessment (1h, 4h, 24h) benchmarked against TOTAL3 (excluding Top10 Altcoins and Stablecoins)
* Real-time adjustment of DCA parameters based on:
* Current volatility class (low/medium/high) vs. overall Altcoins market
* Market trend strength
* Price action dynamics
Trading Execution
* Position opening aligned with detected market trends
* "Beast Mode" base order sizing that increases position size during strong trends
* Dynamic take-profit targets that automatically reduce after each safety order to increase the likelihood of positive exits
* Dynamic DCA with safety orders that can:
* Adapt timing based on volatility
* Scale order sizes based on market conditions
* Handle 30-50% drawdowns depending on volatility class
* Execute up to 6 safety orders per position
Risk Management
* Emergency exits during extreme market events:
* "Black Swan" protection for long positions
* "God-Candle" protection for short positions
* Configurable stop-loss with volatility-based placement
* Trend-switch management with automated position reversal
* Position aging controls to prevent capital lock-up
* Leveraged trading protection with a pre-liquidation exit system
Integration & Automation
* Quick setup with two 3Commas bots (typically under 10 minutes)
* Fully automated signal generation and execution through 3Commas
* Detailed performance tracking including:
* Real-time position metrics
* DCA depth analysis
* Win rate and ROE calculations
* Pre-configured settings optimized for most pairs
* Multiple customization options for experienced users
Note: While this strategy employs automation and risk management, trading always carries the risk of loss. No system can guarantee profits, and market conditions significantly impact performance. Always do your own research and monitor your positions closely.
------------------------------
How to Use
------------------------------
Setting up the Altcoins DCA Scalper is quick and facilitated by the User Interface:
1️⃣ 3Commas/TradingView Setup
* Create two 3Commas accounts if using the FREE plan:
* One account for Long Bot
* One account for Short Bot
* This split allows full functionality while staying within 3Commas' free tier limits
* You do not need two separate accounts if you have a Paid 3Commas subscription
* While a free TradingView account works with the script, it limits you to one trading pair and a 4-day backtesting history. A paid TradingView subscription removes these limitations (such as the "Essential" plan).
2️⃣ Bot Configuration
* Create one Long and one Short DCA Bot in 3Commas
* Follow the setup guide available in the script itself for hassle-free configuration
* Copy Bot IDs and Email Token for script connection
* No complex settings needed - the script manages all DCA parameters by itself
3️⃣ Script Implementation
* Apply the script to your TradingView charts
* Use the built-in backtesting to analyze performance on different pairs
* Focus on USDT.P futures pairs with good volatility
4️⃣ Trading Activation
* Create TradingView alerts for each trading pair you want to activate
* Example: Set an alert for BINANCE: XRPUSDT.P following the in-script guide
* The script automatically manages all aspects:
* Entry and exit decisions
* DCA execution
* Risk management
* Position monitoring
Capital Requirements
* Important: Ensure sufficient capital to cover all activated pairs
* Consider volatility class when allocating capital to specific pairs
Once setup is complete, the script operates fully automatically while you maintain complete control of your funds through 3Commas and your exchange.
Note: While the setup is straightforward, always start with a small number of pairs and monitor performance before expanding. Trade responsibly and never risk more than you can afford to lose.
------------------------------
Explaining the Settings
------------------------------
The Altcoins DCA Scalper offers mulitple customization options during the setup process. All settings include detailed tooltips and default values.
Core Settings Sections:
1️⃣ 3Commas Connection
* Bot IDs and Email Token configuration
* Leverage settings (1x to 5x supported)
* Detailed 3Commas bot setup guide included
* Automatic bot control configuration
2️⃣ Trading Parameters
* Capital allocation per trade
* Timeframe verification
* Alert system setup
* Backtesting period control
* Performance tracking preferences
3️⃣ Advanced Features
🔹 Risk Management Suite
* Emergency exit controls (to strengthen protection against extraordinary market events)
* Customizable stop-loss system
* Trend-based exit management
* Position aging controls
* Liquidation protection features
* Advanced DCA controls
🔹 Performance Analytics
* Real-time position monitoring
* Comprehensive backtesting metrics
* DCA depth analysis
* Win rate calculations
* Capital efficiency tracking
🔹 Technical Optimizations
* Exchange minimum order adjustment
* Trading pair name override capability
* System stability controls
* Error handling mechanisms
🔹 Interface Customization
* Theme selection
* Chart overlay options
* Warning display preferences
* Performance metrics visibility
All settings come pre-configured but can be fully customized based on your trading preferences and risk tolerance. The script includes tooltips and setup guides for each option.
Note: While default settings may be tested, market conditions vary and all trading involves risk. Monitor performance and adjust settings according to your risk management requirements.
------------------------------
Frequently Asked Questions
------------------------------
Here are some common questions you may have, and our answers:
❓ Is this tool only for experts? I'm new to algo trading, can I use it?
No, the Altcoins DCA Scalper could be used by both beginners and experienced traders. The setup process is guided, and the algorithm handles all the calculations in the background.
❓ I'm not familiar with 3Commas. Is that a problem?
While the script is designed to work with 3Commas, a step-by-step guide is provided within the script to help you set up your 3Commas accounts and bots, if needed.
❓ Do I need to constantly monitor the script after it's set up?
No, after the initial setup and configuration, the script operates autonomously. It handles all aspects of trading including entries, exits, DCA management, and risk controls. However, we recommend:
* Checking performance metrics daily
* Reviewing position statistics weekly
* Adjusting pair selection monthly based on performance
* Monitoring overall market conditions that might require adjustments
❓ Can I use it with leverage?
Yes, the script is designed to work with leverage up to 5x on perpetual futures pairs (USDT.P). It includes specific features for leveraged trading:
* Dynamic safety order placement based on distance to liquidation
* Pre-liquidation exit system to minimize exchange fees
* Adjustable take-profit targets optimized for leveraged positions
* Emergency exit system for extreme market movements
* Optional risk controls specific to leverage:
* Automatic exit in the liquidation danger zone
* Position size scaling based on leverage level
* Safety order adjustments for different leverage settings
While leverage can amplify returns, it also increases risk. We recommend starting with lower leverage (2x), or no leverage at all, until familiar with the script's operation.
❓ Does this script guarantee profits?
No, no script or trading strategy can guarantee profits. The Altcoins DCA Scalper provides a framework for implementing an automated DCA strategy, but your success will depend on many different factors and conditions.
❓ Do I need to understand the complex algorithms used in the script?
No, it’s not necessary. The logic is handled by the script, and you do not need to understand every detail to use it effectively. However, a basic knowledge of DCA concepts will be beneficial.
❓ Can I use this script with spot or leveraged trades?
The script is optimized for USDT.P pairs (perpetual futures) with leverage up to 5x. This allows:
* Automatic long/short position management
* Increased capital utilization
* Full DCA functionality without holding the underlying assets
* Enhanced risk management features specific to futures
While spot trading is possible, it requires holding underlying assets for shorts and doesn't access the script's full capabilities.
❓What timeframe should I use?
This script is optimized for the 1-minute timeframe , which is the recommended setting for the best balance between performance, capital efficiency, and risk. While we recommend using the tool on the 1 minute TF, it would work on other timeframes too.
❓ What happens if my internet/computer goes down?
Since the script sends signals from Tradingview to 3Commas (which executes trades on your exchange), your positions and DCA management continue to function even if your TradingView chart is closed or your computer is off. The script only needs to be active to generate new signals.
❓ How are the DCA parameters determined?
The script dynamically adjusts DCA parameters based on:
* The pair's volatility class (compared to the overall altcoin market)
* Current market conditions and volatility
* Position direction (long/short)
* Leverage settings
* Number of safety orders already executed
This allows for adaptive/dynamic DCA compared to static or %-based parameters.
❓ What exchanges are supported?
The script works with any exchange supported by 3Commas for futures trading (approximately 15 different crypto Exchanges). However, it's optimized for Binance Futures (USDT.P pairs) due to its high liquidity and for consistency.
❓ What happens during extreme market conditions?
The script includes some (optional) protective measures that can be activated:
* Emergency exits during sharp and abnormal market moves
* Automatic adjustment of DCA parameters during high volatility
* Position closure on significant trend changes
* Special handling of aged positions
These features aim to protect capital during unusual market conditions.
❓How many pairs can I trade simultaneously?
This depends on your total capital. As a general indication, define the number of pairs to activate based on:
* Total available capital
* Desired position size per pair
* Risk tolerance
* Pairs' volatility class
------------------------------
Final Thoughts
------------------------------
We believe that your trading performance will greatly depend on your selection of appropriate trading pairs for this script (high volatility), and your commitment to regularly monitoring its performance and adjust the settings, rather than on the script alone.
------------------------------
⚠️ Risk Disclaimer
------------------------------
Remember that trading involves risk, and most day traders experience losses. This script is for educational and informational purposes only. Past performance does not guarantee future results. This is not financial advice, and you should always do your own research (DYOR). Trade responsibly with capital you can afford to lose.
The Altcoins DCA Scalper is an independent tool and is not endorsed, connected, or validated by TradingView.
3Commas is a third-party service, and TradingView is not responsible for the 3Commas integration or the performance of 3Commas bots. You are solely responsible for the security and management of your 3Commas account. Do not share your 3Commas access credentials (like login information, Bots-ID, Email Token) with anyone. The Author of the script has no access to such information, and nobody (but you) should.

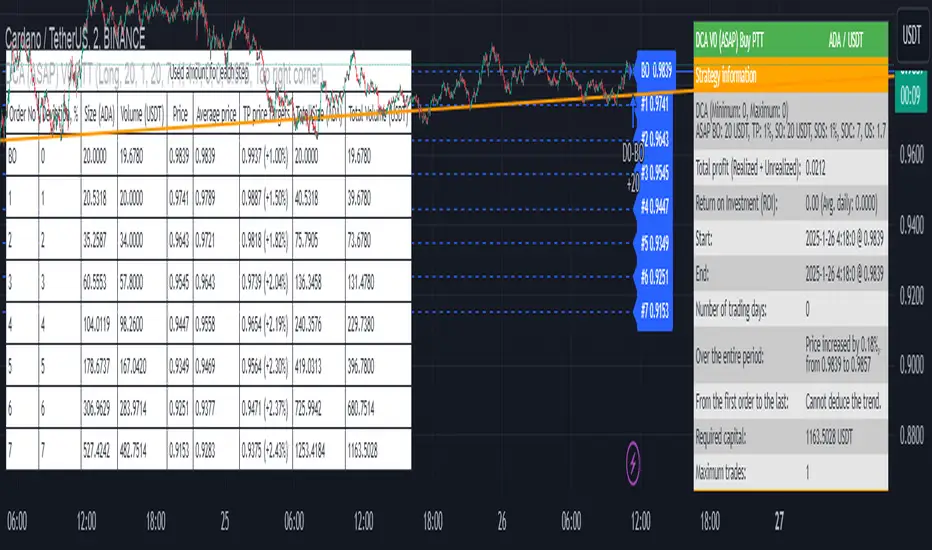
DCA (ASAP) V0 PTTScript Name: DCA (ASAP) V0 PTT
Detailed Description:
This script implements the Dollar-Cost Averaging (DCA) strategy, allowing you to automatically manage buy/sell orders safely and efficiently. Below are the key features of this script:
1. Purpose and Operation:
o Supports both Long and Short trading modes.
o Designed to optimize profitability using the DCA method, where Safety Orders are triggered when the price moves against the predicted direction.
o Helps users maintain their Target Profit in various market conditions.
2. Main Features:
o Automatic Order Placement: The initial Base Order is opened as soon as no active order exists.
o Safety Order Management: Safety Orders are automatically placed when the price moves against the initial order. The volume and distance of these orders are customizable.
o Order Closing: Orders are closed upon reaching the Target Profit, accounting for transaction fees.
o Detailed Information Display: Displays open orders, trading statistics, and performance metrics directly on the chart.
3. Customizable Parameters:
o Base Order Size: The size of the initial order.
o Target Profit (%): Target profit as a percentage of the total order volume.
o Safety Order Size: The size of each Safety Order.
o Price Deviation (%): The percentage distance between consecutive Safety Orders.
o Safety Order Volume Scale: The scaling factor for increasing the volume of subsequent Safety Orders.
o Max Safety Orders: The maximum number of Safety Orders allowed per deal.
4. Unique Features:
o Backtest Range Support: Enables you to limit backtesting to a specific time range of interest.
o Comprehensive Statistics: Displays detailed tables including open trades, pending orders, ROI, trading days, and realized profit.
o Integrated Trading Fees: Includes transaction fees in profit calculations for precise results.
5. Usage Instructions:
o Select the trading mode (Long or Short) from the "Strategy" input.
o Customize parameters such as Base Order, Safety Order, and Target Profit according to your requirements and the asset being traded.
o Monitor the performance of the strategy through the displayed information tables.
Notes:
• This script does not disclose detailed calculation logic but provides an overview of the concepts and usage.
• Designed for trading on exchanges that support margin or spot trading.
Net Unrealized Profit Loss | JeffreyTimmermansNet Unrealized Profit Loss (NUPL)
The "Net Unrealized Profit Loss" (NUPL) indicator is a highly regarded tool for assessing Bitcoin investor sentiment by analyzing the relationship between Market Value and Realized Value. This Pine Script implementation, developed by Jeffrey Timmermans, includes additional features such as dynamic labels, alerts, and thresholds with color-coded bands, enhancing its usability for traders and analysts.
Core Concepts Behind NUPL
Market Value (MV):
Defined as the current Bitcoin price multiplied by the number of coins in circulation.
Equivalent to market capitalization in traditional finance.
Realized Value (RV):
Calculated by considering the price at which each Bitcoin last moved (e.g., transferred between wallets).
The average price of all these transactions is multiplied by the total coins in circulation.
Net Unrealized Profit Loss (NUPL):
Formula: NUPL = (Market Value − Realized Value) : Market Value × 100
Measures the proportion of paper profits or losses held by investors relative to the market cap.
Significance of NUPL:
Tracks investor sentiment over time.
A high NUPL value indicates that most investors are in profit, often signaling potential market overheating.
A low or negative NUPL suggests pessimism and undervaluation, which may precede market recovery.
How to View the Chart
The NUPL chart uses distinct percentage bands to delineate various market phases. These bands provide context for understanding investor sentiment and market stages:
Extreme Low Values (< 0%): Indicates widespread losses; the market may be near capitulation.
Neutral Value (0%): A balance between profit and loss; often signifies a transition phase.
Slightly High to High Values (> 0% to 50%): Increasing profits suggest growing optimism; early stages of bullish trends.
Extreme High Values (> 75%): Signals overheating; often corresponds to excessive greed, which may precede corrections.
The colored bands visually represent these stages, enabling traders to identify key turning points.
Features of the Script
Querying Data
The indicator uses data from two key sources:
Bitcoin Market Cap (MC1): GLASSNODE:BTC_MARKETCAP
Bitcoin Realized Cap (MCR): COINMETRICS:BTC_MARKETCAPREAL
These values are fetched using the request.security function to ensure daily accuracy, regardless of the chart's timeframe.
Threshold Calculation
The script computes NUPL values dynamically and compares them against historical lows:
Calculated using the ta.lowest function over a 1,000-bar lookback period.
The average of the historical low and the current NUPL value, providing a dynamic baseline.
Value Classification
NUPL is categorized into sentiment levels with corresponding weights:
< Low Threshold: 1 (Extreme Bearish)
Low to 0: 0.75 (Moderate Bearish)
0 to 25: 0.25 (Neutral to Slightly Bullish)
25 to 50: -0.25 (Moderate Bullish)
50 to 75 : -0.75 (Strong Bullish)
> 75: -1 (Extreme Bullish)
Visual Elements
NUPL Line Plot:
The NUPL line is plotted in orange for clear visibility.
Threshold Bands:
Horizontal thresholds ranging from -160 to 160 and are plotted, representing key sentiment levels. Bands are categorized as:
Extreme High/Low Values
Significant High/Low Values
Neutral Values
Fill Colors:
Red Shades (Bearish Sentiment): Above neutral levels.
Green Shades (Bullish Sentiment): Below neutral levels.
The opacity of fills decreases as sentiment moves from extreme to neutral values.
Dynamic Label:
A real-time label displays the current NUPL value and sentiment classification.
Positioned directly on the NUPL line for immediate insight.
Alerts:
The indicator includes two alerts for crossing key thresholds:
NUPL Above 0% Alert: Triggers when NUPL crosses above the neutral value, signaling a shift to positive sentiment.
NUPL Below 0% Alert: Triggers when NUPL crosses below the neutral value, indicating a shift to negative sentiment.
Alerts are configured with alert.freq_once_per_bar to avoid redundancy during intra-bar fluctuations.
Use Cases
Identifying Market Extremes:
Use NUPL levels to pinpoint moments of extreme greed or fear, which often precede market reversals.
Long-Term Strategy:
NUPL trends can assist strategic investors in deciding when to accumulate during pessimistic phases or take profits during euphoria.
Market Sentiment Analysis:
Provides a macro perspective on the prevailing investor sentiment, offering valuable context for trading decisions.
Conclusion
The Net Unrealized Profit Loss (NUPL) indicator combines advanced data processing with intuitive visualization to deliver actionable insights into Bitcoin market sentiment. With its real-time alerts, dynamic labels, and comprehensive banding system, this tool is indispensable for traders and investors seeking to understand and anticipate market movements based on sentiment analysis.
-Jeffrey

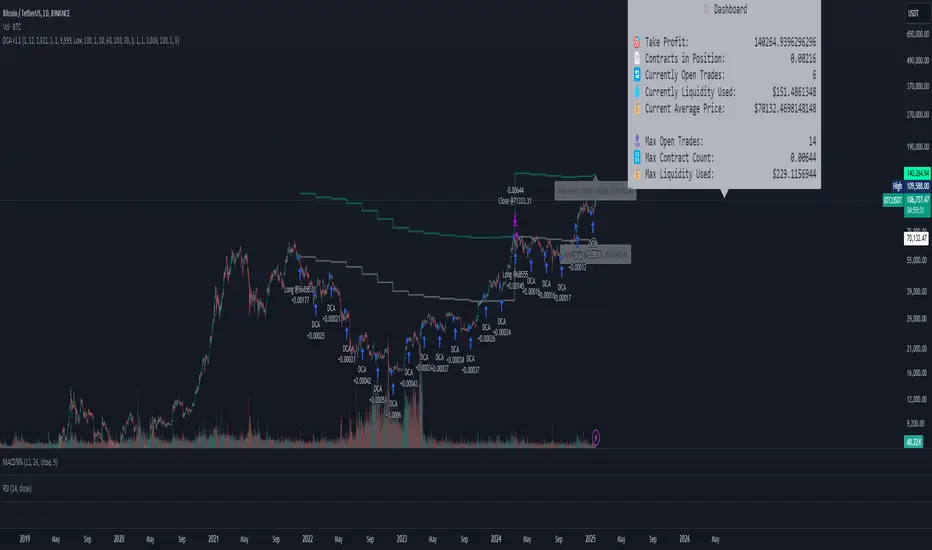
DCA Simulation for CryptoCommunity v1.1Overview
This script provides a detailed simulation of a Dollar-Cost Averaging (DCA) strategy tailored for crypto traders. It allows users to visualize how their DCA strategy would perform historically under specific parameters. The script is designed to help traders understand the mechanics of DCA and how it influences average price movement, budget utilization, and trade outcomes.
Key Features:
Combines Interval and Safety Order DCA:
Interval DCA: Regular purchases based on predefined time intervals.
Safety Order DCA: Additional buys triggered by percentage price drops.
Interactive Visualization:
Displays buy levels, average price, and profit-taking points on the chart.
Allows traders to assess how their strategy adapts to price movements.
Comprehensive Dashboard:
Tracks money spent, contracts acquired, and budget utilization.
Shows maximum amounts used if profit-taking is active.
Dynamic Safety Orders:
Resets safety orders when a new higher high is established.
Customizable Parameters:
Adjustable buy frequency, safety order settings, and profit-taking levels.
Suitable for traders with varying budgets and risk tolerances.
Default Strategy Settings:
Account Size: Default account size is set to $10,000 to represent a realistic budget for the average trader.
Commission & Slippage: Includes realistic trading fees and slippage assumptions to ensure accurate backtesting results.
Risk Management: Defaults to risking no more than 5% of the account balance per trade.
Sample Size: Optimized to generate a minimum of 100 trades for meaningful statistical analysis. Users can adjust parameters to fit longer timeframes or different datasets.
Usage Instructions:
Configure Your Strategy: Set the base order, safety order size, and buy frequency based on your preferred DCA approach.
Analyze Historical Performance: Use the chart and dashboard to understand how the strategy performs under different market conditions.
Optimize Parameters: Adjust settings to align with your risk tolerance and trading objectives.
Important Notes:
This script is for educational and simulation purposes. It is not intended to provide financial advice or guarantee profitability.
If the strategy's default settings do not meet your needs, feel free to adjust them while keeping risk management in mind.
TradingView limits the number of open trades to 999, so reduce the buy frequency if necessary to fit longer timeframes.
Relative Risk MetricOVERVIEW
The Relative Risk Metric is designed to provide a relative measure of an asset's price, within a specified range, over a log scale.
PURPOSE
Relative Position Assessment: Visualizes where the current price stands within a user-defined range, adjusted for log scale.
Logarithmic Transformation: Utilizes the natural log to account for a log scale of prices, offering a more accurate representation of relative positions.
Calculation: The indicator calculates a normalized value via the function Relative Price = / log(UpperBound) − log(LowerBound) . The result is a value between 0 and 1, where 0 corresponds to the lower bound and 1 corresponds to the upper bound on a log scale.
VISUALIZATION
The indicator plots three series:
Risk Metric - a plot of the risk metric value that’s computed from an asset's relative price so that it lies within a logarithmic range between 0.0 & 1.0.
Smoothed Risk Metric - a plot of the risk metric that’s been smoothed.
Entry/Exit - a scatter plot for identified entry and exit. Values are expressed as percent and are coded as red being exit and green being entity. E.g., a red dot at 0.02 implies exit 2% of the held asset. A green dot at 0.01 implies use 1% of a designated capital reserve.
USAGE
Risk Metric
The risk metric transformation function has several parameters. These control aspects such as decay, sensitivity, bounds and time offset.
Decay - Acts as an exponent multiplier and controls how quickly dynamic bounds change as a function of the bar_index.
Time Offset - provides a centering effect of the exponential transformation relative to the current bar_index.
Sensitivity - controls how sensitive to time the dynamic bound adjustments should be.
Baseline control - Serves as an additive offset for dynamic bounds computation which ensures that bounds never become too small or negative.
UpperBound - provides headroom to accomodate growth an assets price from the baseline. For example, an upperbound of 3.5 accommodates a 3.5x growth from the baseline value (e.g., $100 -> $350).
LowerBound - provides log scale compression such that the overall metric provides meaningful insights for prices well below the average whilst avoiding extreme scaling. A lowerbound of 0.25 corresponds to a price that is approx one quarter of a normalised baseline in a log context.
Weighted Entry/Exit
This feature provides a weighted system for identifying DCA entry and exit. This weighting mechanism adjusts the metric's interpretation to highlight conditions based on dynamic thresholds and user-defined parameters to identify high-probability zones for entry/exit actions and provide risk-adjusted insights.
Weighting Parameters
The weighting function supports fine-tuning of the computed weighted entry/exit values
Base: determines the foundational multiplier for weighting the entry/exit value. A higher base amplifies the weighting effect, making the weighted values more pronounced. It acts as a scaling factor to control the overall magnitude of the weighting.
Exponent: adjusts the curve of the weighting function. Higher exponent values increase sensitivity, emphasizing differences between risk metric values near the entry or exit thresholds. This creates a steeper gradient for the computed entry/exit value making it more responsive to subtle shifts in risk levels.
Cut Off: specifies the maximum percentage (expressed as a fraction of 1.0) that the weighted entry/exit value can reach. This cap ensures the metric remains within a meaningful range and avoids skewing
Exit condition: Defines a threshold for exit. When the risk metric is below the exit threshold (but above the entry threshold) then entry/exit is neutral.
Entry condition: Defines a threshold for entry. When the risk metric is above the entry threshold (but below the exit threshold) then entry/exit is neutral.
Weighting Behaviour
For entry conditions - value is more heavily weighted as the metric approaches the entry threshold, emphasizing lower risk levels.
For exit conditions - value is more heavily weighted as the metric nears the exit threshold, emphasizing increased risk levels.
USE-CASES
Identifying potential overbought or oversold conditions within the specified logarithmic range.
Assisting in assessing how the current price compares to historical price levels on a logarithmic scale.
Guiding decision-making processes by providing insights into the relative positioning of prices within a log context
CONSIDERATIONS
Validation: It's recommended that backtesting over historical data be done before acting on any identified entry/exit values.
User Discretion: This indicator focus on price risk. Consider other risk factors and general market conditions as well.

00 Averaging Down Backtest Strategy by RPAlawyer v21FOR EDUCATIONAL PURPOSES ONLY! THE CODE IS NOT YET FULLY DEVELOPED, BUT IT CAN PROVIDE INTERESTING DATA AND INSIGHTS IN ITS CURRENT STATE.
This strategy is an 'averaging down' backtester strategy. The goal of averaging/doubling down is to buy more of an asset at a lower price to reduce your average entry price.
This backtester code proves why you shouldn't do averaging down, but the code can be developed (and will be developed) further, and there might be settings even in its current form that prove that averaging down can be done effectively.
Different averaging down strategies exist:
- Linear/Fixed Amount: buy $1000 every time price drops 5%
- Grid Trading: Placing orders at price levels, often with increasing size, like $1000 at -5%, $2000 at -10%
- Martingale: doubling the position size with each new entry
- Reverse Martingale: decreasing position size as price falls: $4000, then $2000, then $1000
- Percentage-Based: position size based on % of remaining capital, like 10% of available funds at each level
- Dynamic/Adaptive: larger entries during high volatility, smaller during low
- Logarithmic: position sizes increase logarithmically as price drops
Unlike the above average costing strategies, it applies averaging down (I use DCA as a synonym) at a very strong trend reversal. So not at a certain predetermined percentage negative PNL % but at a trend reversal signaled by an indicator - hence it most closely resembles a dynamically moving grid DCA strategy.
Both entering the trade and averaging down assume a strong trend. The signals for trend detection are provided by an indicator that I published under the name '00 Parabolic SAR Trend Following Signals by RPAlawyer', but any indicator that generates numeric signals of 1 and -1 for buy and sell signals can be used.
The indicator must be connected to the strategy: in the strategy settings under 'External Source' you need to select '00 Parabolic SAR Trend Following Signals by RPAlawyer: Connector'. From this point, the strategy detects when the indicator generates buy and sell signals.
The strategy considers a strong trend when a buy signal appears above a very conservative ATR band, or a sell signal below the ATR band. The conservative ATR is chosen to filter ranging markets. This very conservative ATR setting has a default multiplier of 8 and length of 40. The multiplier can be increased up to 10, but there will be very few buy and sell signals at that level and DCA requirements will be very high. Trade entry and DCA occur at these strong trends. In the settings, the 'ATR Filter' setting determines the entry condition (e.g., ATR Filter multiplier of 9), and the 'DCA ATR' determines when DCA will happen (e.g., DCA ATR multiplier of 6).
The DCA levels and DCA amounts are determined as follows:
The first DCA occurs below the DCA Base Deviation% level (see settings, default 3%) which acts as a threshold. The thick green line indicates the long position avg price, and the thin red line below the green line indicates the 3% DCA threshold for long positions. The thick red line indicates the short position avg price, and the thin red line above the thick red line indicates the short position 3% DCA threshold. DCA size multiplier defines the DCA amount invested.
If the loss exceeds 3% AND a buy signal arrives below the lower ATR band for longs, or a sell signal arrives above the upper ATR band for shorts, then the first DCA will be executed. So the first DCA won't happen at 3%, rather 3% is a threshold where the additional condition is that the price must close above or below the ATR band (let's say the first DCA occured at 8%) – this is why the code resembles a dynamic grid strategy, where the grid moves such that alongside the first 3% threshold, a strong trend must also appear for DCA. At this point, the thick green/red line moves because the avg price is modified as a result of the DCA, and the thin red line indicating the next DCA level also moves. The next DCA level is determined by the first DCA level, meaning modified avg price plus an additional +8% + (3% * the Step Scale Multiplier in the settings). This next DCA level will be indicated by the modified thin red line, and the price must break through this level and again break through the ATR band for the second DCA to occur.
Since all this wasn't complicated enough, and I was always obsessed by the idea that when we're sitting in an underwater position for days, doing DCA and waiting for the price to correct, we can actually enter a short position on the other side, on which we can realize profit (if the broker allows taking hedge positions, Binance allows this in Europe).
This opposite position in this strategy can open from the point AFTER THE FIRST DCA OF THE BASE POSITION OCCURS. This base position first DCA actually indicates that the price has already moved against us significantly so time to earn some money on the other side. Breaking through the ATR band is also a condition for entry here, so the hedge position entry is not automatic, and the condition for further DCA is breaking through the DCA Base Deviation (default 3%) and breaking through the ATR band. So for the 'hedge' or rather opposite position, the entry and further DCA conditions are the same as for the base position. The hedge position avg price is indicated by a thick black line and the Next Hedge DCA Level is indicated by a thin black line.
The TPs are indicated by green labels for base positions and red labels for hedge positions.
No SL built into the strategy at this point but you are free to do your coding.
Summary data can be found in the upper right corner.
The fantastic trend reversal indicator Machine learning: Lorentzian Classification by jdehorty can be used as an external indicator, choose 'backtest stream' for the external source. The ATR Band multiplicators need to be reduced to 5-6 when using Lorentz.
The code can be further developed in several aspects, and as I write this, I already have a few ideas 😊

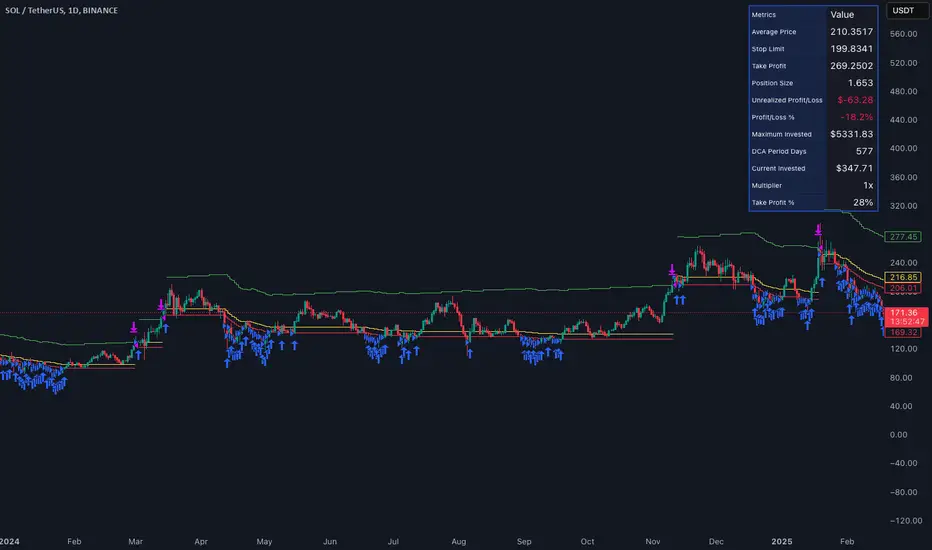
Smart DCA Invest LiteEnglish description:
📊 Smart DCA Invest – Features Overview
✅ Automated DCA strategy with dynamic profit targets, optimized risk management.
⚙️ Functionality:
🕒 Time Interval Settings
• 📅 Start Date and Time: The strategy activates only after the specified start time.
• 🔄 Auto Restart: Automatically restarts the strategy after a position is closed.
💵 Investment Amounts
• 🟢 Initial Investment Amount: The amount invested when the first position is opened.
• 🔄 Recurring Investment Amount: The amount invested periodically for subsequent purchases.
📊 Purchase Frequency
• ⏱ Interval Between Purchases: Specifies the minimum number of candles between two purchases to avoid overly frequent position expansions.
🛡️ Risk Management
• 📉 Loss Limit: The strategy halts additional purchases if the price does not drop below a predefined loss level, optimizing the average cost reduction.
• 🎯 Take Profit: A predefined profit target percentage, triggering position closure upon reaching it.
📈 Dynamic Take Profit (TP) Settings
• ⏳ TP Increase Frequency: The interval in days for dynamic TP growth.
• 📊 TP Growth Rate: The percentage by which the TP level increases at the end of each interval.
• ⚙️ Enable Dynamic TP: Allows the TP level to increase dynamically over time based on holding duration.
• 🧠 Smart Invest: Accumulates skipped purchases above the average entry or loss limit price and invests them when the price drops below the loss limit.
🎨 Visual Representation
• 📏 Average Price Line: Displays the average entry price in yellow.
• 🛑 Stop Limit Line: Displays the loss limit in red.
• ✅ Take Profit Line: Displays the dynamically updated profit target in green.
🎨 Visual Elements
• 📏 Average Price Line: Visualizes the average cost on the chart.
• 🛑 Stop Limit Line: Visualizes the loss limit level.
• ✅ Take Profit Line: Displays the TP level graphically.
• 📊 Statistics Table: Detailed data summary presented in a table at the end of the strategy.
📊 Statistics Table
• 📈 Average Price: The average entry price of the current position.
• 🛑 Stop Limit: The loss limit value.
• ✅ Take Profit: The profit target value.
• 📦 Position Size: The size of the current position.
• 💵 Max Invested Amount: The highest amount invested.
• ⏳ Longest DCA Period: The longest duration a DCA position was open.
• 💼 Current Investment: The amount currently invested.
• 🔄 Multiplier: Purchase multiplier value.
• 📊 Dynamically Adjusted TP %: The current dynamic Take Profit percentage.
- Recommended for retesting
Hungarian description:
📊 Smart DCA Invest – Funkciók Leírása
✅ Automatizált DCA stratégia dinamikus profitcélokkal, optimalizált kockázatkezeléssel.
⚙️ Működés:
🕒 Időintervallum Beállítások
• 📅 Kezdési dátum és idő: A stratégia csak a meghatározott kezdési időpont után aktiválódik.
• ⏳ Befejezési dátum és idő: A stratégia a meghatározott időpontig működik.
• 🔄 Automatikus újraindítás: Pozíciózárás után a stratégia automatikusan újraindulhat.
💵 Befektetési Összegek
• 🟢 Első befektetési összeg: Az első pozíció nyitásakor befektetett összeg.
• 🔄 Napi vásárlási összeg: Ismételt periódusonkénti vásárlások összege.
📊 Vásárlási Gyakoriság
• ⏱ Intervallum két vásárlás között: Meghatározza a minimális gyertya intervallumot két vásárlás között, elkerülve a túl gyakori pozícióbővítéseket.
🛡️ Kockázatkezelés
• 📉 Loss Limit: Ha az ár nem csökken egy meghatározott veszteségi szint alá, a stratégia nem vásárol tovább, hogy hatékonyabban csökkentse az átlagárat.
• 🎯 Take Profit: Előre meghatározott profitcél százalékos értéke, amely elérésekor a pozíció lezárul.
📈 Dinamikus Take Profit (TP) Beállítások
• ⏳ TP növelési gyakoriság: A dinamikus TP növekedésének időszaka napokban.
• 📊 TP növekedés mértéke: A TP szint százalékos növekedése az intervallum végén.
• ⚙️ Dinamikus TP engedélyezése: A TP szint dinamikusan növekszik a tartási idő függvényében.
• 🧠 Smart Invest: Kihagyott vásárlások felhalmozása (átlagos bekerülési vagy „Loss limit” feletti árfolyamnál), amelyek a „Loss limit” árszint alatt befektetésre kerülnek.
🎨 Vizuális Megjelenítés
• 📏 Átlagár vonal: Sárga színnel jelzi az átlagárat.
• 🛑 Stop Limit vonal: Piros színnel jelzi a veszteségi korlátot.
• ✅ Take Profit vonal: Zöld színnel jelzi a dinamikusan frissülő profitcélt.
🎨 Vizuális Elemek
• 📏 Átlagár vonal: Az átlagár megjelenítése a grafikonon.
• 🛑 Stop Limit vonal: A veszteségkorlátozási szint megjelenítése.
• ✅ Take Profit vonal: A Take Profit szint grafikai megjelenítése.
• 📊 Statisztikai táblázat megjelenítése: A stratégia végén részletes adatok jelennek meg egy táblázatban.
📊 Statisztikai Táblázat
• 📈 Átlagár: Az aktuális pozíció átlagos bekerülési ára.
• 🛑 Stop Limit: A veszteségkorlátozási szint értéke.
• ✅ Take Profit: A profitcél értéke.
• 📦 Pozícióméret: Az aktuális pozíció nagysága.
• 💵 Maximális befektetett összeg: A legnagyobb befektetett érték.
• ⏳ Leghosszabb DCA időszak: A leghosszabb időtartam, amíg egy DCA pozíció nyitva maradt.
• 💼 Aktuális befektetés: Az aktuálisan befektetett összeg.
• 🔄 Multiplikátor: Vásárlási szorzó érték.
• 📊 Dinamikusan beállított TP %: Az aktuálisan érvényes Take Profit százalékos értéke.
Risk Investor - Risk based DCAA Dollar Cost Averaging (DCA) tool that manages investments based on customizable risk levels. Features include:
Risk-based investment sizing
Vault system for deposit management
Daily/Weekly/Monthly investment options
Configurable profit-taking rules
Visual buy/sell indicators
The strategy uses buy multipliers to control position sizing. At lower risk levels (e.g., 0.1), higher multipliers (4x) enable larger purchases. As risk increases (e.g., 0.7), reduced multipliers (1x) limit market exposure, creating a dynamic DCA strategy that adapts to market conditions.
The sell mechanism activates at higher risk levels with configurable percentage-based exits.
For example, you can set 30% sell at risk level 0.8 and 70% at 0.9, creating a graduated exit strategy.
Profits automatically flow back into the vault system for reinvestment. If the vault is already topped up, profits are being taken out of the system.
Note: Risk Investor requires an external risk model.
Compatible options include:
Bitcoin Top Indicator by Da_Prof ()
Benjamin Cowen's Simplified Risk Metric by jacdr ()
Setup: Connect your chosen risk model via the risk indicator field and configure the minimum/maximum risk values. For example, when using Bitcoin Top Indicator by Da_Prof, set the Max. Risk Value to 12.

DCA Buy v1Key Features
1. Selective Entry Filters
Trend Filter
Enabled through "Enable Trend Filter?" using the "EMA Length" setting to ensure entries align with prevailing trends.
Momentum Filter
Configured using "Enable Momentum Filter?" combined with "RSI Length" and "RSI Source" to detect oversold conditions.
Bollinger Filter
Activated via "Enable Bollinger Filter?" along with "BB Length" and "BB Multiplier" to focus entries on deeper price dips below Bollinger Bands.
2. DCA Configuration
Base Order Settings
Choose between a percentage ("Base Order % of Equity/Initial Capital") or fixed value ("Base Order Value ($)").
Safety Order Settings
Fine-tune "Initial Deviation (%)" and "Price Deviation Multiplier" to control the spacing of safety orders.
Use "Volume Scaling Factor (Qty)" to scale the size of each subsequent safety order.
Customize the "First Safety Order Type" as either value-based or a multiplier of the base order using "1st Safety Order Value ($)" or "1st Safety Order Multiplier (Qty)".
Set the maximum number of safety orders through "Max Safety Orders".
3. Profit and Risk Management
Take Profit Settings
"Take Profit (%)" triggers a sell when a specific profit percentage above the average entry is reached.
Use "Trailing Take Profit (%)" to lock in profits while capturing additional upside if prices continue to rise.
Stop Loss Settings
Configure "Stop Loss (%)" to prevent excessive drawdowns by closing all positions when prices drop below a defined percentage.
4. Time Control & Visualization
Time Filters
Define trading windows with "Start Time" and "End Time".
Use "Cooldown (Seconds)" to avoid frequent entries during rapid price movements.
Visualization
Enable "Show Average Entry Price", "Show Take Profit Level", and "Show Stop Loss Level" to plot key levels on the chart for better monitoring.
5. Performance Metrics
Built-in performance tracking includes:
Net Profit (%): Measures overall profitability.
Win Rate (%): Displays the ratio of winning trades.
Max Drawdown (%): Tracks the largest equity decline.
Trading Days: Calculates the duration of active trades.
Profit/Day (%): Evaluates daily returns.
The performance table also shows average cycle duration and utilization of available capital.

[3Commas] DCA Bot TesterDCA Bot Tester
🔷What it does: A tool designed to simulate the behavior of a Dollar Cost Averaging (DCA) strategy based on input signals from a source indicator. Additionally, it enables you to send activation signals to 3Commas Bots via TradingView webhooks.
🔷Who is it for: This tool is ideal for those who want a visual representation and strategy report of how a DCA Bot would perform under specific conditions. By adjusting the parameters, you can assess whether the strategy aligns with your risk/reward expectations before implementation, helping you save time and protect your capital.
🔷How does it work: The tool leverages a pyramiding function to simulate price averaging, mimicking how a DCA Bot operates. It calculates volume-based averaging and, upon reaching the target, closes the positions. Conversely, if the target isn't reached, a Stop Loss is triggered, potentially resulting in significant losses if improperly configured.
🔷Why It’s Unique
Easy visualization of DCA Bot entry and exit points according to user preferences.
DCA Bot Summary table same as the one shown in the new 3Commas interface.
Use plots from other indicators as Entry Trigger Source, with a small modification of the code.
Option to Review message format before sending Signals to 3Commas. Compatibility with Multi-Pair, and futures contract pairs.
Option to filter signals by session and day according to the user’s timezone.
👉 Before continuing with the explanation of the tool, please take a few minutes to read this information, paying special attention to the risks of using DCA strategies.
DCA Bot: What is it, how does it work, and what are its advantages and risks?
A DCA Bot is an automated tool designed to simplify and optimize your trading operations, particularly in cryptocurrencies. Based on the concept of Dollar Cost Averaging (DCA) , this bot implements scaled strategies that allow you to distribute your investments intelligently. The key lies in dividing your capital into multiple orders, known as base orders and safety orders, which are executed at different price levels depending on market conditions.
These bots are highly customizable, meaning you can adapt them to your goals and trading style, whether you're operating Long (expecting a price increase) or Short (expecting a price decrease). Their primary purpose is to reduce the impact of entries that move against the estimated direction and ensure you achieve a more favorable average price.
🔸 Key Features of DCA Bots
Customizable configuration: DCA bots allow you to adjust the size of your initial investment, the number of safety orders, and the price levels at which these orders execute. These orders can be equal or incremental, depending on your risk tolerance.
Scaled safety orders: If the asset's price moves against your position, the bot executes safety orders at strategic levels to average your entry price and increase your chances of closing in profit.
Automatic Take Profit: When the predefined profit level is reached, the bot closes the position, ensuring net gains by averaging all entries made using the DCA strategy.
Stop Loss option: To protect your capital, you can set a stop loss level that limits losses if the market moves drastically against your position.
Flexibility: Bots can integrate with 3Commas technical indicators or external signals from TradingView, allowing you to trade in any trend, whether bullish or bearish.
Support for multiple assets: You can trade cryptocurrency pairs and exchanges compatible with 3Commas, offering a wide range of possibilities to diversify your strategies.
✅ Advantages of DCA Bots
Time-saving automation: DCA bots eliminate the need for constant market monitoring, executing your trades automatically and efficiently based on predefined settings.
Favorable averages in volatile markets: By averaging your entries, the bot can offer more competitive prices even under adverse market conditions. This increases your chances of recovering a position and closing it profitably.
Advanced capital management: With customizable settings, you can adjust the size of base and safety orders to optimize capital usage and reduce risk.
Additional protection: The ability to set a stop loss ensures your losses are limited, safeguarding your capital in extreme scenarios.
⚠️ Risks of Using a DCA Bot
Requires significant capital: Safety orders can accumulate quickly if the price moves against your position. This issue is compounded if increasing amounts are used for safety orders, which can immobilize large portions of capital in adverse markets.
Markets lacking clear direction: During consolidation periods or erratic movements, the bot may generate unrealized losses and make position recovery difficult.
Opportunity cost: Investing in an asset that doesn't show favorable behavior can prevent you from seizing opportunities in other markets.
Emotional pressure: Large investments in advanced stages of the DCA strategy can cause stress, especially if an asset takes too long to reach your take profit level.
Dependence on market recovery: DCA assumes that the price will eventually move in your favor, which does not always happen, especially in assets without solid fundamentals.
📖 Key Considerations for Effectively Using a DCA Bot
Use small amounts for your base and safety orders: Setting small initial orders not only limits capital usage but also allows you to manage multiple bots simultaneously, maximizing portfolio diversification.
Capital management: Define a clear budget and never risk more than you are willing to lose. This is essential for maintaining sustainable operations.
Select assets with strong fundamentals: Apply DCA to assets you understand and that have solid fundamentals and a proven historical growth record. Additionally, analyze each cryptocurrency's fundamentals: What problem does it solve? Does it have a clear use case? Is it viable in the long term? These questions will help you make more informed decisions.
Diversification: Do not concentrate all your capital on a single asset or strategy. Spread your risk across multiple bots or assets.
Monitor regularly: While bots are automated and eliminate the need to monitor the market constantly, it is essential to monitor the bots themselves to ensure they are performing as expected. This includes reviewing their performance and making adjustments if market conditions change. Remember, the goal is to automate trades, but active bot management is crucial to avoid surprises.
A DCA Bot is a powerful tool for traders looking to automate their strategies and reduce the impact of market fluctuations. However, like any tool, its success depends on how it is configured and used. By applying solid capital management principles, carefully selecting assets, and using small amounts in your orders, you can maximize its potential and minimize risks.
🔷FEATURES & HOW TO USE
🔸Strategy: Here you must select the type of signal you are going to analyze and send signals to the DCA Bot, either Long for buy signals or Short for sell signals. This must match the Bot created in 3Commas.
🔸Add a Source Indicator for Entry Triggers
Tradingview allows us to use indicator plots as a source in other indicators, we will use this functionality so that the buy or sell signals of an indicator are processed by the DCA Bot Tester.
In this EXAMPLE we will use a simple strategy that uses a Donchian Channel (DC) and an Exponential Moving Average (EMA).
Trigger to buy or long signal will be when: the price closes above the previous upper level and the average of the upper and lower level (basis) is greater than the EMA.
Trigger sell or short signal will be when: the price closes below the previous lower level and the average of the upper and lower level (basis) is less than the EMA.
trigger_buy = ta.crossover (close,upper ) and basis > ema and barstate.isconfirmed
trigger_sell = ta.crossunder(close,lower ) and basis < ema and barstate.isconfirmed
Then we create the plots that will be used as input source in the DCA Bot Tester indicator.
When a buy condition is given the plot "🟢 Trigger Buy" will have a value of 1 otherwise it will remain at 0.
When a sell condition is given the plot "🔴 Trigger Sell" will have a value of -1 otherwise it will remain at 0.
plot(trigger_buy ? 1 : 0 , '🟢 Trigger Buy' , color = na, display = display.data_window)
plot(trigger_sell? -1 : 0 , '🔴 Trigger Sell', color = na, display = display.data_window)
Here you have the complete code so you can use it and do tests. Basically you just have to define the buy or sell conditions of your preferred indicator or strategy and then create the plots with the same format that will be used in DCA Bot Tester.
//@version=6
indicator(title="Simple Strategy Example", overlay= false)
// Indicator and Signal Triggers
length = input.int(10, title = "DC Length" , display = display.none)
length_ema = input.int(50, title = "EMA Length", display = display.none)
lower = ta.lowest (length)
upper = ta.highest(length)
ema = ta.ema (close, length_ema)
basis = math.avg (upper, lower)
plot(basis, "Basis", color = color.orange, display = display.all-display.status_line)
plot(upper, "Upper", color = color.blue , display = display.all-display.status_line)
plot(lower, "Lower", color = color.blue , display = display.all-display.status_line)
plot(ema , "EMA" , color = color.red , display = display.all-display.status_line)
candlecol = open < close ? color.teal : color.red
plotcandle(open, high, low, close, title='Candles', color = candlecol, wickcolor = candlecol, bordercolor = candlecol, display = display.pane)
trigger_buy = ta.crossover (close,upper ) and basis > ema and barstate.isconfirmed
trigger_sell = ta.crossunder(close,lower ) and basis < ema and barstate.isconfirmed
plotshape(trigger_buy ?close:na, title="Label Buy" , style=shape.labelup , location= location.belowbar, color=color.green, text="B", textcolor=color.white, display=display.pane)
plotshape(trigger_sell?close:na, title="Label Sell", style=shape.labeldown, location= location.abovebar, color=color.red , text="S", textcolor=color.white, display=display.pane)
// ――――――――――――――――――――――――――――――――――――――――――――――――――――――――――――――――――――――――――――――――――――――――――――――――――――――――――――――――――――
// 👇 Plots to be used in the DCA Bot Indicator as source triggers.
// ――――――――――――――――――――――――――――――――――――――――――――――――――――――――――――――――――――――――――――――――――――――――――――――――――――――――――――――――――――
plot(trigger_buy ? 1 : 0 , '🟢 Trigger Buy' , color = na, display = display.data_window)
plot(trigger_sell? -1 : 0 , '🔴 Trigger Sell', color = na, display = display.data_window)
To use the example code
Open the Pine Editor, paste the code and then click Add to chart.
Then in the Plot Entry Trigger Source option, we will select 🟢 Trigger Buy, as the plot that will give us the buy signals when it is worth 1, otherwise for the sell signals you must change the value to -1 in the Plot Entry Trigger Value and remember to change the strategy mode to Short.
🔸DCA Settings: Here you need to configure the DCA values of the strategy, you can see the meaning of each value in the Settings Section. Once you are satisfied with the tests configure the 3Commas DCA Bot with the same values so that the Summary Table matches the 3Commas Table. Pay close attention to the Total Volume that the Bot will use, according to the amount of Safety Orders you are going to execute, and that all the values in the table adapt to your risk tolerance.
🔸DCA Bot Deal Start: Once you create the Bot in 3Commas with the same settings it will give you a Deal Start Message, you must copy and paste it in this section, verify that it is the same in the summary table, this is used to be sent through tradingview alerts to the Bot and it can process the signals.
🔸DCA Bot Multi-Pair: A Multi-Pair Bot allows you to manage several pairs with a single bot, but you must specify which pair it will run on. You must activate it if you want to use the signals in a DCA Bot Multi-pair. In the text box you must enter (using the 3Commas format) the symbol for each pair before you create the alert so that the bot understands which pair to work on.
In the following image we would be configuring the indicator to send a signal to activate the bot in the BTCUSDT pair using the given format it would be USDT_BTC, but if we wanted to send a signal in another pair we must change the pair in the chart and also in the configuration, an example with ETHUSDT would be USDT_ETH. After this we could create the alert, and the Mult-Pair Bot would detect it correctly.
🔸Strategy Tester Filters: This is useful if you want to test the strategy's result on a certain time window, the indicator will only enter this range. If disabled it will use all historical data available on the chart. If you are going to use the tool to send signals, make sure to disable the Use Custom Test Period. If you want the entries to only run at a certain time and day, in that case make sure that the timezone matches the one you are using in the chart.
🔸Properties: Adjust your initial capital and exchange commission appropriately to achieve realistic results.
🔸Create alerts to trigger the DCA Bot
Check that the message is the same as the one indicated by the DCA Bot.
In the case of Multi-Pair, enable the option to add the symbol with the correct format.
When creating an alert, select Any alert() function call.
Enter the any name of the alert.
Open the Notifications tab and enable Webhook URL
Paste Webhook URL provided by 3Commas looking in the section How to use TradingView custom signals.
Done, alerts will be sent with the correct format automatically to 3Commas.
🔷 INDICATOR SETTINGS
🔸3Commas DCA Bot Settings
Strategy: Select the direction of the strategy to test Long or Short, this must be the same as the Bot created in 3Commas, so that the signals are processed properly.
DCA Bot Deal Start: Copy and paste the message for the deal start signal of the DCA Bot you created in 3Commas. This is the message that will be sent with the alert to the Bot, you must verify that it is the same as the 3Commas bot so that it can process properly so that it executes and starts the trade.
DCA Bot Multi-Pair: A Multi-Pair Bot allows you to manage several pairs with a single bot, but you must specify which pair it will run on.
DCA Bot Summary Table: Here you can activate the display of table as well as change the size, position, text color and background color.
🔸Source Indicator Settings
Plot Entry Trigger Source: Select a Plot for Entries of the Source Indicator. This refers to the Long or Short entry signal that the indicator will use as BO (Base Order).
Plot Entry Trigger Value: Value of the Source Indicator to Deal Start Condition Trigger. The default value is 1, this means that when a signal is given for example Long in the source indicator, we will use 1 or for Short -1 if there is no signal it will be 0 so it will not execute any entry, please review the example code and adjust the indicator you are going to use in the same way.
🔸DCA Settings
Base Order: The Base Order is the first order the bot will create when starting a new deal.
Safety Order: Enter the amount of funds your safety orders will use to average the cost of the asset being traded.Safety orders are also known as Dollar Cost Averaging and help when prices move in the opposite direction to your bot's take profit target.
Safety Orders Deviation %: Enter the percentage difference in price to create the first Safety Order. All Safety Orders are calculated from the price the initial Base Order was filled on the exchange account.
Safety Orders Max Count: This is the total number of Safety Orders the bot is allowed to use per deal that is opened. All Safety Orders created by the bot are placed as Limit Orders on the exchange's order book.
Safety Orders Volume Scale: The Safety Order Volume Scale is used to multiply the amount of funds used by the last Safety Order that was created. Using a larger amount of funds for Safety Orders allows your bot to be more aggressive at Dollar Cost Averaging the price of the asset being traded.
Safety Orders Step Scale: The Safety Order Step Scale is used to multiply the Price Deviation percentage used by the last Safety Order placed on the exchange account. Using a larger value here will reduce the amount of Safety Orders your bot will require to cover a larger move in price in the opposite direction to the active deal's take profit target.
Take Profit %: The Take Profit section offers tools for flexible management of target parameters: automatic profit upon reaching one or more target levels in percentage.
Stop Loss % | Use SL: To enable Stop Loss, please check the "Use SL" box. This is the percentage that price needs to move in the opposite direction to close the deal at a loss. This must be greater than the sum of the deviations from the safety orders.
🔸Strategy Tester Filters
Use Custom Test Period: When enabled signals only works in the selected time window.. If disabled it will use all historical data available on the chart.
Test Start and End: Once the Custom Test Period is enabled, here you select the start and end date that you want to analyze.
Session Filter | Days | Background: Here you can choose a time zone in which signals will be sent or your strategy will be tested, as well as the days and a background of it. It is important that you use the same timezone as your chart so that it matches.
👨🏻💻💭 If this tool helps you, don’t forget to give it a boost! Feel free to share in the comments how you're using it or if you have any questions.
_________________________________________________________________
The information and publications within the 3Commas TradingView account are not meant to be and do not constitute financial, investment, trading, or other types of advice or recommendations supplied or endorsed by 3Commas and any of the parties acting on behalf of 3Commas, including its employees, contractors, ambassadors, etc.

DCA Valuation & Unrealized GainsThis Pine Script for TradingView calculates and visualizes the relationship between a Dollar Cost Average (DCA) price and the All-Time High (ATH) price for over 50 different cryptocurrencies. Here's what it does:
1. Inputs for DCA Prices:
- Users can manually input DCA prices for specific cryptocurrencies (e.g., BTC, ETH, BNB).
2. Dynamic ATH Calculation:
- Dynamically calculates the ATH price for the current asset using the highest price in the chart's loaded data and persists this value across bars.
3. Percentage Change from DCA to ATH:
- Computes the percentage gain from the DCA price to the ATH price.
4. Visualizations:
- Draws a line at the DCA price and the ATH price, both extended to the right.
- Adds an arrow pointing from the DCA price to the ATH, offset by 10 bars into the future.
- Displays labels for:
- The percentage gain from DCA to ATH.
- "No DCA Configured" if no valid DCA price is set for the asset.
5. Color Coding:
- Labels and arrows are color-coded to indicate positive or negative percentage changes:
- Green for gains.
- Red for losses.
6. Adaptability:
- The script dynamically adjusts to the current asset based on its ticker and uses the corresponding DCA price.
This functionality provides traders with clear insights into their investment's performance relative to its ATH, aiding in decision-making.
-----
To add a new asset to the script:
1. Define the DCA Input: Add a new input for the asset's DCA price using the `input.float` function. For example:
dcaPriceNEW = input.float(title="NEW DCA Price", defval=0.1, tooltip="Set the DCA price for NEW")
2. Add the Asset Logic: Include a conditional check for the new asset in the ticker matching logic:
if str.contains(currentAsset, "NEW") and dcaPriceNEW != 0
dcaPrice := dcaPriceNEW
Where NEW is the ticker symbol of the asset you're adding.
NOTE: SOLO had to be put before SOL because otherwise the indicator was pulling the DCA price from SOL even on the SOLO chart. If you have a similar issue, try that fix.
Adding an asset requires only these two changes. Once done, the script dynamically incorporates the new asset into its calculations and visualizations.
Universal Valuation System Overview 🔍
The Universal Valuation System (UVS) is an advanced valuation-focused indicator that provides insights into whether an asset is statistically overvalued or undervalued, helping traders understand where an asset sits within its historical value range. Unlike trend indicators, UVS emphasizes value analysis through a unique combination of performance ratios and statistical metrics, synthesizing this data into an overall Z-score. This score reflects the asset’s position within a typical normal distribution curve, allowing traders to make data-driven decisions based on historical valuation patterns.
Normal Distribution: A Statistical Foundation for Valuation 📊
The UVS leverages the normal distribution model as its core statistical framework. In a normal distribution, values tend to cluster around a central mean, with predictable probabilities for deviation. In financial markets, this means that most price or valuation levels hover around an average range, while extreme highs or lows are less frequent.
Under normal distribution:
68% of values lie within one standard deviation of the mean.
95% of values lie within two standard deviations.
99.7% of values lie within three standard deviations.
Using Z-scores, UVS calculates where current valuation metrics fall relative to this distribution, identifying overvalued (above-average) or undervalued (below-average) zones. This helps traders interpret an asset’s relative value, showing whether it is more likely to revert toward its mean or is experiencing an exceptional deviation.
Key Components and Ratios in UVS 🔀
UVS includes a range of valuation metrics that work together to determine the Z-score:
Sharpe Ratio: Measures return relative to risk, offering insight into the quality of returns.
Sortino Ratio: Focuses on downside deviation, helping gauge negative returns’ impact.
Omega Ratio: Assesses the likelihood of gains versus losses, providing a risk-adjusted performance measure.
Crosby Ratio: Examines volatility patterns, adding dimension to the valuation signal.
VWAP (Volume-Weighted Average Price) Z-Score: Assesses price relative to volume, highlighting valuation when volume supports price movements.
Price ROC Z-Score: Uses the rate of price change to give a volatility-adjusted price movement signal.
By averaging these ratios, UVS forms a composite Z-score representing an overall valuation signal. This Z-score directly reflects the asset’s position within its historical distribution, indicating whether it’s in a typical, overbought, or oversold range.
DCA (Dollar-Cost Averaging) Application with UVS 💵
The UVS provides powerful insights for those using Dollar-Cost Averaging (DCA) by signaling periods when an asset may be overvalued or undervalued relative to its historical distribution. This model-based approach helps traders strategically adjust their DCA timing:
Overvalued (Overbought) Zones:
When the Z-score indicates that an asset is in an overbought zone (typically above +2 standard deviations), DCA buyers may choose to reduce purchases or pause, as this zone suggests the asset is currently at a premium relative to its historical norms.
Undervalued (Oversold) Zones:
In undervalued regions (typically below -2 standard deviations), the UVS suggests a favorable accumulation point for DCA. These periods allow traders to buy at below-average valuations, optimizing their cost basis over time.
Valuation Zone Display and Accessibility 🌈
UVS includes several user-friendly display options, helping traders interpret its signals easily:
Composite Zone Highlighting: Displays overbought and oversold zones with color gradients, clearly visualizing statistical extremes.
Ratio Breakdown: Allows users to view individual Z-scores for each component, understanding the specific contributions to the overall valuation signal.
Color Blindness Mode: Offers multiple color settings to ensure clear interpretation across different visual needs.
Summary: Structured Value Analysis for Informed DCA Decisions
UVS is designed to be a reliable tool for traders looking to anchor their DCA and valuation-based strategies in statistical reality. By identifying valuation zones within a normal distribution framework, UVS enables a disciplined approach to asset accumulation based on relative value rather than price trends.
Important Note: UVS does not predict future performance. It provides a statistical view of historical valuation, which should be supplemented with additional analysis and risk management practices. Past patterns do not guarantee future results.
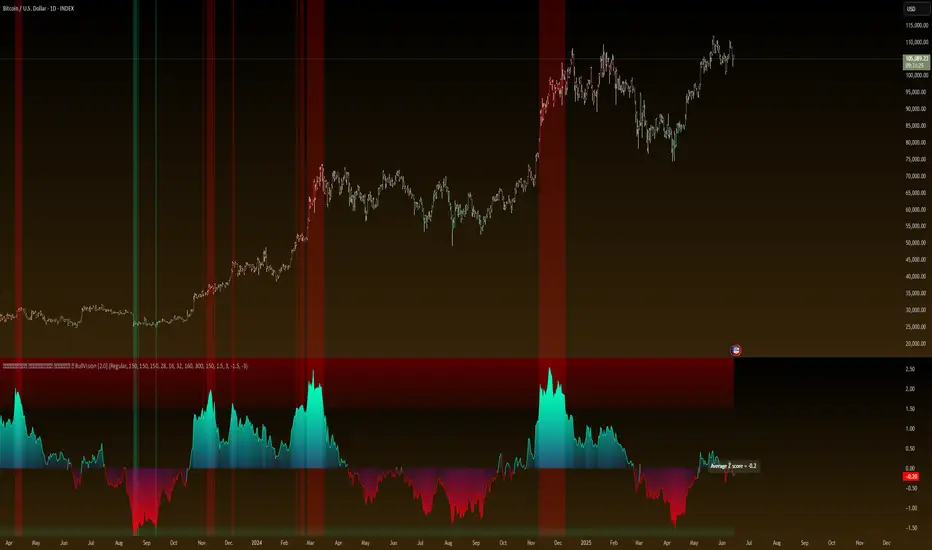
Dollar Cost Averaging (YavuzAkbay)The Dollar Cost Averaging (DCA) indicator is designed to support long-term investors following a Dollar Cost Averaging strategy. The core aim of this tool is to provide insights into overbought and oversold levels, assisting investors in managing buy and sell decisions with a clear visual cue system. Specifically developed for use in trending or fluctuating markets, this indicator leverages support and resistance levels to give structure to investors' buying strategies. Here’s a detailed breakdown of the indicator’s key features and intended usage:
Key Features and Color Coding
Overbought/Oversold Detection:
The indicator shades candles from light green to dark green when an asset becomes increasingly overbought. Dark green signals indicate a peak, where the asset is overbought, suggesting a potential opportunity to take partial profits.
Conversely, candles turn from light red to dark red when the market is oversold. Dark red signifies a heavily oversold condition, marking an ideal buying window for initiating or adding to a position. This color scheme provides a quick visual reference for investors to manage entries and exits effectively.
Support and Resistance Levels:
To address the risk of assets falling further after an overbought signal, the DCA indicator dynamically calculates support and resistance levels. These levels guide investors on key price areas to watch for potential price reversals, allowing them to make more informed buying or selling decisions.
Support levels help investors assess whether they should divide their capital across multiple buy orders, starting at the current oversold zone and extending to anticipated support zones for maximum flexibility.
Usage Methodology
This indicator is intended for Dollar Cost Averaging, a method where investors gradually add to their position rather than entering all at once. Here’s how it complements the DCA approach:
Buy at Oversold Levels: When the indicator shows a dark red candle, it signals that the asset is oversold, marking an optimal entry point. The presence of support levels can help investors determine if they should fully invest their intended amount or stagger buys at potential lower levels.
Sell at Overbought Levels: When the indicator transitions to dark green, it suggests that the asset is overbought. This is an ideal time to consider selling a portion of holdings to realize gains. The resistance levels, marked by the indicator, offer guidance on where the price may encounter selling pressure, aiding investors in planning partial exits.
Customizable Settings
The DCA indicator offers several user-adjustable parameters:
Pivot Frequency and Source: Define the pivot point frequency and the source (candle wick or body) for more tailored support/resistance detection.
Maximum Pivot Points: Set the maximum number of pivot points to be used in support/resistance calculations, providing flexibility in adapting to different market structures.
Channel Width and Line Width: Adjust the width of the channel for support/resistance levels and the thickness of the lines for easier visual tracking.
Color Intensities for Overbought/Oversold Levels: Customize the shading intensity for each overbought and oversold level to align with your trading preferences.
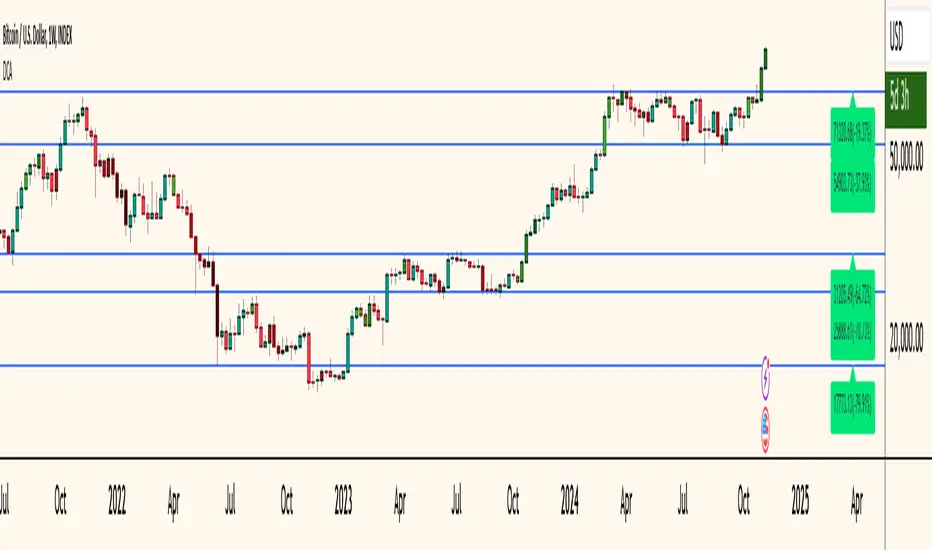
Fractional Accumulation Distribution Strategy🔹 INTRODUCTION:
As traders and investors, we often find ourselves searching for ways to maximize our market positioning—trying to capture the best price, manage risk, and adapt to ever-changing volatility. Through years of working with a variety of traders and investors, a common theme emerged: the most successful market participants were those who accumulated positions strategically over time, rather than relying on one-off, rigid entry points. However, even the best of them struggled to consistently time their entries and exits for optimal results.
That's why I created the Fractional Accumulation/Distribution Strategy (FADS)—an adaptable solution designed to dynamically adjust position sizing and entry points based on changing market conditions, enabling both passive and active market participants to optimize their approach.
The FADS trading strategy combines volatility-based trend detection and adaptive position scaling to maximize profitability across varied market conditions. By using the price ranges from higher timeframes, FADS pinpoints extreme demand and supply zones with a high statistical probability of reversal, making it effective in both high and low volatility environments. By applying adjustable threshold settings, users can focus on meaningful price movements to reduce unnecessary trades. Adaptive position scaling further enhances this approach by adjusting position sizes based on entry level distances, allowing for strategic position building that balances risk and reward in uncertain markets. This systematic scaling begins with smaller positions, expanding as the trend solidifies, creating a refined, robust trading experience.
🔹 FEATURES:
Multi-Timeframe Volatility-Based Trend Detection
Accumulation/Distribution Level Filter
Customizable Period for Highest/Lowest Prices Capture
Adjustable Sensitivity & Frequency in Positioning
Broad control settings of Strategy
Adaptive Position Scaling
🔹 SETTINGS:
Volatility : Determines trading range based on market volatility . Highest range value number of periods.
Factor : Adjusts the width of the Accumulation & Distribution bands separately. The Level Filter feature offers customizable triggering bands, allowing users to fine-tune the initiation point for the Accumulation/Distribution sequence. This flexibility enables traders to align entries more precisely with market conditions, setting optimal thresholds for initiating trade chains, whether in accumulating positions during uptrends or distributing in downtrends.
Lowest : Choose the price source (e.g., Close, Low). Number of bars considered when determining the lowest price level. Selecting the checkbox generate a signal when the price crosses below the previous lowest value for calculating the lowest value used for trade signals.
Highest : Choose the price source (e.g., Close, High). Number of bars considered when determining the highest price levels. Selecting the checkbox generate a signal when the price crosses above the previous highest value for calculating the highest value used for trade signals.
Accumulation Spread : Adjusts the buying frequency sensitivity by setting the distance between entries based on personal risk tolerance. Larger values for less frequent buys; smaller values for more frequent buys.
Distribution Spread : Adjusts the selling frequency sensitivity by setting the distance between exits based on reward preference. Larger values for less frequent sells; smaller values for more frequent sells.
Percentage of Capital Allocation : Sets the portion of total capital used for the initial trade in a strategy. It sets the scale for subsequent trades during accumulation phase.
🔹 APPLICATIONS:
❖ Accumulation and Distribution Phases
Early entries are avoided by initiating accumulation only after a trend reversal is confirmed and price breaks below long-term range.
Position sizes are determined by the distance between consecutive trades, smaller distance results in smaller position sizes and vice versa.
Average position cost is reduced by accumulating larger positions at the lower prices, potentially resulting in improved profitability.
Early exits are avoided by initiating distribution only after trend reversal is confirmed and price breaks above long-term range.
The pace of distribution can be tracked by the violet line that represents average positions during distribution phase
❖ Use Cases (Different than default setting input is used for illustration purposes)
If the starting point of accumulation starts too high for the risk preference, Accumulation Level Filter can be lowered by increasing the 🟢 threshold Factor.
If the starting point of distribution is too low for the reward preference, the Distribution Level Filter can be raised by increasing the 🔴 threshold Factor.
In lower timeframes, positions during the accumulation phase could be purchased at higher levels relative to prior entry positions. To optimize for this, consider extending the period used to capture the lowest prices. Similarly, during the distribution phase, increasing the period for identifying higher prices can improve accuracy.
🔹 Strategy Properties:
Adjusting properties within the script settings is recommended to align with specific accounts and trading platforms, ensuring realistic strategy results.
Balance (default): $100,000
Initial Order Size: 1% of the default balance
Commission: 0.1%
Slippage: 5 Ticks
Backtesting: Backtested using TradingView’s built-in strategy testing tool with default commission rates of 0.1% and slippage of 5 ticks. It reflects average market conditions for Apple Inc. (APPL) on 1-hour timeframe
Disclaimers: Commission and slippage varies with market conditions and brokerage policies. The assumed value may not represent all trading environments.
PAST PERFORMANCE DOESN’T GUARANTEE FUTURE RESULTS!
Disclaimer: Please remember that past performance may not be indicative of future results. Due to various factors, including changing market conditions, the strategy may no longer perform as well as in historical backtesting. This post and the script don’t provide any financial advice.
This invite-only script is being published as part of my commitment to developing tools that align with TradingView’s community standards. Access requests will be reviewed carefully after the script passes TradingView's moderation process.

Universal Trend and Valuation System [QuantAlgo]Universal Trend and Valuation System 📊🧬
The Universal Trend and Valuation System by QuantAlgo is an advanced indicator designed to assess asset valuation and trends across various timeframes and asset classes. This system integrates multiple advanced statistical indicators and techniques with Z-score calculations to help traders and investors identify overbought/sell and oversold/buy signals. By evaluating valuation and trend strength together, this tool empowers users to make data-driven decisions, whether they aim to follow trends, accumulate long-term positions, or identify turning points in mean-reverting markets.
💫 Conceptual Foundation and Innovation
The Universal Trend and Valuation System by QuantAlgo provides a unique framework for assessing market valuation and trend dynamics through a blend of Z-score analysis and trend-following algorithm. Unlike traditional indicators that only reflect price direction, this system incorporates multi-layered data to reveal the relative value of an asset, helping users determine whether it’s overvalued, undervalued, or approaching a trend reversal. By combining high quality trend-following tools, such as Dynamic Score Supertrend, DEMA RSI, and EWMA, it evaluates trend stability and momentum quality, while Z-scores of performance ratios like Sharpe, Sortino, and Omega standardize deviations from historical trends, enabling traders and investors to spot extreme conditions. This dual approach allows users to better identify accumulation (undervaluation) and distribution (overvaluation) phases, enhancing strategies like Dollar Cost Averaging (DCA) and overall timing for entries and exits.
📊 Technical Composition and Calculation
The Universal Trend-Following Valuation System is composed of several trend-following and valuation indicators that create a dynamic dual scoring model:
Risk-Adjusted Ratios (Sharpe, Sortino, Omega): These ratios assess trend quality by analyzing an asset’s risk-adjusted performance. Sharpe and Sortino provide insight into trend consistency and risk/reward, while Omega evaluates profitability potential, helping traders and investors assess how favorable a trend or an asset is relative to its associated risk.
Dynamic Z-Scores: Z-scores are applied to various metrics like Price, RSI, and RoC, helping to identify statistical deviations from the mean, which indicate potential extremes in valuation. By combining these Z-scores, the system produces a cumulative score that highlights when an asset may be overbought or oversold.
Aggregated Trend-Following Indicators: The model consolidates multiple high quality indicators to highlight probable trend shifts. This helps confirm the direction and strength of market moves, allowing users to spot reversals or entry points with greater clarity.
📈 Key Indicators and Features
The Universal Trend and Valuation System combines various technical and statistical tools to deliver a well-rounded analysis of market trends and valuation:
The indicator utilizes trend-following indicators like RSI with DEMA smoothing and Dynamic Score Supertrend to minimize market noise, providing clearer and more stable trend signals. Sharpe, Sortino, and Omega ratios are calculated to assess risk-adjusted performance and volatility, adding a layer of analysis for evaluating trend quality. Z-scores are applied to these ratios, as well as Price and Rate of Change (RoC), to detect deviations from historical trends, highlighting extreme valuation levels.
The system also incorporates multi-layered visualization with gradient color coding to signal valuation states across different market conditions. These adaptive visual cues, combined with threshold-based alerts for overbought and oversold zones, help traders and investors track probable trend reversals or continuations and identify accumulation or distribution zones, adding reliability to both trend-following and mean-reversion strategies.
⚡️ Practical Applications and Examples
✅ Add the Indicator: Add the Universal Trend-Following Valuation System to your favourites and to your chart.
👀 Monitor Trend Shifts and Valuation Levels: Watch the average Z score, trend probability state and gradient colors to identify overbought and oversold conditions. During undervaluation, consider using a DCA strategy to gradually accumulate positions (buy), while overvaluation may signal distribution or profit-taking phases (sell).
🔔 Set Alerts: Configure alerts for significant trend or valuation changes, ensuring you can act on market movements promptly, even when you’re not actively monitoring the charts.
🌟 Summary and Usage Tips
The Universal Trend and Valuation System by QuantAlgo is a highly adaptable tool, designed to support both trend-following and valuation analysis across different market environments. By combining valuation metrics with high quality trend-following indicators, it helps traders and investors identify the relative value of an asset based on historical norms, providing more reliable overbought/sell and oversold/buy signals. The tool’s flexibility across asset types and timeframes makes it ideal for both short-term trading and long-term investment strategies like DCA, allowing users to capture meaningful trends while minimizing noise.

Wolf DCA CalculatorThe Wolf DCA Calculator is a powerful and flexible indicator tailored for traders employing the Dollar Cost Averaging (DCA) strategy. This tool is invaluable for planning and visualizing multiple entry points for both long and short positions. It also provides a comprehensive analysis of potential profit and loss based on user-defined parameters, including leverage.
Features
Entry Price: Define the initial entry price for your trade.
Total Lot Size: Specify the total number of lots you intend to trade.
Percentage Difference: Set the fixed percentage difference between each DCA point.
Long Position: Toggle to switch between long and short positions.
Stop Loss Price: Set the price level at which you plan to exit the trade to minimize losses.
Take Profit Price: Set the price level at which you plan to exit the trade to secure profits.
Leverage: Apply leverage to your trade, which multiplies the potential profit and loss.
Number of DCA Points: Specify the number of DCA points to strategically plan your entries.
How to Use
1. Add the Indicator to Your Chart:
Search for "Wolf DCA Calculator" in the TradingView public library and add it to your chart.
2. Configure Inputs:
Entry Price: Set your initial trade entry price.
Total Lot Size: Enter the total number of lots you plan to trade.
Percentage Difference: Adjust this to set the interval between each DCA point.
Long Position: Use this toggle to choose between a long or short position.
Stop Loss Price: Input the price level at which you plan to exit the trade to minimize losses.
Take Profit Price: Input the price level at which you plan to exit the trade to secure profits.
Leverage: Set the leverage you are using for the trade.
Number of DCA Points: Specify the number of DCA points to plan your entries.
3. Analyze the Chart:
The indicator plots the DCA points on the chart using a stepline style for clear visualization.
It calculates the average entry point and displays the potential profit and loss based on the specified leverage.
Labels are added for each DCA point, showing the entry price and the lots allocated.
Horizontal lines mark the Stop Loss and Take Profit levels, with corresponding labels showing potential loss and profit.
Benefits
Visual Planning: Easily visualize multiple entry points and understand how they affect your average entry price.
Risk Management: Clearly see your Stop Loss and Take Profit levels and their impact on your trade.
Customizable: Adapt the indicator to your specific strategy with a wide range of customizable parameters.

MetaFOX DCA (ASAP-RSI-BB%B-TV)Welcome To ' MetaFOX DCA (ASAP-RSI-BB%B-TV) ' Indicator.
This is not a Buy/Sell signals indicator, this is an indicator to help you create your own strategy using a variety of technical analyzing options within the indicator settings with the ability to do DCA (Dollar Cost Average) with up to 100 safety orders.
It is important when backtesting to get a real results, but this is impossible, especially when the time frame is large, because we don't know the real price action inside each candle, as we don't know whether the price reached the high or low first. but what I can say is that I present to you a backtest results in the worst possible case, meaning that if the same chart is repeated during the next period and you traded for the same period and with the same settings, the real results will be either identical to the results in the indicator or better (not worst). There will be no other factors except the slippage in the price when executing orders in the real trading, So I created a feature for that to increase the accuracy rate of the results. For more information, read this description.
Below I will explain all the properties and settings of the indicator:
A) 'Buy Strategies' Section: Your choices of strategies to Start a new trade: (All the conditions works as (And) not (OR), You have to choose one at least and you can choose more than one).
- 'ASAP (New Candle)': Start a trade as soon as possible at the opening of a new candle after exiting the previous trade.
- 'RSI': Using RSI as a technical analysis condition to start a trade.
- 'BB %B': Using BB %B as a technical analysis condition to start a trade.
- 'TV': Using tradingview crypto screener as a technical analysis condition to start a trade.
B) 'Exit Strategies' Section: Your choices of strategies to Exit the trades: (All the conditions works as (And) not (OR), You can choose more than one, But if you don't want to use any of them you have to activate the 'Use TP:' at least).
- 'ASAP (New Candle)': Exit a trade as soon as possible at the opening of a new candle after opening the previous trade.
- 'RSI': Using RSI as a technical analysis condition to exit a trade.
- 'BB %B': Using BB %B as a technical analysis condition to exit a trade.
- 'TV': Using tradingview crypto screener as a technical analysis condition to exit a trade.
C) 'Main Settings' Section:
- 'Trading Fees %': The Exchange trading fees in percentage (trading Commission).
- 'Entry Price Slippage %': Since real trading differs from backtest calculations, while in backtest results are calculated based on the open price of the candle, but in real trading there is a slippage from the open price of the candle resulting from the supply and demand in the real time trading, so this feature is to determine the slippage Which you think it is appropriate, then the entry prices of the trades will calculated higher than the open price of the start candle by the percentage of slippage that you set. If you don't want to calculate any slippage, just set it to zero, but I don't recommend that if you want the most realistic results.
Note: If (open price + slippage) is higher than the high of the candle then don't worry, I've kept this in consideration.
- 'Use SL': Activate to use stop loss percentage.
- 'SL %': Stop loss percentage.
- 'SL settings options box':
'SL From Base Price': Calculate the SL from the base order price (from the trade first entry price).
'SL From Avg. Price': Calculate the SL from the average price in case you use safety orders.
'SL From Last SO.': Calculate the SL from the last (lowest) safety order deviation.
ex: If you choose 'SL From Avg. Price' and SL% is 5, then the SL will be lower than the average price by 5% (in this case your SL will be dynamic until the price reaches all the safety orders unlike the other two SL options).
Note: This indicator programmed to be compatible with '3COMMAS' platform, but I added more options that came to my mind.
'3COMMAS' DCA bots uses 'SL From Base Price'.
- 'Use TP': Activate to use take profit percentage.
- 'TP %': Take profit percentage.
- 'Pure TP,SL': This feature was created due to the differences in the method of calculations between API tools trading platforms:
If the feature is not activated and (for example) the TP is 5%, this means that the price must move upward by only 5%, but you will not achieve a net profit of 5% due to the trading fees. but If the feature is activated, this means that you will get a net profit of 5%, and this means that the price must move upward by (5% for the TP + the equivalent of trading fees). The same idea is applied to the SL.
Note: '3COMMAS' DCA bots uses activated 'Pure TP,SL'.
- 'SO. Price Deviation %': Determines the decline percentage for the first safety order from the trade start entry price.
- 'SO. Step Scale': Determines the deviation multiplier for the safety orders.
Note: I'm using the same method of calculations for SO. (safety orders) levels that '3COMMAS' platform is using. If there is any difference between the '3COMMAS' calculations and the platform that you are using, please let me know.
'3COMMAS' DCA bots minimum 'SO. Price Deviation %' is (0.21)
'3COMMAS' DCA bots minimum 'SO. Step Scale' is (0.1)
- 'SO. Volume Scale': Determines the base order size multiplier for the safety orders sizes.
ex: If you used 10$ to buy at the trade start (base order size) and your 'SO. Volume Scale' is 2, then the 1st SO. size will be 20, the 2nd SO. size will be 40 and so on.
- 'SO. Count': Determines the number of safety orders that you want. If you want to trade without safety orders set it to zero.
'3COMMAS' DCA bots minimum 'SO. Volume Scale' is (0.1)
- 'Exchange Min. Size': The exchange minimum size per trade, It's important to prevent you from setting the base order Size less than the exchange limit. It's also important for the backtest results calculations.
ex: If you setup your strategy settings and it led to a loss to the point that you can't trade any more due to insufficient funds and your base order size share from the strategy becomes less than the exchange minimum trade size, then the indicator will show you a warning and will show you the point where you stopped the trading (It works in compatible with the initial capital). I recommend to set it a little bit higher than the real exchange minimum trade size especially if you trade without safety orders to not stuck in the trade if you hit the stop loss
- 'BO. Size': The base order size (funds you use at the trade entry).
- 'Initial Capital': The total funds allocated for trading using your strategy settings, It can be more than what is required in the strategy to cover the deficit in case of a loss, but it should not exceed the funds that you actually have for trading using this strategy settings, It's important to prevent you from setting up a strategy which requires funds more than what you have. It's also has other important benefits (refer to 'Exchange Min. Size' for more information).
- 'Accumulative Results': This feature is also called re-invest profits & risk reduction. If it's not activated then you will use the same funds size in each new trade whether you are in profit or loss till the (initial capitals + net results) turns insufficient. If it's activated then you will reuse your profits and losses in each new trade.
ex: The feature is active and your first trade ended with a net profit of 1000$, the next trade will add the 1000$ to the trade funds size and it will be distributed as a percentage to the BO. & SO.s according to your strategy settings. The same idea in case of a loss, the trade funds size will be reduced.
D) 'RSI Strategy' Section:
- 'Buy': RSI technical condition to start a trade. Has no effect if you don't choose 'RSI' option in 'Buy Strategies'.
- 'Exit': RSI technical condition to exit a trade. Has no effect if you don't choose 'RSI' option in 'Exit Strategies'.
E) 'TV Strategy' Section:
- 'Buy': TradingView Crypto Screener technical condition to start a trade. Has no effect if you don't choose 'TV' option in 'Buy Strategies'.
- 'Exit': TradingView Crypto Screener technical condition to exit a trade. Has no effect if you don't choose 'TV' option in 'Exit Strategies'.
F) 'BB %B Strategy' Section:
- 'Buy': BB %B technical condition to start a trade. Has no effect if you don't choose 'BB %B' option in 'Buy Strategies'.
- 'Exit': BB %B technical condition to exit a trade. Has no effect if you don't choose 'BB %B' option in 'Exit Strategies'.
G) 'Plot' Section:
- 'Signals': Plots buy and exit signals.
- 'BO': Plots the trade entry price (base order price).
- 'AVG': Plots the trade average price.
- 'AVG options box': Your choice to plot the trade average price type:
'Avg. With Fees': The trade average price including the trading fees, If you exit the trade at this price the trade net profit will be 0.00
'Avg. Without Fees': The trade average price but not including the trading fees, If you exit the trade at this price the trade net profit will be a loss equivalent to the trading fees.
- 'TP': Plots the trade take profit price.
- 'SL': Plots the trade stop loss price.
- 'Last SO': Plots the trade last safety order that the price reached.
- 'Exit Price': Plots a mark on the trade exit price, It plots in 3 colors as below:
Red (Default): Trade exit at a loss.
Green (Default): Trade exit at a profit.
Yellow (Default): Trade exit at a profit but this is a special case where we have to calculate the profits before reaching the safety orders (if any) on that candle (compatible with the idea of getting strategy results at the worst case).
- 'Result Table': Plots your strategy result table. The net profit percentage shown is a percentage of the 'initial capital'.
- 'TA Values': Plots your used strategies Technical analysis values. (Green cells means valid condition).
- 'Help Table': Plots a table to help you discover 100 safety orders with its deviations and the total funds needed for your strategy settings. Deviations shown in red is impossible to use because its price is <= 0.00
- 'Portfolio Chart': Plots your Portfolio status during the entire trading period in addition to the highest and lowest level reached. It's important when evaluating any strategy not only to look at the final result, but also to look at the change in results over the entire trading period. Perhaps the results were worryingly negative at some point before they rose again and made a profit. This feature helps you to see the whole picture.
- 'Welcome Message': Plots a welcome message and showing you the idea behind this indicator.
- 'Green Net Profit %': It plots the 'Net Profit %' in the result table in green color if the result is equal to or above the value that you entered.
- 'Green Win Rate %': It plots the 'Win Rate %' in the result table in green color if the result is equal to or above the value that you entered.
- 'User Notes Area': An empty text area, Feel free to use this area to write your notes so you don't forget them.
The indicator will take care of you. In some cases, warning messages will appear for you. Read them carefully, as they mean that you have done an illogical error in the indicator settings. Also, the indicator will sometimes stop working for the same reason mentioned above. If that happens then click on the red (!) next to the indicator name and read the message to find out what illogical error you have done.
Please enjoy the indicator and let me know your thoughts in the comments below.

panpanXBT BTC Risk Metric OscillatorThis is the Bitcoin Risk Metric. Inspired by many power law analysts, this script assigns a risk value to the price of Bitcoin. The model uses regression of 'fair value' data to assign risk values and residual analysis to account for diminishing returns as time goes on. This indicator is for long-term investors looking to maximise their returns by highlighting periods of under and overvaluation for Bitcoin.
This is a companion script for panpanXBT BTC Risk Metric . Use this indicator in tandem to achieve the view shown in the chart above.
Please note, this indicator will only work on BTCUSD charts but will work on any timeframe.
DISCLAIMER: The product on offer presents a novel way to view the price history of Bitcoin. It should not be relied upon solely to inform financial decisions. What you do with the information is entirely up to you. Please thoroughly consider your decisions and consult many different sources to make sure you're making the most well-informed decision.
### How to Interpret
The risk scale goes from 0 to 100,
Blue - 0 being low risk, and
Red - 100 being high risk.
Low risk values represent periods of historical undervaluation, while high values represent overvaluation. These periods are marked by a colourscale from blue to red.
### Use Cases and Best Practice
A dynamic DCA strategy would work best with this indicator, whereby an amount of capital is deployed/retired on a regular basis. This amount deployed grows or shrinks depending on the proximity of the risk level to the extremes (0 and 100).
Let's say you have a maximum of $500 to deploy per month.
When risk is between 0 and 10, you could deploy the full $500.
When risk is between 10 and 20, you could deploy $400.
When risk is between 20 and 30, you could deploy $300.
When risk is between 30 and 40, you could deploy $200.
When risk is between 40 and 50, you could deploy $100.
Conversely, when risk is above 50, you could:
Sell 1/15th of your BTC stack when risk is between 50 and 60.
Sell 2/15th of your BTC stack when risk is between 60 and 70.
Sell 3/15th of your BTC stack when risk is between 70 and 80.
Sell 4/15th of your BTC stack when risk is between 80 and 90.
Sell 5/15th of your BTC stack when risk is between 90 and 100.
This framework allows the user to accumulate during periods of undervaluation and derisk during periods of overvaluation, capturing returns in the process.
In contrast, simply setting limit orders at 0 and 100 would yield the absolute maximum returns, however there is no guarantee price will reach these levels (see 2018 where the bear market bottomed out at 20 risk, or 2021 where price topped out at 97 risk).
### Caveats
"All models are wrong, some are useful"
No model is perfect. No model can predict exactly what price will do as there are too many factors at play that determine the outcome. We use models as a guide to make better-informed decisions, as opposed to shooting in the dark. This model is not a get rich quick scheme, but rather a tool to help inform decisions should you consider investing. This model serves to highlight price extremities, which could present opportune times to invest.
### Conclusion
This indicator aims to highlight periods of extreme values for Bitcoin, which may provide an edge in the market for long-term investors.
Thank you for your interest in this indicator. If you have any questions, recommendations or feedback, please leave a comment or drop me a message on TV or twitter. I aim to be as transparent as possible with this project, so please seek clarification if you are unsure about anything.
