Same high/low + DCA (only long)This is an update of the previous "same high/low" strategy. This strategy can be helpful for those who look for entrance price points after level retest based on the dollar cost averaging approach.
The retest of the level is defined by two candles with the same low.
4 entrance points were calculated based on volatility (not based on ATR though) and the weights were averaged in the middle of the volatility level.
As previously, stop loss is just one tick away from a level of support and take profit based on the ATR multiplier.
DCA

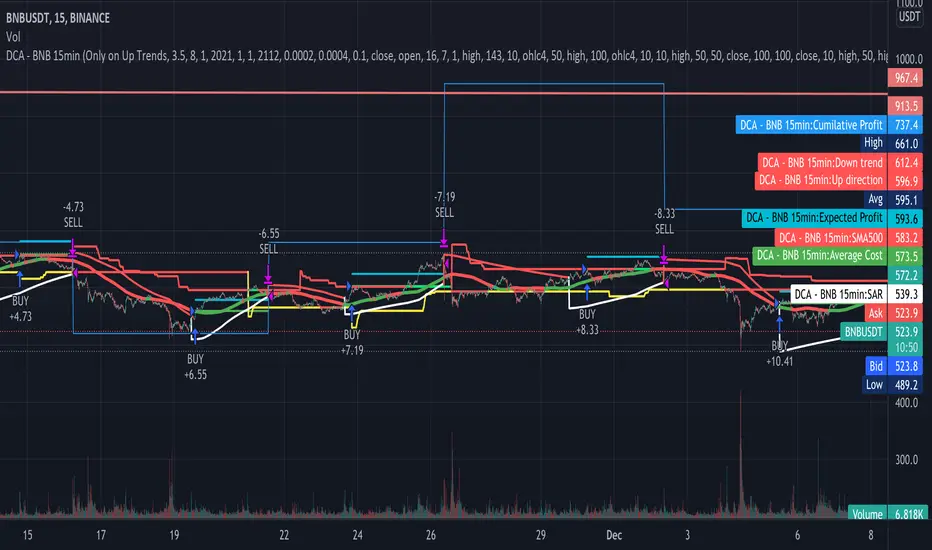
Buy / Sell alert indicator [Crypto_BCT]Hello everyone!
I bring to your attention a indicator to determine the point of buy and sell purchase.
It is based on oscillators and a moving average.
It can be used to work with bots, for example 3COMMAS DCA bot.
Signal Condition Settings:
ATR
The current candle is larger than the ATR for this period
EMA
The signal is necessarily below (for buy) and above (for sell) the EMA of the specified period
(Buy) RSI low
The RSI index is below this value
(Sell) RSI High
The RSI index is higher than this value
(Buy) MFI low
The MFI index is below this value
(Sell) MFI High
The MFI index is higher than this value
(Buy) CCI low
CCI index is below this value
(Sell) CCI High
The CCI index is higher than this value
(Buy) Lowest bar from
The closing of the current bar is lower than the closing of the bars back in this range
(Sell) Highest bar from
The closing of the current bar is higher than the closing of bars in this range
(Buy) Lowest EMA bar ago
During a given distance back, the EMA value only decreased
(Sell) Highest EMA bar ago
At a given distance back, the EMA value only increased
I hope it will be useful!

DCA RSI Add funds exit simulatorThis script helps with planning on how to exit DCA deals that are in the negative.
The following deal information is required
- Current average position price
- Funds invested
- Required take profit
Additional indicator settings are
- The date/time on which to start the simulator
- Minimum deviation % to start adding funds
- Expected bounceback from when funds are added
The RSI trigger
Adding funds is triggered when the selected RSI settings yield a value that is at or beyond the selected threshold.
How it works
The amount of funds needed are calculated based on the supplied settings, such that the new average price matches the expected bounceback.
It will also show if the exit strategy has failed to hit the TP (this happens when the RSI threshold is hit again)

Average Total Price From BottomThis is an indicator to help determine where the bottom of the market is currently based on the average close of the previous cycle. This is an idea from @Jay_DCA on YouTube and I thought it would be fun to code. Enjoy!
How to use:
Specify the date at which the bottom of the markets occurred. I added two extra cycle inputs for future usability. So, when the current bottom is found of this bull cycle, make sure to change the date in Bottom 3.

3RSI 3CCI BB 5orders DCA strategy+This strategy is just an attempt to find the indicator values for the trading bot service that I use (link in profile). Due to the use of the “request.security” function in the code, the indicators can be redrawn, but this is not important in history. The strategy used only 5 orders for the "DCA" - bot, located at the same distance in the price overlap range. I only use this strategy when trading in pairs against bitcoin.
Эта стратегия – просто попытка подобрать значения индикаторов для сервиса торговых ботов, который я использую (ссылка в профиле). Из-за использования в коде функции «request.security» возможна перерисовка индикаторов, но на истории это не важно. В стратегии использовано всего 5 ордеров для «DCA» - бота, находящихся на одинаковом расстоянии в диапазоне перекрытия цены. Я использую данную стратегию только при торговле в парах к биткоину.

Dollar cost averaging This is a testing startergy based on dollar cost averaging and sell on high points.
QaSH DCA Ichimoku Cloud
This powerful script takes the classic Ichimoku Cloud strategy and revitalizes it by allowing the user to make multiple DCA orders on each trade. Spreading your entry through DCA orders allows you to give the entry point room to breathe, and average down your position as the volatility momentarily pulls price against you. Both long and short positions are possible, each limited to a maximum of 5 DCA orders per trade.
When the Ichimoku cloud is showing bullish direction, only long trades will be allowed. During bearish direction, short trades will be allowed.
Two additional multi-timeframe EMA's can be added and used as filters for the long and short entries.
If you like you can use as little as one entry order per trade:
Or you can use up to a maximum of 5 DCA orders

Leonardo Fibonacci DCA StrategyThis strategy consists of the following elements and can all be set by the user.
1. Enter as the price drops.
1) Selection of multi-time frame.
- 30 minutes
- 60 minutes
- 90 minutes
- More than 120 minutes
2) Selection of Order Count
- Order Count == Long entry's qty
3) Selection of First / End indent price gap
It is DCA (Dollar Cost Averaging)
- A DCA strategy is the practice of investing into a currency at preset intervals to reduce the entry price of a position over time and mitigate volatility risk.
For example,
1) Entry Time Frame = 60 minutes
2) Order Count = 10
3) First indent price = 2 %
End indent price = 10 %
=> Starting from a 1% drop in the 60 minutes candle,
10time Long Entry(1%, 2%, 3%, 4%, 5%, 6%, 7%, 8%, 9%, 10%)
thereby getting a better average price for your position and greatly reducing risks from the consequences of volatility .
2. Target Price and Stop Loss
1) Target price : uses the Fibonacci ratio. You can also set the target ratio.
2) Stop Loss : Long entry close when the moving average line cross under the End indent price.
3) Close Deal time : Long entry close after a set period of time has passed since long entry.
You can easily find out what's related by changing the setting value after setting the strategy.
I hope it will help you. Thank you.

3Commas Visible DCA StrategyThis strategy consists of the following elements and can all be set by the user.
1. Entry by moving average cross.
1) Selection of moving average line.
- SMA(Simple Moving Average)
- EMA(Exponential Moving Average)
- HMA(Hull Moving Average)
2) Selection of Cross over / Cross under
2. Add Entry by DCA(Dollar Cost Averaging)
- A DCA strategy is the practice of investing into a currency at preset intervals to reduce the entry price of a position over time and mitigate volatility risk.
For example,
Base Order = 10 Dollar at Price 100%
Safety Order1 = 20 Dollar at Price 90%
Safety Order2 = 40 Dollar at Price 80%
Average Price => Price 80~90%
thereby getting a better average price for your position and greatly reducing risks from the consequences of volatility.
3. Target Price and Stop Loss.
1) Target Price : Realize profits at % set from the average unit price.
2) Stop Loss : Stop Loss % set from the last safety order.
You can easily find out what's related by changing the setting value after setting the strategy.
This strategy has the following Good characteristics.
1. It informs you of the assets required according to DCA settings.
If you are short of assets, a warning sign will appear.
2. Amount of assets invested in each long entry and long entry close.
3. Visibility of the lowest purchase price line and DCA purchase location according to DCA setting.
easily check the values set in the backtest.
I hope it will help you. Thank you.
3Commas DCA Backtester + TBO3Commas DCA bot users rejoice! Have you ever wanted to know how your 3Commas DCA bot would have performed with slightly different settings? Or a different deal start condition? Another safety trade? We've combined the logic of 3Commas DCA Bots with TradingView's powerful strategy backtester to FINALLY help 3Commas users backtest their bot settings.
There are several things to be aware of with this strategy:
There is no bot assistant in TradingView, so you'll have to enter in your funds for bot trading in the "Initial capital" section in the Properties tab of the settings.
Even though you can use simultaneous deals with this strategy, there is no way on TradingView to collectively backtest multiple trading pairs with a single instance of this strategy.
We have created all of the available deal start conditions natively available in 3Commas DCA Bots PLUS the TBO and its trigger symbols (Open Long, Close Long, Cross Up, Breakout, Open Short, Close Short, Cross Down, Breakdown). The strategy uses ASAP (as soon as possible) by default.
3Commas DCA Bots use a built-in AND logic for the deal start conditions, meaning that deals will only start when ALL deal start conditions are true. This logic is included in the strategy, however we also provided the option to use OR logic, which will trigger a deal if any of the selected deal start conditions have been met.
Use your own indicators by selecting the "external" option under deal start conditions.
Cooldown between deals cannot use seconds as this is a limitation in TradingView (the strategy will only run on the current timeframe you are viewing), so this has been changed to "next bar."
Customize your backtests in our look back section. Select a specific start and end date for your back test results.
Use the strategy to send alerts directly to your 3Commas bots by providing your bot ID numbers and your email token (found in the JSON code when viewing your bot's overall settings).
Some things to keep in mind while using the back tester:
Enable Buy & Hold Equity to compare your bot strategy and settings.
The back tester can't guarantee future results based on past performance.
Stop losses will result in poor performance. Take advantage of DCA strategy and use safety trades.
Settings for the strategy shown are:
Bot type: Long
Take Profit type: % Quote
Base order: 25
Safety order: 50
Deal Start Conditions:
Custom - OR
TBO Breakout
15m Strong Buy
1h Strong Buy
4h Strong Buy
Target Profit: 4
Max Active Safety Trades: 2
Price deviation in %: 8
Safety order volume scale: 2
Safety order step scale: 2
Simultaneous deals per same pair: 3
Lookback:
2020-05-11
9999-01-01

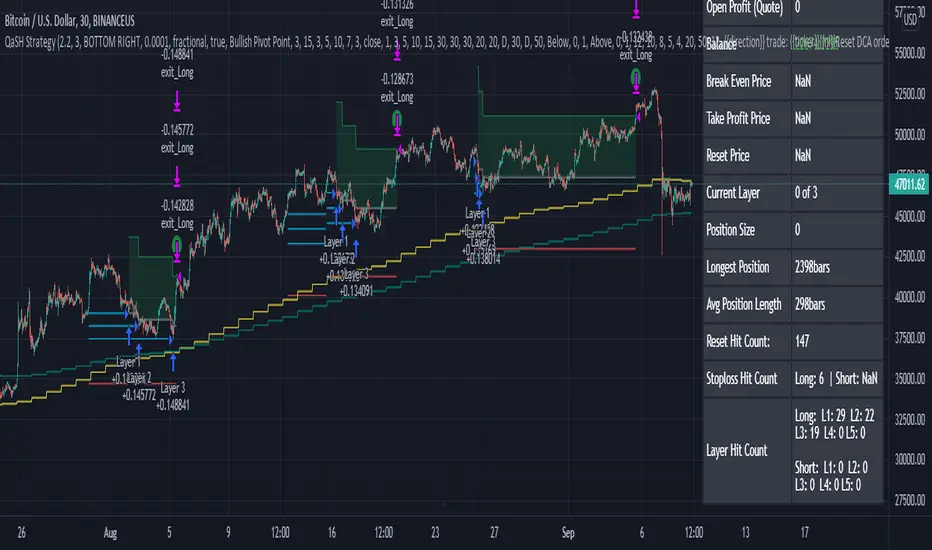
QaSH DCA StrategyThis is a backtesting script that demonstrates the power of incorporating dollar cost averaging into your trading strategies. Catch the bottom of those lightning fast dips buy placing your limit orders ahead of time.
Four entry conditions have been included:
- ASAP mode
- Quickfinger's Luc
- Bullish pivot point
- Bearish pivot point
An EMA-based entry condition filter is included
Placement of all DCA orders is adjustable, and "take profit" % is also variable and can depend on the size of the price dip.
QaSH DCA DaytraderThis script takes advantage of the power of DCA implemented in the QaSH DCA Algorithm script, and it applies it to new entry conditions. A "Quickfingers Luc" mode has been added, which creates new entry orders whenever a level of support has been identified. If price breaks the support level and quickly drops down, the orders will already be in place to catch the dip. This method can even catch the 1-second long, 50% flash dips that occur in some exchanges.
Four entry conditions are included in this initial release : ASAP, Quickfingers Luc, Bullish Pivot point, and Bearish Pivot point
All order placements are customizable
All take profit % values are based on the average entry price
Take profit % values can change based on how big the price dip was
Entry condition filter has been added and it uses a variable timeframe EMA
Stoploss function is available
Order size can be sent in the alerts, which allows for multiple setups to be running simultaneously in one account
All alerts are sent using the new "Any alert() function call" feature, which means this indicator will only take up one alert slot to cover all entry and exit alerts
Settings advice:
- If you think price is inflated, try conservative settings that either use a stoploss and EMA filter, or no stoploss but have some of your orders placed far below the current price with increasing volume. In a bear market this will beat the buy and hold.
- If you think the market is ready for a new bull run, then try experimenting with very aggressive settings to beat the buy and hold. For example: ASAP mode with 3 layers turned on. Orders placed at 0.5%, 3%, and 5%. Volumes at 30%, 30%, and 40% respectively. No stoploss. These settings were tested on ETH and beat the buy and hold during an extreme bull market period.

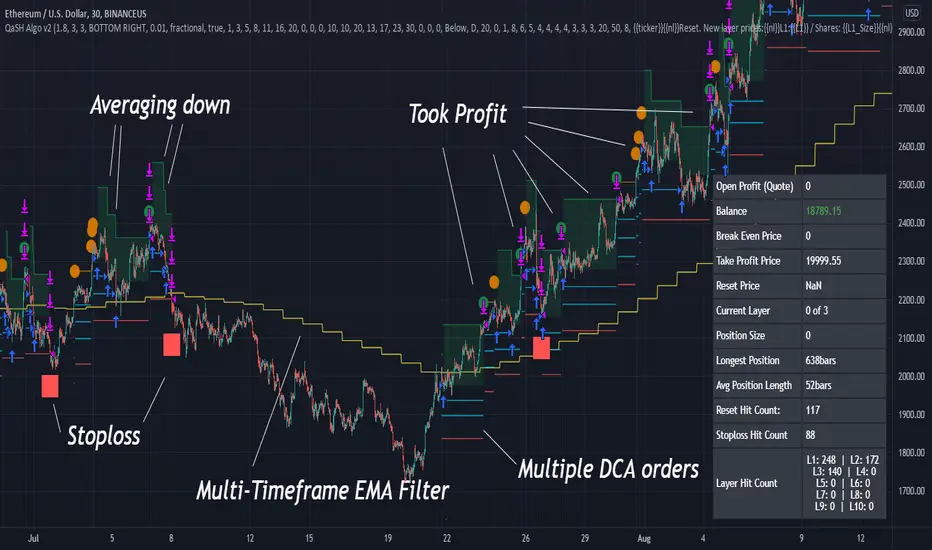
QaSH DCA Algorithm 2.0This is the strategy version of the QaSH DCA Algorithm indicator. This strategy version of the script includes live trading alert functionality, so it can be considered as a replacement that makes the indicator version obsolete. With this version, features have been added and also you can take advantage of TradingView's native backtesting system for more detailed backtest results.
QaSH DCA Algorithm implements a DCA strategy that takes advantage of price volatility by buying dips to average down, and adjusting price targets as the break-even price gets lower.
How does the DCA strategy work?
When the specified entry condition has occurred, the indicator will set up several limit orders below the current price. If price goes up a specified amount, then the layers will be overwritten at the higher prices. If price goes down and fills the first layer (limit order), then the Take Profit price is plotted and will be sent in an alert. If more layers are filled, then the TP price will move down accordingly as it’s based on the average entry price (alerts on each TP update). This action of lowering the average entry and TP price mitigates your risk, and increases the likelihood of a Take Profit event happening. This script uses a simple "ASAP" mode, where each deal will start exactly 2 bars after the last trade ended. An EMA filter and stoploss function was also added for risk management.
How does this differ from other DCA bots?
1) The layer placements, order volume , and “take profit %” for each layer or “safety order” is much more customizable than what you get from other services. For example, I can choose to have my TP% change, depending on how big the price dip was. Maybe on safety order 1 I want 10% TP, but on safety order 7 might want a 2% TP.
2) The entry condition is adjustable. For example, this script has an ema filter for entries.
3) Settings optimization. You can take advantage of the replay feature and TradingView's backtest system to see how trades would have played out, and how much PnL you would have made
4) You can use this indicator on more than just crypto. You can easily set up alerts for manual trades on stocks, or you can integrate it with your stock broker API of choice and automate your trades.
5) When combining this with an automation service, you will get unmatched execution speed by running it on your dedicated machine.
6) I can offer a lifetime subscription to the indicator upon request.
What kind of market is it best used on?
QaSH DCA Algorithm is best used on assets that are volatile. That means large and frequent swings up and down. Also I recommend running this on many uncorrelated assets at the same time. Better yet, run it with a variety of different settings simultaneously on the same asset.
What settings should I use?
The default settings are decent for most markets, and provide a good balance between profit potential and downside protection, although you can use a wide variety of settings. In a strong bull market its best to either bring up your layers to catch smaller dips, or you can go big on the first few layers (maybe 4 layers, 25% on each layer for example). In a sideways or brearish market you'll want more downside protection, so you'll want the larger orders to be at lower prices, or possibly use the stoploss and EMA filter.
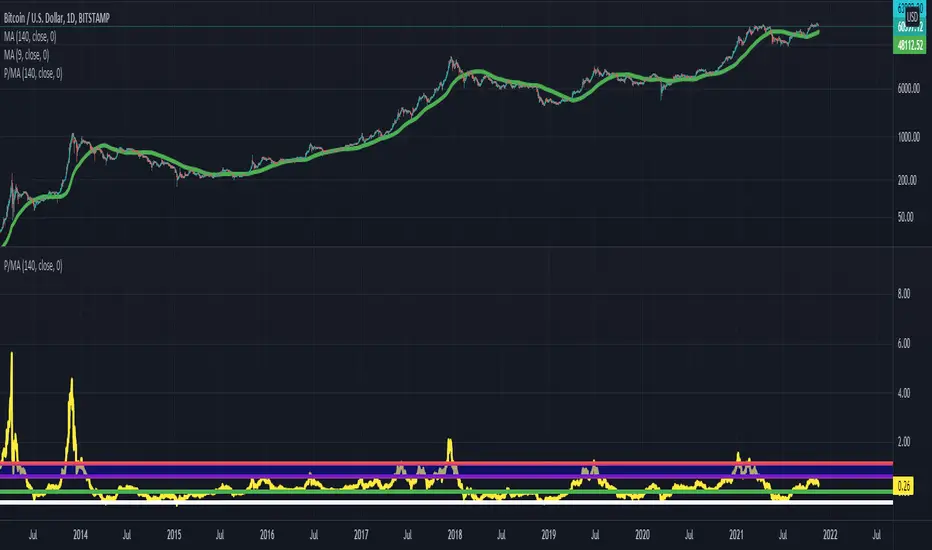
Price/Moving AveragePrice / Moving average indicator.
Support and resistance levels are established for Bitcoin.
When in a bear market, -50% below the 20 week MA acts as support.
When in a bull market, between 60% to 100% above the 20 week MA acts as resistance. Historically, these levels once hit, send Bitcoin back down to it's 20 week moving average.
In the setting of a bear market, historically, we do not ever get up to the 60% above the 20 week MA level.
Please note, this is only based on historical trends, and is not guaranteed to remain true in this or future market cycles.
Orion Algo Strategy v2.0Hi everyone.
I decided to make the latest Orion Algo open to people. I don't have enough time to work on it lately, so I figured it would be best that everyone can have it to work on it. I took out some stuff from the original but it should give an idea on how things work. I made two strategies with this so far so you can use that to come up with your own. I recommend the DCA strategy because it gives you the most bang for Orion Algo's buck. It's pretty good at finding long entries.
Overall I hope you guys like this one. Also, Banano is the best crypto currency :)
-INFO-
Orion Algo is a trading algorithm designed to help traders find the highs and lows of the market before, during, and after they happen. We wanted to give an indicator to people that was simple to use. In fact we created the algorithm in such a way that it currently only needs a single input from the user. Since no indicator can predict the market perfectly, Orion should be used as just another tool (although quite a sharp one) for you to trade with. Fundamental knowledge of price action and TA should be used with Orion Algo.
Being an oscillator, Orion currently has a bias towards market volatility . So you will want to be trading markets over 30% volatility . We have plans to develop future versions that take this into account and adjust automatically for dead conditions. Also, while there are some similarities across all oscillators, what sets ours apart is the prediction curve. The prediction curve looks at the current signal values and gives it a relative score to approximate tops and bottoms 1-2 bars ahead of the signal curve. We also designed a velocity curve that attempts to predict the signal curve 2+ bars ahead. You can find the relative change in velocity in the Info panel. The bottom momentum wave is based on the signal curve and helps find overall market direction of higher time-frames while in a lower one.
Settings and How to Use them:
User Agreement – Orion Algo is a tool for you to use while trading. We aren’t responsible for losses OR the gains you make with it. By clicking the checkbox on the left you are agreeing to the terms.
Super Smooth – Smooths the main signal line based on the value inside the box. Lower values shift the pivot points to the left but also make things more noisy. Higher values move things to the right making it lag a bit more while creating a smoother signal. 8 is a good value to start with.
Theme – Changes the color scheme of Orion.
Dashboard – Turns on a dashboard with useful stats, such as Delta v, Volatility , Rsi , etc. Changing the value box will move the dashboard left and right.
Prediction – A secondary prediction model that attempts to predict a reversal before it happens (0-2bars). This can be noisy some times so make your best judgement. Curve will toggle a curve view of the prediction. Pivots will toggle bull/bear dots.
∆v – Delta v (change in velocity). This shows momentum of the signal. Crossing 0 signals a reversal. If you see the delta v changing direction, it may signify a reversal in the several bars depending on the overall momentum of the market.
Momentum Wave – Uses the signal as a macro trend indicator. Changes in direction of the wave can signify macro changes in the market. Average will toggle an averaging algorithm of the momentum waves and makes it easy to understand.
-STRATEGIES-
Simple - Just buy and sell on the dots
DCA - Uses the settings in the script for entries. If a buy dot appears then it will buy, if the price goes below the percentage it will wait for another dot before entering. This drastically improves DCA potential.

Cava Signals Backtesting/VisualizerPLEASE READ THE DESCRIPTION CAREFULLY
Trying this again, as it seems I keep violating the rules unintentionally. Moderator, please forgive me as I try to make this right.
This backtesting/visualizer script was created for me to get a visual idea of the Cava Signals indicator throughout its development time and continuous optimization.
This script is to be used on the 30-minute timeframe on supported markets, and whether I can only publish strategies on regular candles, the indicator is meant to trigger on heikin ashi candles.I understand backtesting on non-regular candles produces unrealistic results, but I emphasize that this script is more for visualization purposes rather than accurate $ amounts from the trades. The signals are used along with a dedicated bot configuration, so part of the strategy is not managed by the script, but by the bot's config.
Some behind the scenes on what we are looking at:
a combination of ema and sma crosses on different time frames (5m, 15m, 30m, 60m and 90m) - we call this the wave trend
a combination of stochastic rsi on different time frames (10m, 30m)
a combination of schaff trend cycles on different time frames (5m, 20m and 30m)
a combination of money flow index on different time frames (10m and 30m)
volume information for each supported market/pair
and a couple of other info particular to each pair
With the above combination of data points, we try to optimize our strategy for an entry, for dca'ing down in case the coin goes down as well as dca'ing up to maximize profit when a coin is going up, take profit levels when we recognize a good time to do so, and of course, a closing level. I would like to emphasize the *visualization* purpose of this script in recognizing lows, highs, and market structure to identify the important levels to signal - this script is NOT to be used for accurate backtesting, but for an idea of the overall performance of when signals are triggered.
Let me try to explain the workflow and icons you see on the chart:
The colored circles on the bottom of the chart are all buy signals; each color corresponds to a particular buy signal, we have a combination of 9 possible situations that would trigger a buy signal. Some would trigger a buy signal only in combination with other buy signals or other indicators within the script. we also display a green upwards arrow below bars when a buy signal is triggered.
The colored arrows pointing down on the top of the chart are close signals. We have a combination of 5 closing criteria each color corresponds to one, just like the buy signals do. We only close a trade in profit. If not in profit, we will look to DCA down.
DCA signals are shown by the green flag above bars. they are signals to DCA up or down depending on the trade being negative or positive. DCA'ing up or down is also managed by the bot's configuration for limits on when to accept the signal.
Take Profit levels are shown by the green diamond above bars and work in conjunction with the bot's config on when to take the signal if at all and other take profit levels. Usually, when we hit the first take profit level we move our stop loss to entry via the bot's take profit safety feature. You can see this call with the close entry named TPS .
The black bars you may see on the chart is to illustrate when the market is extended based on a particular strategy. During this period we will not trigger a buy signal unless there is a huge spike in positive volume .
The green number below the bars is the total positive delta volume on the buy candles.
On the table on the right upper corner, we show some information on the market and performance of the backtesting - for visualization purposes only!
Currently, the script is tailored to work with the following markets/pairs:
Binance Spot: ADA, ALGO, ATOM, AVAX, BNB, BTC , DOT, ETH, LINK, LUNA, MATIC, SOL, VET, XRP, XTZ
Binance Futures: BTC , ETH, ADA, ALGO, ATOM, BNB, COMP, DOT, ENJ , LINK, OCEAN, OMG, SOL, VET, XMR, XRP, XTZ, AVAX, AAVE, DOGE, LTC, LUNA, MKR , NEAR, ONT, RUNE, SUSHI, LTC, XLM , COMP, ONT, THETA, FTM , EGLD , WAVES, ONE, HTN , CHZ , HOT, MANA, CRV , RVN, BAT, ANKR, 1INCH, ALICE, ATA , AXS , CHR , COTI, NKN , RAY, REN, SRM , SXP , TLM
ByBit Inverse Perpetual: BTCUSD , ETHUSD
ByBit Futures: AAVE, ADA, ALGO, AVAX, AXS , BNB, BTC , DOT, ETH, LINK, LTC, MATIC, SOL, SUSHI, UNI , XEM, XRP, XTZ
The chosen pairs are subject to change based on the best-performing assets we are constantly analyzing.
I hope this helps to understand the script, its purpose and ideas. I hope this satisfies the community rules - it was not my intention to break them - if there's anything on the above or the script that still violates the guidelines, please let me know and accept my apologies in advance.
If anyone would like to know more, let me know in the comment section.
Thank you!

cowen risk indexThis is my attempt at remaking the cowen risk index. It's definitely not correct, but should give a rough estimate of where his indicator is at. I am taking the price divided by the 400sma to get an oscillator, then we need to account for diminishing returns so I just made an exponentially increasing variable and mutliplying that by the oscillator value. Then I normalized the data as best as I could. Not sure exactly how to do that so if anyone has any suggestions, please let me know.
This only works on the daily and weekly timeframe. You will need to edit the code if you want to have it work for other timeframes.

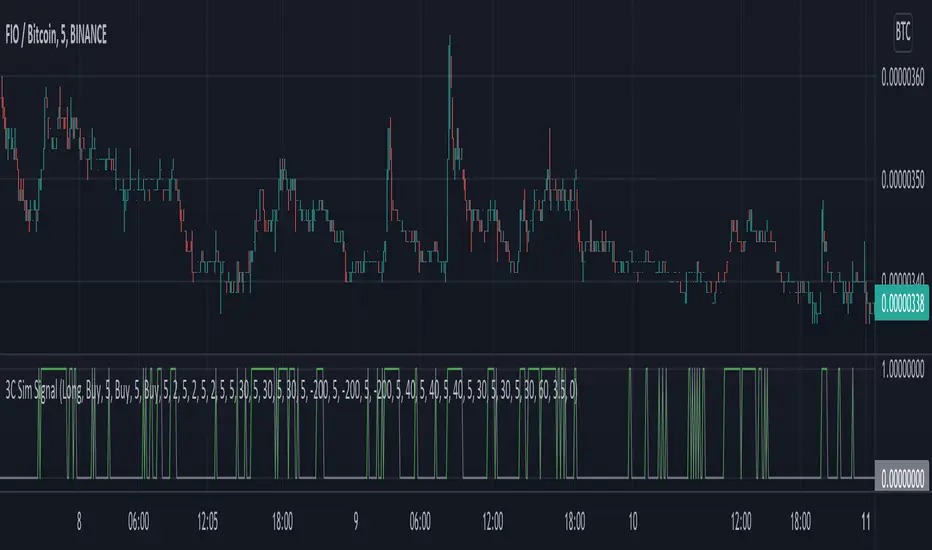
3C Sim SignalThis indicator offers the same deal start conditions available on Backtest script but now as an external signal so you can not only backtest but also set up alerts.
You can use the backtest script to backtest this indicator as an external signal and then once happy with the backtest results send directly tradingview alerts to your own bots on any exchange.
It supports most of the deal start conditions currently available for DCA bots on binance.com for example:
- TV technical ratings: buy, sell, strong buy, strong sell.
- RSI
- MFI
- CCI
- Ultimate Oscilator
- QFL
- min volume filter
Once added to the chart it will plot one when the deal start condition is true and zero when is not.
The conditions can be used in long or short strategy mode.
The biggest advantage compared to using it separately from the DSC already available in the backtest script is that because this is a separated study it will perform faster than the backtest and it resolves repainting issues. This two aspects make these indicator better suited for real time trading while still being able to connect to the backtest as an external indicator therefore still backtestable.
Now you can backtest symbols on any exchange and once your strategy is ready you then can send alerts directly to your bots.
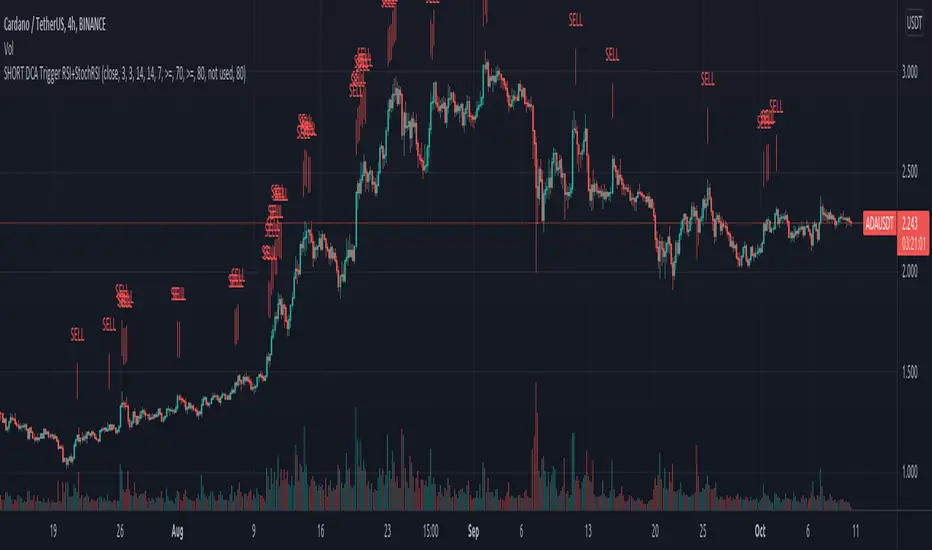
Zendog SHORT DCA Trigger RSI+StochRSIThis is a script that generates a SELL signal by combining RSI and Stochastic RSI into the same script and that can easily be integrated into an external Backtester like the one I published.
The script uses default values for RSI and Stochastic RSI overbought conditions.
They should be adjusted for specific assets and timeframes so they better match the current trend. Please beware you might overfit settings to match a short timeframe trend (like a few days or hours). If this is the case once the trend changes the signals will not be accurate.
The purpose of this script is to provide some pine code that can be used to further combine multiple indicators into a SHORT Deal Start signal.
Integration with the Zendog Backtster:
- add the backtester on the chart
- add this script on the chart
- in the Zendog backtester Deal start type select "External indicator"
- in the Zendog backtester Indicator source and value select "Zendog SHORT DCA Trigger RSI+StochRSI: SIGNAL"
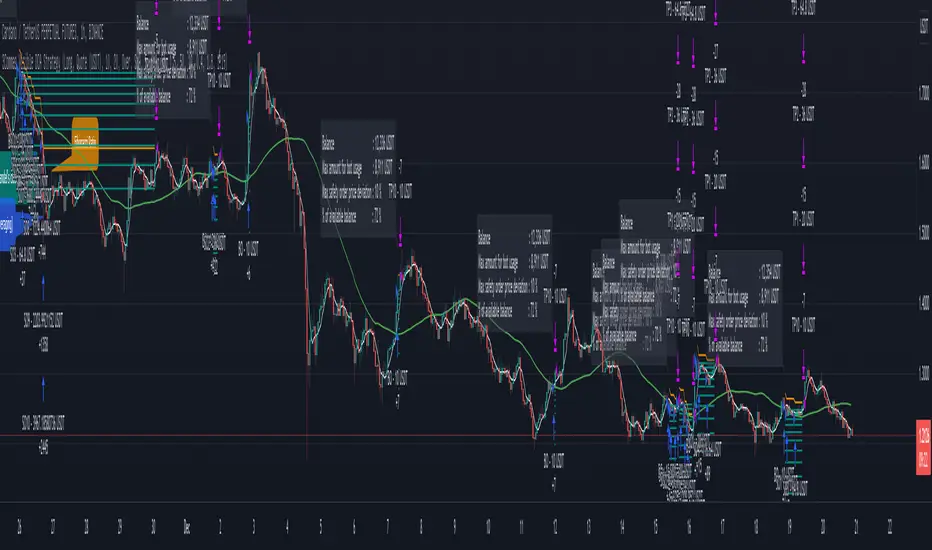
3Commas DCA Bot Indicator v1.0Introduction
The indicator attempts to implement a majority all of the settings found on the 3Commas DCA Bot setting page that can be implemented within a TradingView indicator. Specifically, it will implement the "Open new trade ASAP" and "Trading View Custom Signal" deal start conditions. In this way, you can leverage the power of TradingView's backtester to model your settings and analysis past performance as well as leverage TradingView's alert notification subsystem to send Deal Start and Close signals to 3Commas using almost any of the thousands of scripts found in the Public Library (see "What does it do and how does it do it?" section below for more information on how to do this using the RSI indicator as an example).
How is it original and useful?
This indicator is unique in that it's the only one (as of the initial publications) that can handle 28 out of 32 bot settings (88% coverage) that are found on the 3Commas bot settings page. In addition, because it is a TradingView script, you will benefit from the following:
Model your bot's configuration using the backtester on any timeframe and evaluate its performance using the chart's history.
View a table of detailed statistics pertaining to deals started and completed, win/loss rates, daily P&L, true max drawdown, and detailed statistics on bars in deal along with safety orders filled.
View a table of "Used amount for each step" as presented in 3Commas as well.
Ability to link to almost any TradingView chart indicator that provides a single data point for buy/sell signals.
Make use of the 3Commas TA Start Conditions indicator to emulate the 3Commas built-in indicators for further performance evaluation with the backtester.
How does it compare to other scripts in the Public Library?
This indicator offers a very detailed, comprehensive settings and maybe the only one (as of the initial publication) that can handle 28 out of the 32 bot settings that are found on the 3Commas bot settings page (that can be handled within TradingView, because some cannot be modeled due to chart and language constraints). Specifically, the following 3Commas bot settings and inputs are addressed with asterisks denoting specific limitation due to TradingView's platform architecture and/or constraints:
Main settings
✅ Name
❌ Exchange* (Not handled since it is inherited from chart)
⚠ Bot type* (Only Single-pair because you simply apply the indicator to as many pairs you desire in separate charts to simulate a Multi-pair setting)
Pairs
❌ Pairs* (Not handled since it is inheriting the symbol from the chart)
Strategy
✅ Strategy
❌ Profit currency* (Not handled since there is no equivalence in TradingView)
✅ Base order size / unit
✅ Safety order size / unit
✅ Start order type
Deal start condition
⚠ TradingView* (You can modify the "Technical Rating" indicator by TradingView to output a signal yourself like @TheTradingParrot has done in the TV signal for DCA backtest script)
⚠ QFL* (See Quickfingers Luc's Base Breaking Strategy v2.5 - 3Commas Edition for an alternative)
❌ Manually/API* (Not handled since there is no equivalence in TradingView)
✅ Trading View custom signal
✅ Open new trade asap
Take profit
✅ Take profit (%)
✅ Take profit type
✅ Trailing
⚠ Trailing deviation* (modified to handle TradingView's broker emulator properly)
Stop loss
✅ Stop Loss (%)
✅ Stop Loss action
⚠ Stop Loss timeout* (modified to use "bars" as the unit of measure)
Safety orders
✅ Max safety trades count (a total of 100 safety orders are supported!)
⚠ Max active safety trades count* (Not handled since there is no equivalence in TradingView)
✅ Price deviation to open safety orders (% from initial order)
✅ Safety order volume scale
✅ Safety order step scale
Advanced settings
✅ Don't start deal(s) if the daily volume is less than
✅ Minimum price to open deal
✅ Maximum price to open deal
⚠ Deal start delay (QFL and standard TV signals only)* (modified to use "bars" as the unit of measure)
✅ Cooldown between deals
✅ Open deals & stop
Close deal after timeout
⚠ The time after which, deal will be closed automatically* (modified to use "bars" as the unit of measure)
In addition to the above inputs, the script will also support the same output data points that are found on the bot settings page, which are:
Assistant
✅ Balance
✅ Max amount for bot usage (Based on current rate)
✅ Max safety order price deviation
✅ % of available balance to be used by the bot
Table (Used amount for each step)
✅ Order No.
✅ Deviation %
✅ Order Size (Base currency)
✅ Order Volume (Quote currency)
✅ Price
✅ Average price
✅ Required price
✅ Required change
✅ Total Size (Base currency)
✅ Total Volume (Quote currency)
What does it do and how does it do it?
When applied to the chart for the first time, the default settings will work to execute the "Open new trade asap" deal start condition using a take profit of 4%, a base order size of 1.335% of equity (initial capital + net profit), a safety order size of 2.003% of equity (initial capital + net profit), a safety order volume scale of 1.5, a safety order step scale of 1.21, and a max safety trades count of 8. With these settings, as you scroll through the chart's history you should see price action crossing the DCA layers (denoted with blue triangles), and a green take-profit price line will render (with green triangle denoting the crossings). Lastly, in the upper-right corner of the chart the table of DCA statistics will render showing you all the gathered data that took place since the chart's starting history until the current time.
Using the "TV Custom Signal" section will allow you to "link" other chart indicators to supply "Start" and "Close" signals for the script. For example, here's how you can use the standard RSI indicator to generate an entry signal:
1) Add the stock RSI indicator and configure it to your desire.
2) Select the "RSI" indicator in the "Chart/Indicator Data Point" input.
3) Select "Chart/Indicator Data Point" in the "Start Deal When" input.
4) Select "Less Than" in the "Is" input.
5) Select "Custom Value(s)" in the "The Value Of" input.
6) Enter "25" in the "Custom Value 1 (Single or Lower Bound)" input.
7) Select "Trading View Custom Signal" in the "Open new trade" input (in the DEAL START CONDITION section).
8) Lastly, check the checkbox with a horizontal straight line above the "Start Deal When" input.
This means that the indicator will start a deal when the "RSI indicator" is "Less Than" the value of "25".
Strategy Results
The default settings are designed to ensure that the indicator will render chart elements when first loaded as well as to allow the backtester to gather order executions and display performance summary. The chart above is is using $10,000 initial capital, a commission rate of 0.1% for both entries and exits, and a 1 tick slippage setting. It is also using 3.22581% of the equity for the Base Order Size, 6.45161% of equity for the first Safety Order Size. The Maximum Safety Trade Count is 4 with a Safety Order Volume Scale of 2, a Safety Order Step Scale of 1.53, Price Deviation To Option Safety Orders at 5.3, and a take profit of 4.5% with Trailing turned on at a deviation of 1.5%. All other settings are defaults.
It is recommended that the indicator be "tuned" for your specific market in order to best implement the strategy and obtain better desirable results. You do so by using the backtester and statistics table and observe the output values and learn how the indicator is performing in the chart history. Using this information, you can adjust the settings accordingly until you find the settings acceptable to your trading goals and risk tolerance.
Always keep in mind that past performance may not be indicative of future results. Settings that seem favorable for one market may be found to be disastrous in another. Therefore, do take the time needed to understand how the settings will behave with the given chart symbol.
Enjoy! 😊👍
How to obtain access to the script?
You have two choices:
Use the "Website" link below to obtain access to this indicator, or
Send us a private message (PM) in TradingView itself.

3Commas DCA Bot Strategy v1.0Introduction
The strategy attempts to implement a majority all of the settings found on the 3Commas DCA Bot setting page that can be implemented within a TradingView indicator. Specifically, it will implement the "Open new trade ASAP" and "Trading View Custom Signal" deal start conditions. In this way, you can leverage the power of TradingView's backtester to model your settings and analysis past performance as well as leverage TradingView's alert notification subsystem to send Deal Start and Close signals to 3Commas using almost any of the thousands of scripts found in the Public Library (see "What does it do and how does it do it?" section below for more information on how to do this using the RSI indicator as an example).
How is it original and useful?
This strategy is unique in that it's the only one (as of the initial publications) that can handle 28 out of 32 bot settings (88% coverage) that are found on the 3Commas bot settings page. In addition, because it is a TradingView script, you will benefit from the following:
Model your bot's configuration using the backtester on any timeframe and evaluate its performance using the chart's history.
View a table of detailed statistics pertaining to deals started and completed, win/loss rates, daily P&L, true max drawdown, and detailed statistics on bars in deal along with safety orders filled.
View a table of "Used amount for each step" as presented in 3Commas as well.
Ability to link to almost any TradingView chart indicator that provides a single data point for buy/sell signals.
Make use of the 3Commas TA Start Conditions indicator to emulate the 3Commas built-in indicators for further performance evaluation with the backtester.
How does it compare to other scripts in the Public Library?
This strategy offers a very detailed, comprehensive settings and maybe the only one (as of the initial publication) that can handle 28 out of the 32 bot settings that are found on the 3Commas bot settings page (that can be handled within TradingView, because some cannot be modeled due to chart and language constraints). Specifically, the following 3Commas bot settings and inputs are addressed with asterisks denoting specific limitation due to TradingView's platform architecture and/or constraints:
Main settings
✅ Name
❌ Exchange* (Not handled since it is inherited from chart)
⚠ Bot type* (Only Single-pair because you simply apply the indicator to as many pairs you desire in separate charts to simulate a Multi-pair setting)
Pairs
❌ Pairs* (Not handled since it is inheriting the symbol from the chart)
Strategy
✅ Strategy
❌ Profit currency* (Not handled since there is no equivalence in TradingView)
✅ Base order size / unit
✅ Safety order size / unit
✅ Start order type
Deal start condition
⚠ TradingView* (You can modify the "Technical Rating" indicator by TradingView to output a signal yourself like @TheTradingParrot has done in the TV signal for DCA backtest script)
⚠ QFL* (See Quickfingers Luc's Base Breaking Strategy v2.5 - 3Commas Edition for an alternative)
❌ Manually/API* (Not handled since there is no equivalence in TradingView)
✅ Trading View custom signal
✅ Open new trade asap
Take profit
✅ Take profit (%)
✅ Take profit type
✅ Trailing
⚠ Trailing deviation* (modified to handle TradingView's broker emulator properly)
Stop loss
✅ Stop Loss (%)
✅ Stop Loss action
⚠ Stop Loss timeout* (modified to use "bars" as the unit of measure)
Safety orders
✅ Max safety trades count (a total of 100 safety orders are supported!)
⚠ Max active safety trades count* (Not handled since there is no equivalence in TradingView)
✅ Price deviation to open safety orders (% from initial order)
✅ Safety order volume scale
✅ Safety order step scale
Advanced settings
✅ Don't start deal(s) if the daily volume is less than
✅ Minimum price to open deal
✅ Maximum price to open deal
⚠ Deal start delay (QFL and standard TV signals only)* (modified to use "bars" as the unit of measure)
✅ Cooldown between deals
✅ Open deals & stop
Close deal after timeout
⚠ The time after which, deal will be closed automatically* (modified to use "bars" as the unit of measure)
In addition to the above inputs, the script will also support the same output data points that are found on the bot settings page, which are:
Assistant
✅ Balance
✅ Max amount for bot usage (Based on current rate)
✅ Max safety order price deviation
✅ % of available balance to be used by the bot
Table (Used amount for each step)
✅ Order No.
✅ Deviation %
✅ Order Size (Base currency)
✅ Order Volume (Quote currency)
✅ Price
✅ Average price
✅ Required price
✅ Required change
✅ Total Size (Base currency)
✅ Total Volume (Quote currency)
What does it do and how does it do it?
When applied to the chart for the first time, the default settings will work to execute the "Open new trade asap" deal start condition using a take profit of 4%, a base order size of 1.335% of equity (initial capital + net profit), a safety order size of 2.003% of equity (initial capital + net profit), a safety order volume scale of 1.5, a safety order step scale of 1.21, and a max safety trades count of 8. With these settings, as you scroll through the chart's history you should see price action crossing the DCA layers (denoted with blue triangles), and a green take-profit price line will render (with green triangle denoting the crossings). Lastly, in the upper-right corner of the chart the table of DCA statistics will render showing you all the gathered data that took place since the chart's starting history until the current time.
Using the "TV Custom Signal" section will allow you to "link" other chart indicators to supply "Start" and "Close" signals for the script. For example, here's how you can use the standard RSI indicator to generate an entry signal:
1) Add the stock RSI indicator and configure it to your desire.
2) Select the "RSI" indicator in the "Chart/Indicator Data Point" input.
3) Select "Chart/Indicator Data Point" in the "Start Deal When" input.
4) Select "Less Than" in the "Is" input.
5) Select "Custom Value(s)" in the "The Value Of" input.
6) Enter "25" in the "Custom Value 1 (Single or Lower Bound)" input.
7) Select "Trading View Custom Signal" in the "Open new trade" input (in the DEAL START CONDITION section).
8) Lastly, check the checkbox with a horizontal straight line above the "Start Deal When" input.
This means that the indicator will start a deal when the "RSI indicator" is "Less Than" the value of "25".
Strategy Results
The default settings are designed to ensure that the indicator will render chart elements when first loaded as well as to allow the backtester to gather order executions and display performance summary. The chart above is is using $10,000 initial capital, a commission rate of 0.1% for both entries and exits, and a 1 tick slippage setting. It is also using 3.22581% of the equity for the Base Order Size, 6.45161% of equity for the first Safety Order Size. The Maximum Safety Trade Count is 4 with a Safety Order Volume Scale of 2, a Safety Order Step Scale of 1.53, Price Deviation To Option Safety Orders at 5.3, and a take profit of 4.5% with Trailing turned on at a deviation of 1.5%. All other settings are defaults.
It is recommended that the indicator be "tuned" for your specific market in order to best implement the strategy and obtain better desirable results. You do so by using the backtester and statistics table and observe the output values and learn how the indicator is performing in the chart history. Using this information, you can adjust the settings accordingly until you find the settings acceptable to your trading goals and risk tolerance.
Always keep in mind that past performance may not be indicative of future results. Settings that seem favorable for one market may be found to be disastrous in another. Therefore, do take the time needed to understand how the settings will behave with the given chart symbol.
Enjoy! 😊👍
How to obtain access to the script?
You have two choices:
Use the "Website" link below to obtain access to this indicator, or
Send us a private message (PM) in TradingView itself.

Price Change Scalping Indicator v1.0 - 3Commas EditionIntroduction
This indicator implements the Price Change Scalping (PCS) strategy specifically for the 3Commas platform. The Input settings have been redesigned to match the same inputs as the 3Commas My Bot Settings page. Only the "Deal Start Condition" section will echo the required PCS-related settings found in the original Price Change Scalping Indicator v1.0 to successfully implement the strategy.
The indicator uses a price rate of change (ROC) momentum calculation to determine the percent change in price between a defined range of bars. The calculated ROC value is then compared to the Upper Threshold and Lower Threshold values to determine if a trade setup is to be activated. If the threshold is crossed, a trade setup will occur based on the indicator settings. Entry, Take Profit, and Stop Loss prices are calculated and displayed on the chart. Once the Entry Price is crossed, a long or short position is created (depending on the direction) and once the Take Profit price is crossed, the position is closed. If the Entry Price is not crossed within a specific number of bars, the trade setup is canceled, and it will proceed to monitor price changes for the next set up.
How is it original and useful?
This indicator is unique in that the strategy version fully supports the TradingView backtester, which will enable you to perform experiments with various settings to evaluate performance using the historical chart data. The study version implements the "Start Deal" and "Close Deal" alerts for you to integrate with 3Comma's "Trading View Custom Signal" start condition. Both script versions will provide the same configuration abilities. The following list is a brief description of its usefulness:
Full support for all possible 3Commas bot settings.
Define a short or long trading strategy.
Price change data source and offset settings.
Your layering placement relative to the entry price.
Your trading parameters like take profit and stop loss offsets, trailing take profit support, exchange commission rates, trading start time, and order size multiplication for each layer.
Flexible trade eligibility rules that can use other chart indicators, like RSI or EMA, to exclude the selection of entry prices for trading.
The visibility of detailed statistics from the chart history pertaining to trading sessions started and closed, session durations, win rate, price action drops and bounces, as well as layer utilization.
The visibility of detailed Used Amount for Each Step table that details how each layer will be allocated for trading.
How does it compare to other scripts in the Public Library?
The indicator offers a very detailed, comprehensive settings to address all types of markets found on TradingView where you can implement the price change scalping strategy. The strategy version can be considered the first of its kind on TradingView to leverage the backtester to provide informative, detailed performance measurements surrounding this unique trading strategy. The study version will implement the latest alert framework called "Any Alert() Function" where you can create a single alert to handle multiple events, which include:
Deal Start
Deal Close
Strategy Results
The default settings are designed to define a "loose" price change settings to ensure that the indicator will render chart elements when first loaded as well as to allow the backtester to gather order executions and display performance summary. The strategy version is using $10,000 initial capital, a commission rate of 0.1% for both entries and exits, and a 1 tick slippage setting. It is also using 3.4881% of the equity for the Base Order Size, 4.7097% of equity for the first Safety Order Size. The Maximum Safety Trade Count is 7 with a Safety Order Volume Scale of 1.33, and a take profit of 2% with no stop loss. All other settings are defaults.
It is recommended that the indicator be "tuned" for your specific market to best implement the price change strategy and obtain better desirable results. You do so by scrolling through the chart's history and observing moments when prices tend to move rapidly. Measure the number or bars it typically takes for the price to change at a specific rate. Using this information, you can adjust the Price Change Settings accordingly to configure the indicator for the chart.
Always keep in mind that past performance may not be indicative of future results. Settings that seem favorable for one market may be found to be disastrous in another. Therefore, do take the time needed to understand how the settings will behave with the given chart symbol.
Enjoy! 😊👍
How to obtain access to the script?
You have two choices:
Use the "Website" link below to obtain access to this indicator, or
Send us a private message (PM) in TradingView itself.

Price Change Scalping Strategy v1.0 - 3Commas EditionIntroduction
This strategy implements the Price Change Scalping (PCS) strategy specifically for the 3Commas platform. The Input settings have been redesigned to match the same inputs as the 3Commas My Bot Settings page. Only the "Deal Start Condition" section will echo the required PCS-related settings found in the original Price Change Scalping Strategy v1.0 to successfully implement the strategy.
The strategy uses a price rate of change (ROC) momentum calculation to determine the percent change in price between a defined range of bars. The calculated ROC value is then compared to the Upper Threshold and Lower Threshold values to determine if a trade setup is to be activated. If the threshold is crossed, a trade setup will occur based on the indicator settings. Entry, Take Profit, and Stop Loss prices are calculated and displayed on the chart. Once the Entry Price is crossed, a long or short position is created (depending on the direction) and once the Take Profit price is crossed, the position is closed. If the Entry Price is not crossed within a specific number of bars, the trade setup is canceled, and it will proceed to monitor price changes for the next set up.
How is it original and useful?
This strategy is unique in that the strategy version fully supports the TradingView backtester, which will enable you to perform experiments with various settings to evaluate performance using the historical chart data. The study version implements the "Start Deal" and "Close Deal" alerts for you to integrate with 3Comma's "Trading View Custom Signal" start condition. Both script versions will provide the same configuration abilities. The following list is a brief description of its usefulness:
Full support for all possible 3Commas bot settings.
Define a short or long trading strategy.
Price change data source and offset settings.
Your layering placement relative to the entry price.
Your trading parameters like take profit and stop loss offsets, trailing take profit support, exchange commission rates, trading start time, and order size multiplication for each layer.
Flexible trade eligibility rules that can use other chart indicators, like RSI or EMA, to exclude the selection of entry prices for trading.
The visibility of detailed statistics from the chart history pertaining to trading sessions started and closed, session durations, win rate, price action drops and bounces, as well as layer utilization.
The visibility of detailed Used Amount for Each Step table that details how each layer will be allocated for trading.
How does it compare to other scripts in the Public Library?
The strategy offers a very detailed, comprehensive settings to address all types of markets found on TradingView where you can implement the price change scalping strategy. The strategy version can be considered the first of its kind on TradingView to leverage the backtester to provide informative, detailed performance measurements surrounding this unique trading strategy. The study version will implement the latest alert framework called "Any Alert() Function" where you can create a single alert to handle multiple events, which include:
Deal Start
Deal Close
Strategy Results
The default settings are designed to define a "loose" price change settings to ensure that the indicator will render chart elements when first loaded as well as to allow the backtester to gather order executions and display performance summary. The strategy version is using $10,000 initial capital, a commission rate of 0.1% for both entries and exits, and a 1 tick slippage setting. It is also using 3.4881% of the equity for the Base Order Size, 4.7097% of equity for the first Safety Order Size. The Maximum Safety Trade Count is 7 with a Safety Order Volume Scale of 1.33, and a take profit of 2% with no stop loss. All other settings are defaults.
It is recommended that the indicator be "tuned" for your specific market to best implement the price change strategy and obtain better desirable results. You do so by scrolling through the chart's history and observing moments when prices tend to move rapidly. Measure the number or bars it typically takes for the price to change at a specific rate. Using this information, you can adjust the Price Change Settings accordingly to configure the indicator for the chart.
Always keep in mind that past performance may not be indicative of future results. Settings that seem favorable for one market may be found to be disastrous in another. Therefore, do take the time needed to understand how the settings will behave with the given chart symbol.
Enjoy! 😊👍
How to obtain access to the script?
You have two choices:
Use the "Website" link below to obtain access to this indicator, or
Send us a private message (PM) in TradingView itself.
