Cyatophilum Scalper [ALERTSETUP]This indicator comes with a backtest and alert version. This is the alert version. Its purpose is to create low timeframe and scalping strategies, by choosing from a list of built-in entry points which are described in detail below, and by configuring a risk management system to your liking.
Before diving into the entry points, I will explain the strategy and risk management settings.
These 3 settings allow to choose your strategy direction, and main behavior.
- Go Long ↗: activate or deactivate long entry points.
- Go Short ↘: activate or deactivate short entry points.
- Reversal strategy ↗↘↗↘: Activate this option will allow trades to reverse position from an opposite entry point. Keep it deactivated and trades will either wait a TakeProfit(TP) or StopLoss(SL) to be closed. When neither SL nor TP or set, this option is automatically activated.
StopLoss settings:
Both Long and Short SL can be activated and configured.
The base % price is the starting point of the stoploss, in a percentage of current price.
Trailing stop, when activated, works with 2 settings:
- % Price to Trigger: a percentage of current price the price should move in a bar to trigger a trailing movement.
- % Price Movement: the stoploss variation in a percentage of current price that moves on each bar.
TakeProfit settings:
Both Long and Short TP can be activated and configured.
The base % price is the value of the TP, in a percentage of current price.
Trailing Profit Deviation %: Percent deviation for the trailing take profit.
DCA:
DCA stands for Dollar Cost Average. The idea is to open additional orders from the base order so as to improve risk management.
These additional orders are also called Safety Orders. The indicator can handle up to 9 safety orders.
The strategy will exit either from a take profit based on percentage from base order or from a total volume percentage (Configurable in the parameters).
The steps spacing (space between each step) and safety orders volume (order size) can both scale by adding a scale multiplier.
By choosing from the base strategy dropdown menu, the indicator will generate entry points.
1. BUY SELL:
-> Low timeframes spot trading, with simple buy and sell orders.
How it works:
The indicator used is a combination of QQE (Atr based trend following indicator) and RMA 100 trendline.
I think the QQE does a great job in low timeframes because it is not impacted by the noise.
The RMA which is the moving average used in the RSI, will help giving confirmation to the entry points.
How to use:
It is meant to be used as a reversal strategy, but you can add a TP or SL if you want.
When comparing to Buy & Hold, make sure to deactivate the "Short results in the backtest" setting.
2. TREND SCALPING
-> A strategy for low timeframes trading.
How it works:
The strategy creates high volatility entries filtered by a duo convergence of adaptive trendlines (Adaptive HULL MA using the chart's resolution, Adaptive Tilson T3 using 1H resolution) and a higher timeframe (1H) RSI filter (long threshold: 70, short threshold: 40, RSI length: 10).
How to use:
Must be used on charts with a resolution smaller than 1H. Recommended: from 1m to 30m.
Must NOT be used as reversal strategy. Use it with a take profit and stop loss, and DCA if you can.
Sample risk management settings:
3. Support/Resistance BREAKOUTS
-> Trade low timeframes pivot points breakouts.
How it works:
The indicator calculates the 100 previous bars swing high and low. Any break above high or below low will trigger an entry point.
The entry is however filtered by an Adaptive Tilson T3 Trendline, an ADX 30 minimum threshold and a minimum average volume threshold.
How to use:
I recommend to click "Reversal" Strategy and set a Takeprofit target.
Find the best timeframe between 1m and 30m using the backtest version.
Example here with BTCUSDTPERP on 15m:
4. AGGRESSIVE SCALPING
-> Lots of trades in low timeframes.
How it works:
Created using Cyato AI, Higher/Lower Highs and Lows and 2 HULLMA crosses as entries, and 2 Adaptive Tilson T3 as trendfilter, a 25 ADX threshold filter and a volume filter.
How to use:
Recommended Risk Management settings: Takeprofit, Stoploss and DCA (Safety orders).
Find which timeframe work the best from 30 min and below. Should not be used above 30 min since this is the resolution for the MTF Tilson.
How to create Alerts:
Click Add alert, then select the indicator, and choose the alert for your order.
Most used alerts are "LONG ENTRY", "SHORT ENTRY" and "ALL EXITS".
You will find a description of each alert in the default alert message.
To gain access to this paid indicator, please use the link below.
DCA

Cyatophilum Scalper [BACKTEST]This indicator comes with a backtest and alert version. This is the backtest version. Its purpose is to create low timeframe and scalping strategies, by choosing from a list of built-in entry points which are described in detail below, and by configuring a risk management system to your liking.
Before diving into the entry points, I will explain the strategy and risk management settings.
These 3 settings allow to choose your strategy direction, and main behavior.
- Go Long ↗: activate or deactivate long entry points.
- Go Short ↘: activate or deactivate short entry points.
- Reversal strategy ↗↘↗↘: Activate this option will allow trades to reverse position from an opposite entry point. Keep it deactivated and trades will either wait a TakeProfit(TP) or StopLoss(SL) to be closed. When neither SL nor TP or set, this option is automatically activated.
StopLoss settings:
Both Long and Short SL can be activated and configured.
The base % price is the starting point of the stoploss, in a percentage of current price.
Trailing stop, when activated, works with 2 settings:
- % Price to Trigger: a percentage of current price the price should move in a bar to trigger a trailing movement.
- % Price Movement: the stoploss variation in a percentage of current price that moves on each bar.
TakeProfit settings:
Both Long and Short TP can be activated and configured.
The base % price is the value of the TP, in a percentage of current price.
Trailing Profit Deviation %: Percent deviation for the trailing take profit.
DCA:
DCA stands for Dollar Cost Average. The idea is to open additional orders from the base order so as to improve risk management.
These additional orders are also called Safety Orders. The indicator can handle up to 9 safety orders.
The strategy will exit either from a take profit based on percentage from base order or from a total volume percentage (Configurable in the parameters).
The steps spacing (space between each step) and safety orders volume (order size) can both scale by adding a scale multiplier.
By choosing from the base strategy dropdown menu, the indicator will generate entry points.
1. BUY SELL:
-> Low timeframes spot trading, with simple buy and sell orders.
How it works:
The indicator used is a combination of QQE (Atr based trend following indicator) and RMA 100 trendline.
I think the QQE does a great job in low timeframes because it is not impacted by the noise.
The RMA which is the moving average used in the RSI, will help giving confirmation to the entry points.
How to use:
It is meant to be used as a reversal strategy, but you can add a TP or SL if you want.
When comparing to Buy & Hold, make sure to deactivate the "Short results in the backtest" setting.
2. TREND SCALPING
-> A strategy for low timeframes trading.
How it works:
The strategy creates high volatility entries filtered by a duo convergence of adaptive trendlines (Adaptive HULL MA using the chart's resolution, Adaptive Tilson T3 using 1H resolution) and a higher timeframe (1H) RSI filter (long threshold: 70, short threshold: 40, RSI length: 10).
How to use:
Must be used on charts with a resolution smaller than 1H. Recommended: from 1m to 30m.
Must NOT be used as reversal strategy. Use it with a take profit and stop loss, and DCA if you can.
Sample risk management settings:
3. Support/Resistance BREAKOUTS
-> Trade low timeframes pivot points breakouts.
How it works:
The indicator calculates the 100 previous bars swing high and low. Any break above high or below low will trigger an entry point.
The entry is however filtered by an Adaptive Tilson T3 Trendline, an ADX 30 minimum threshold and a minimum average volume threshold.
How to use:
I recommend to click "Reversal" Strategy and set a Takeprofit target.
Find the best timeframe between 1m and 30m using the backtest version.
Example here with BTCUSDTPERP on 15m:
4. AGGRESSIVE SCALPING
-> Lots of trades in low timeframes.
How it works:
Created using Cyato AI, Higher/Lower Highs and Lows and 2 HULLMA crosses as entries, and 2 Adaptive Tilson T3 as trendfilter, a 25 ADX threshold filter and a volume filter.
How to use:
Recommended Risk Management settings: Takeprofit, Stoploss and DCA (Safety orders).
Find which timeframe work the best from 30 min and below. Should not be used above 30 min since this is the resolution for the MTF Tilson.
How to create Strategy Alerts:
Write your alert messages for EXIT, LONG and SHORT orders in the settings (Backtest section).
Then click add alert, and in the alert message, write the following:
{{strategy.order.alert_message}}
BACKTEST PARAMETERS
- Inital capital: 10 000$
- Base order size: 0.1 contract (0.1 btc)
- Safety order size: 0.1 contract (0.1 btc)
- Commission: 0.1%
- Slippage: 100 ticks
Oldest trade: 2020-08-31
Backtest Period: From 2020-08-31 to 2020-11-12
Configuration used: see the live chart configuration panel at the top.
To gain access to this paid indicator, please use the link below.

Bollinger Bands and RSI mix with DCAThis strategy uses a mix of Bollinger Bands and RSI to enter long positions. It impliments DCA.

DCA CalculatorDollar Cost Averaging (DCA) is a strategy used to invest fixed amounts of money over given time intervals. It is typically used to grow an asset over time, while also reducing the risk that comes with volatility of the market.
This script was made to help make it easier to calculate Take Profit (%) when using Safety Orders on 3Commas. By using safety orders you can average down your initial investment which in turn brings down your Profit Target. A couple of the settings should look familiar if you've used 3Commas Bots before.
Input Settings
Bot Type: Select whether you are using a "Long" or "Short" bot.
Entry Price: Set this to your positions initial Entry Price.
Take Profit (%): Set this to the profit percent you are targeting.
Base Order Size: Order amount of your initial Entry.
Safety Order Size: Order amount of your first Safety Order.
Price Deviation (%): Step in percent from your initial order. This will be the deviation % of your first safety order
Safety Trades Count: Total number of safety orders to be used. Max value is currently 10.
Volume Scale: Volume of each additional safety order is multiplied by this value.
Step Scale: Step between each additional safety order is multiplied by this value.
Trading Fee (%): A fee is applied for each order that gets placed, then the total of those fees is added to the Take Profit (%). The trading fee depends on your exchange, but is typically between (0.1 to 0.15%).
Manual Safety Orders: For the manual safety orders, the checkbox will enable that specific safety order. You can set the "Entry Price" and "Order Size" of each one individually.

ETF / Stocks / Crypto - DCA Strategy v1Simple "benchmark" strategy for ETFs, Stocks and Crypto! Super-easy to implement for beginners, a DCA (dollar-cost-averaging) strategy means that you buy a fixed amount of an ETF / Stock / Crypto every several months. For instance, to DCA the S&P 500 (SPY), you could purchase $10,000 USD every 12 months, irrespective of the market price. Assuming the macro-economic conditions of the underlying country remain favourable, DCA strategies will result in capital gains over a period of many years, e.g. 10 years. DCA is the safest strategy that beginners can employ to make money in the markets, and all other types of strategies should be "benchmarked" against DCA; if your strategy cannot outperform DCA, then your strategy is useless.
Recommended Chart Settings:
Asset Class: ETF / Stocks / Crypto
Time Frame: H1 (Hourly) / D1 (Daily) / W1 (Weekly) / M1 (Monthly)
Necessary ETF Macro Conditions:
1. Country must have healthy demographics, good ratio of young > old
2. Country population must be increasing
3. Country must be experiencing price-inflation
Necessary Stock Conditions:
1. Growing revenue
2. Growing net income
3. Consistent net margins
4. Higher gross/net profit margin compared to its peers in the industry
5. Growing share holders equity
6. Current ratios > 1
7. Debt to equity ratio (compare to peers)
8. Debt servicing ratio < 30%
9. Wide economic moat
10. Products and services used daily, and will stay relevant for at least 1 decade
Necessary Crypto Conditions:
1. Honest founders
2. Competent technical co-founders
3. Fair or non-existent pre-mine
4. Solid marketing and PR
5. Legitimate use-cases / adoption
Default Robot Settings:
Contribution (USD): $10,000
Frequency (Months): 12
*Robot buys $10,000 worth of ETF, Stock, Crypto, regardless of the market price, every 12 months since its founding time.*
*Equity curve can be seen from the bottom panel*
Risk Warning:
This strategy is low-risk, however it assumes you have a long time horizon of at least 5 to 10 years. The longer your holding-period, the better your returns. The only thing the user has to keep-in-mind are the macro-economic conditions as stated above. If unsure, please stick to ETFs rather than buying individual stocks or cryptocurrencies.

Daily Risk RangesThis indictor creates daily Risk Ranges using historical volatility, volatility skew and vol-of-vol.

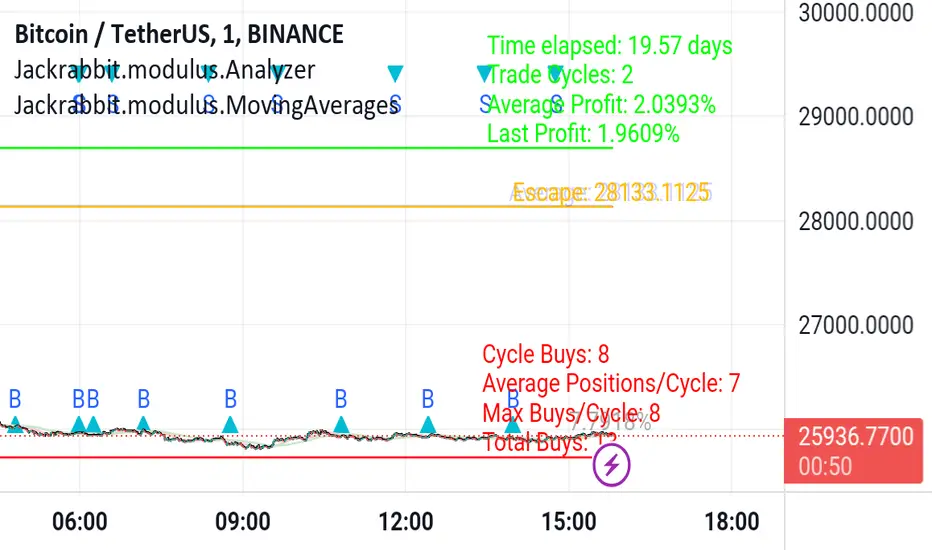
Jackrabbit.modulus.AnalyzerThis is the module Analyzer for the Jackrabbit suite and modulus framework.
As the modulus framework has grown both in size and complexity, it has become ever increasingly difficult to evaluate the profitability a very complex multi-layered modules combined.
The Jackrabbit Analyzer module allows you to do just that. Connect this module to the end of your IoI chain and it will tell you the profitability of your current combination, using TradingView's strategy backtesting capabilities.
With this module connected to your IoI chain, you can literally watch in real time as the analyzer evaluates your current settings and updates each time you make a change in those settings, giving you a better and more realistic approach to what is possible with your current strategy.
While this module is not a substitute for paper trading, it significantly increases the construction and analysis of a multi-layered trading paradigm that can then be taken to a paper trader with a high level of confidence of success.
Only the signal line is displayed.
The Jackrabbit modulus framework is a plug in play paradigm built to operate through TradingView's indicator on indicatior (IoI) functionality. As such, this script receives a signal line from the previous script in the IoI chain, and evaluates the buy/sell signals appropriate to the current analysis.
This script is by invitation only. To learn more about accessing this script, please see my signature or send me a PM. Thank you.
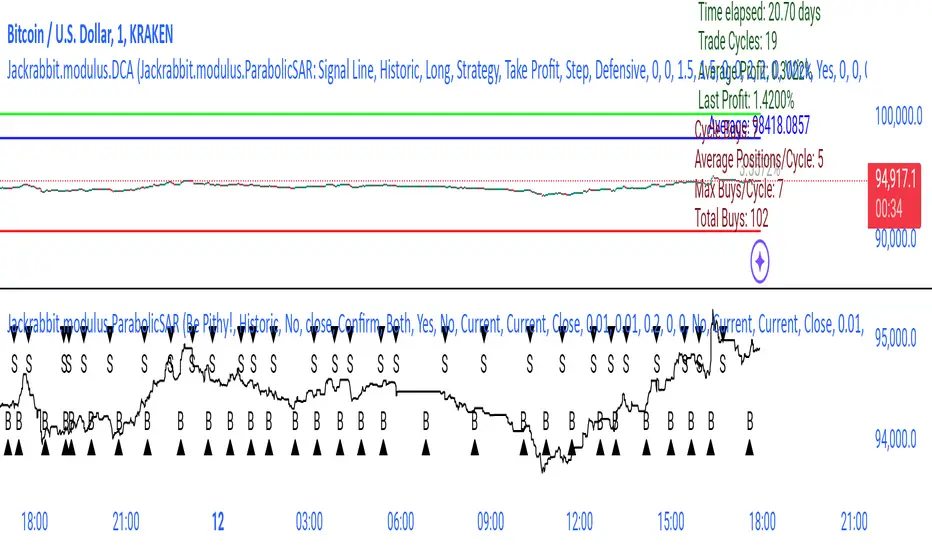
Jackrabbit.modulus.DCAThis is the Dollar Cost Averaging (DCA) for the Jackrabbit suite and modulus framework.
The blue line is the current average price of the asset.
The red line is the deviation boundary. Price action must be below this line for buys to be signaled.
The green line is the take profit. Price action must be above this line for a sell signal to be generated.
Here is a list of the settings:
Buy method: DCA or Strategy. DCA allows the module to decide buys based upon the methodology (step, price). Strategy added to the average on the basis of a buy signal from the strategy, but only when it is below the deviation and is the most organic of dollar cost averaging.
Sell Method. Take profit or Steategy. Take Profit sells the asset as soon as the price action crosses above the take profit line. Strategy sells on the basis of a sell signal, but only if it is above the take profit. Selling never occurs at a loss, with the only exception being the exit point.
Methodolgy: Step or Price. Stepping allows a fixed and uniform averaging ant percise intervals of deviation. Price is a very aggressive approach that will drive the average down on the basis of the difference between the average and the current price action. The price methodology is VERY high risk.
Take Profit, which describes the average profit percent of the combined positions.
Deviation, which describes the percent boundary for which price action must drop before additional assets are purchased.
Sideways Breaker: This algorithm breaks the sideways rut by forcing a purchase after X days, minimum 1 day.
Exit Position: Internal stop loss expressed in the number of buys.
It is important that when you establish your sell signal, ALL positions must be sold to ensure the average profit. If required, use a CLOSE ALL message provided by your platform. Also, any platform specific DCA or Safety Orders will cause losses as this script can not track their value. It is recommended that these features not be used.
The Jackrabbit modulus framework is a plug in play paradigm built to operate through TradingView's indicator on indicatior (IoI) functionality. As such, this script receives a signal line from the previous script in the IoI chain, and evaluates the buy/sell signals appropriate to the current analysis.
This script is by invitation only. To learn more about accessing this script, please see my signature or send me a PM. Thank you.
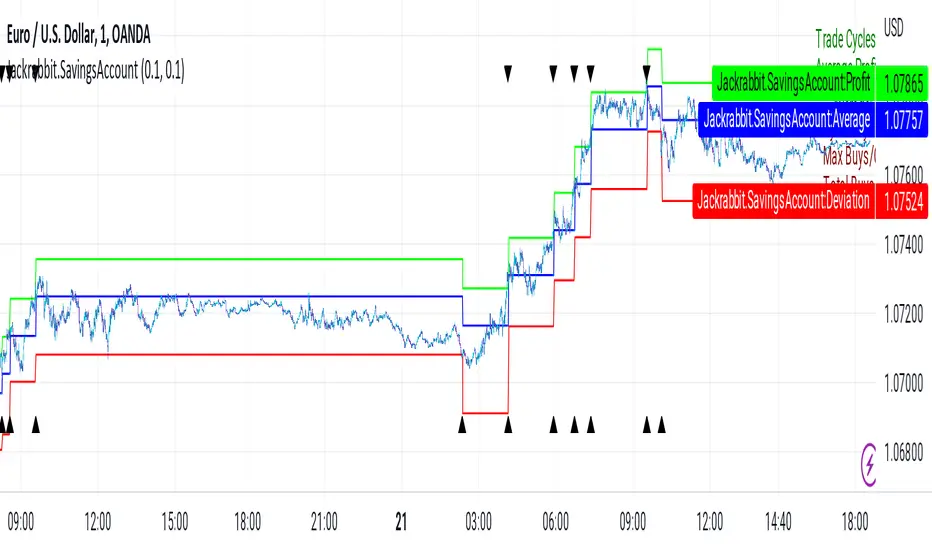
Jackrabbit.SavingsAccountThis is the Jackrabbit Savings Account. This script is designed to mimick a standard savings account and generate small amounts of profit of a daily basis. This script implements a form of dollar cost averageing (DCA) that uses a price deviation methodology.
Its primary principle is based upon my "failsafe" blueprint, which is tailored to people with little or no experience in cryptocurrencies.
This algorithm is NOT designed to win every trade, only profit from the average.
The blue line is the current average price of the asset.
The red line is the deviation boundary. Price action must be below this line for buys to be signaled.
The green line is the take profit. Price action must be above this line for a sell signal to be generated.
There are only two settings:
Take Profit, which describes the average profit percent of the combined positions, and
Deviation, which describes the percent boundary for which price action must drop before additional assets are purchased.
It is important that when you establish your sell signal, ALL positions must be sold to ensure the average profit. If required, use a CLOSE ALL message provided by your platform. Also, any platform specific DCA or Safety Orders will cause losses as this script can not track their value. It is recommended that these features not be used.
This is a standalone module and not compatible with other Jackrabbit modulus components.
This script is by invitation only. To learn more about accessing this script, please see my signature or send me a PM. Thank you.
msoro daily DCATool to estimate PnL of your investment if you put in a fixed $ amount daily into btc for past year. It takes input as 365 days which can be changed as per need.

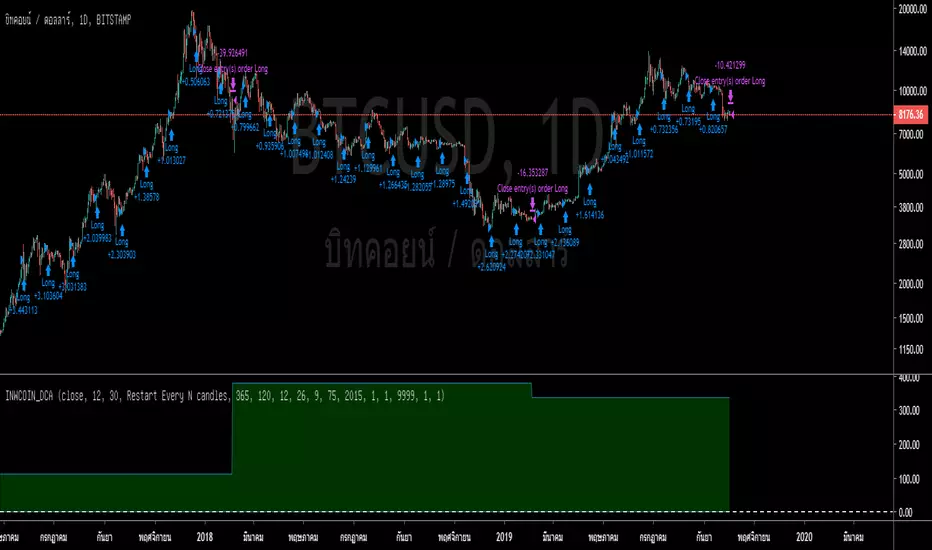
inwCoin DCA v2.0 StrategyinwCoin DCA v2.0 is the upgraded version of inwCoin DCA strategy
This strategy will show the "actual" profit/loss on the chart, since it cannot calculate by strategy result.
How to use
--------------
1) Specific "position size per entry" for each of your dca budget.
2) "Buy every N candles" is the trigger for strategy to "buy" the asset, it depend on your timeframe on chart. If you want to let it buy every 7 days, set timeframe to daily and set this value to 7.
3) Entry/Exit filter is the condition for you to continue dca buy or stop when some condition met.
3.1) Restart every N candles = the strategy will sell all of your dca position to realize profit/loss every N candles specific in "Reset at N candles" parameter.
3.2) Price above EMA = IF price above specific "Slow EMA length" value, the strategy will dca buy, else, it will sell to realize profit/loss.
3.3) Price above MA = same as 3.2 but use MA instead.
3.4) Price above WMA = same as 3.2 but use WMA instead.
3.5) MACD Above zero = will buy if MACD > 0 and sell all if MACD < 0. Set MACD value in 3 boxes below.
4) Close position at specific profit % = self explanatory
5) Close remaining position at last bar = self explanatory
6) Date = self explanatory
How to read result
================
Everything in result are self explanatory.
Have fun!

BEST Dollar Cost AverageHello traders
This is an upgraded version of my Dollar Cost Average (Data Window) script
1 - What is Dollar-Cost Averaging ( DCA )?
Dollar-Cost Averaging is a strategy that allows an investor to buy the same dollar amount of investment at regular intervals. The purchases occur regardless of the asset's price.
I hope you're hungry because that one is a biggie and gave me a few headaches. Happy that it's getting out of my way finally and I can offer it
🔸 This indicator will analyze for the defined date range, how a dollar-cost average ( DCA ) method would have performed (green panel) versus investing all the hard earnt money at the beginning (orange panel)
=> green versus orange
2- What's on the menu today?
My indicator works with all asset classes and with the daily/weekly/monthly inputs.
⚠️⚠️⚠️ However, results are only visible on the DAILY timeframe chart
As always, let's review quickly the different fields so that you'll understand how to use it (and I won't get spammed with questions in DM ^^)
🔸 Use current resolution: if checked will use the resolution of the chart
🔸 The timeframe used for DCA: different timeframe to be used if Use current resolution is unchecked
🔸 Amount invested in your local currency: The amount in Fiat money that will be invested at each period selected above
🔸 Starting Date
🔸 Ending Date
🔹 The script screenshot shows a DCA with 100 USD invested daily from 01.01.2017 to 01.28.2020
3- Bonus (DATA WINDOW)
🔸 Please check this screenshot to understand what you're supposed to see: Data window
And a quick video that I did months ago explaining how we can use this data window effectively
4 - Specifications used
I got the idea from this website dcabtc.com and the result shown by this website and my indicator are very interesting in general and for your own trading
The formula used for the DCA calculation is the one from the Investopedia website.
Best regards and best of luck
Dave

Blockchain Fundamentals - Satoshies Per Dollar by Cryptorhythms🔗Blockchain Fundamentals - Satoshis Per Dollar by Cryptorhythms
Intro
SPD is a new metric I propose which can be used to determine general sentiment and help narrow down periods to DCA .
Description
In the most basic sense this indicator is simply showing you how many satoshies are equal to one US dollar . This can be a useful metric to keep stored in the back of your mind. It can also give you a new satoshi based perspective on bitcoin pricing.
I simply added an MA selection option to give a basic sentiment reading. You could also use the red areas as a modified DCA (i.e. only do dollar cost averaging when red zone is in effect.
The indicator is not really meant for buy/sell signaling but more as a reference
👍 We hope you enjoyed this indicator and find it useful! We post free crypto analysis, strategies and indicators regularly. This is our 71st script on Tradingview!
💬Check my Signature for other information

Risk indicator 50DSMA/50WSMAIndicates buy and sell zones, intended to be used along with your scaling-in scaling-out strategy.
Example: sell 20% of holdings in first sell zone, sell another 20% in the second zone, etc.

inwCoin DCA Strategy=========================
English
=========================
Just simple strategy idea for DCA bitcoin with different conditions.
Also, this is for education purpose and not the investing advise.
Use it as your own risk.
-----------
Concept
-----------
DCA with options as following ( only important option )
** Please use only in Daily TF **
Bullets Count : Amount of bullets for DCA period. If you want to DCA every months for 2 years ( close all position every 2 years ), your bullets value should be 24.
Buy every N candles : Number of candle you want to let this strategy trigger buy, 1 candle = 1 day so if you want to buy every month, input 30.
Entry / Exit filter : Dropdown to filter trade. If you don't want to DCA in downtrend, make sure to select this option. The simple trend filter is EMA 120 daily
Reset at candle N : One of DCA weak point is...no taking profit target in sight. So this option will force to take profit at N candle. You can try 1 year ( 365 ) or 2 years ( 730 )
==========================
Thai
==========================
Strategy สำหรับ backtest การ DCA ในรูปแบบต่างๆ ครับ โดยมี parameter ดังต่อไปนี้
** ควรใช้สำหรับ Timeframe Daily เท่านั้น **
Price : เป็นข้อมูลที่จะดึงมาคำนวณ ว่าจะเอาข้อมูลไหนจากแท่งเทียนมาคิด ปกติเลือก close แต่ถ้าไม่อยากให้ repaint ก็เลือก open
Bullets Count : จำนวนไม้ ที่เราจะเอามาเข้าซื้อ อย่างเช่น ถ้าจะซื้อเดือนละครั้ง และจะปิดยอดทุกๆ ปี ก็ให้ใส่ 12 ลงไป หรือถ้าเราอยากจะปิดยอดทุกๆ 2 ปี ก็ใส่ 48 เป็นต้น
Buy every N candles : จำนวนแท่งเทียนที่เราอยากจะซื้อ เช่นถ้าซื้อทุกเดือนก็ใส่ 30 ถ้าจะให้ซื้อทุกสัปดาห์ก็ใส่ 7 เป็นต้น
Entry/Exit Filter : ตัวกรองเงื่อนไขการเข้า ค่า default คือไม่กรอง แต่ถ้าจะกรอง ก็มีสองช้อยให้เลือก คือ
* กรองจาก EMA โดยจะใส่ length ของ EMA ที่ช่องด้านล่าง
* กรองจาก MACD cross 0 โดยจะใส่ รายละเอียดของ MACD ที่ช่องด้านล่าง
Reset at candle N : จะทำการขายปิดยอดที่แท่งเทียนที่เท่าไหร่ ถ้าจะปิดยอดทุกๆ ปีก็ใส่ 365 ถ้าจะปิดทุกๆ 2 ปี ก็ใส่ 730 และถ้าแก้ค่านี้ ก็อย่าลืมไปปรับ bullet count ให้สอดคล้องกันด้วย
Slow EMA Length : ตามนั้น ควรใช้ 120 เพราะ BTC ชอบค่านี้ แต่จะปรับเท่าไหร่ก็ได้แล้วแต่
Fast / Slow / MACD length : ค่าที่ใช้คำนวณ MACD ปกติจะเป็น 12,26,9
==========
Optional
==========
Close position at specific profit% : ถ้าติ๊กตรงนี้ มันจะทำการขายออก ถ้ากำไรเราได้ถึงช่องข้างล่าง
Reset at profit% : กรอก % ที่อยากจะให้ระบบขายไม้ DCA ออก ถ้ากำไรถึงเป้านี้
Close remaining position at last bar : จะทำการสรุปยอดและรับรู้กำไร ที่แท่งสุดท้าย จะใช้เพื่อลองดูประสิทธิภาพของ strategy
Exclude profit from capital : ไม่เอากำไร กลับเข้ามารวมในเงินทุนตอนแรก ( ลดการ Drawdown ได้เยอะอยู่ )
ที่เหลือเป็นตั้งช่วงที่จะ backtest ก็ไม่ยากอะไร
===========
วิธีใช้งาน
===========
เอาใส่กราฟ ก็จะเห็นผล backtest เลย แต่ถ้าอยากลองเล่นโน่นนี่นั่น ก็ลองปรับค่าไปเรื่อยๆ ดู
ตัวอย่างการตั้งค่า
============
* อยาก DCA แบบ เก็บกำไร สองปีครั้ง และแบ่งเป็น 24 ไม้ ( ทุน หาร 24 ) และซื้อทุกเดือน
Bullets Count = 24
Buy every N candles = 30
Reset at candle N = 730
* อยาก DCA ย้อนหลัง 5 ปี แบบไม่เก็บกำไรเลย มาเก็บเอาวันสุดท้าย และซื้อทุกเดือน
Bullets Count = 60 ( คือ 12 x 5 )
Buy every N candles = 30
Reset at candle N = 1825 ( คือ 365 x 5 )
From year : 2014
msoro daily $1 DCAPlots the dollar value of total btc accrued over the past year by buying 1 dollar's worth daily.
Black line is the breakeven level.

Dollar Cost Average (Data Window Edition)Hi everyone
Hope you had a nice weekend and you're all excited for the week to come. At least I am (thanks to a few coffee but that still counts !!!)
This indicator is inspired from Dollar-Cost-Average-Cost-Basis
EDUCATIONAL POST
The educational post is coming a bit later this afternoon explaining how to use the indicator so I would advise to follow me so that you'll get updated in real-time :) (shameless self-advertising)
1 - What is Dollar-Cost Averaging (DCA)?
Dollar-Cost Averaging is a strategy that allows an investor to buy the same dollar amount of an investment on regular intervals. The purchases occur regardless of the asset's price.
I hope you're hungry because that one is a biggie and gave me a few headaches. Happy that it's getting out of my way finally and I can offer it
This indicator will analyse for the defined date range, how a dollar cost average (DCA) method would have performed vs investing all the hard earnt money at the beginning
2- What's on the menu today ?
Please check this screenshot to understand what you're supposed to see : CLICK ME I'M A SCREENSHOT (I'll repeat this URL one more time below as I noticed some don't read the information on my description and then will come pinging me saying "sir me no understand your indicator, itz buggy sir"
(yes I finally thought about a way to share screenshots on TradingView, took me 4 weeks, I'm slow to understand things apparently)
My indicator works with all asset classes and with the daily/weekly/monthly timeframes
As always, let's review quickly the different fields so that you'll understand how to use it (and I won't get spammed with questions in DM ^^)
- Use current resolution : if checked will use the resolution of the chart
- Timeframe used for DCA : different timeframe to be used if Use current resolution is unchecked
- Amount invested in your local currency : The amount in Fiat money that will be invested at each period selected above
- Starting Date
- Ending Date
- Select a candle level for the desired timeframe : If you want to use the open or close of the selected period above. Might make a diffence when the timeframe is weekly or monthly
3 - Specifications used
I got the idea from this website dcabtc.com and the result shown by this website and my indicator are very interesting in general and for your own trading
The formula used for the DCA calculation is that one : Investopedia Dollar Cost Average
4 - How to interpret the results
"But sir which results ??"...... those ones : CLICK ME I'M A SCREENSHOT :) (strike #2 with the screenshot)
It will draw all the plots and will give you some nice data to analyze in the Data Window section of TradingView
I'm not completely satisfied with the tool yet but the results are very closed to the dcabtc website mentioned above
If you're trading a very bullish asset class (who said crypto ?), it's very interesting to see what a DCA strategy could bring in term of performance. But DCA is not magic, there is a time component which is the day/week/month you'll start to invest (those who invested in crypto beginning of 2018 in altcoins know what I'm talking about and ..............will hate me for this joke)
5 - What's next ?
As said, the educational post is coming next but not only.
Will probably post a strategy tomorrow using this indicator so that you can compare what's performing best between your trading and a dollar cost average method
I'll publish as a protected source this time a more advanced version of that one including DCA forecasts
6 - Suggested alternative (but I'll you doing it)
If you don't want to have this panel in the bottom with the plots and analyze the results in the data window, you can always create an infopanel like shown here Risk-Reward-InfoPanel/ and display all the data there
Hope you'll like it, like me, love it, love me, tip me :)
____________________________________________________________
Feel free to hit the thumbs up as it shows me that I'm not doing this for nothing and will motivate to deliver more quality content in the future. (Meaning... a few likes only = no indicators = Dave enjoying the beach)
- I'm an offically approved PineEditor/LUA/MT4 approved mentor on codementor. You can request a coaching with me if you want and I'll teach you how to build kick-ass indicators and strategies
Jump on a 1 to 1 coaching with me
- You can also hire for a custom dev of your indicator/strategy/bot/chrome extension/python

Dollar Cost Average [lorencip]This indicator shows the return of a dollar cost average strategy.
The 4 values in the output are:
the amount of the investment
the number of items purchased for that symbol
the total value of the items purchased
the result of the investment in percentage
This first version works with cryptocurrencies and currencies, it's not accurate for stocks (it "purchases" decimals of a share/stock).
Lorenzo Cipriani

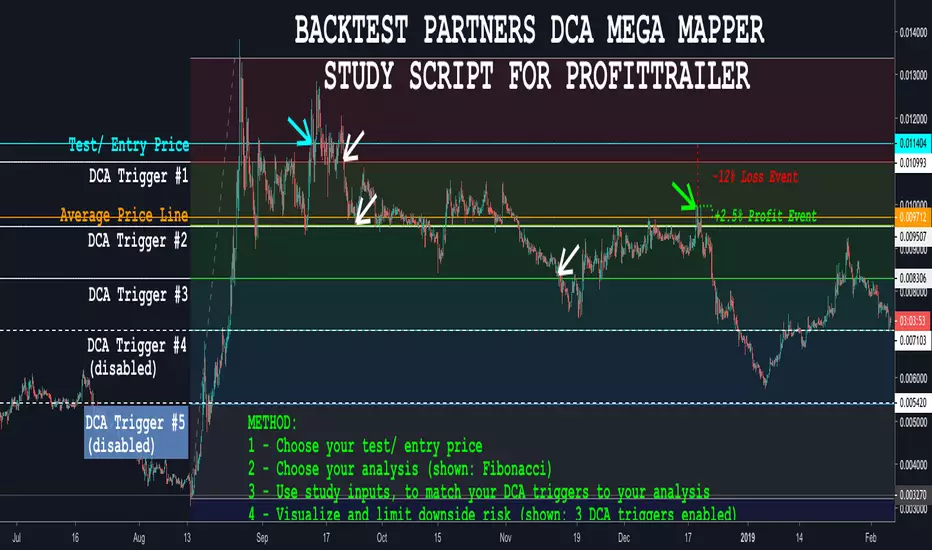
BACKTEST PARTNERS DCA MEGA MAPPER STUDY SCRIPT FOR PROFITTRAILERBacktest Partners Mega Mapper (BPMM) is an advanced DCA analysis script, allowing cryptocurrency traders to sync their ProfitTrailer trading bot buy levels, triggers and order sizes with their technical analysis charting results in TradingView.
For a complete functional demo, and to learn more about subscribing to this invite-only script, please visit us at backtest.partners