2 Ema Pullback StrategyHi everyone!
CAUTION... This is only an indicator. Do not rely 100% on it.
I made this indicator hoping to help everyone with this specific Pull Back Scalping Strategy.
RULES:
Time Chart of 5minuts
LONG Condition - "EMA Red Line" below the "EMA Blue Line" and wait for a green long signal.
SHORT Condition - "EMA Red Line" below the "EMA Blue Line" and wait for a red short signal
Feel free to add any adjustments or give feedback so we can improve.
The strategy idea and guidelines came from "The Master" Juan Luis.
Autor: © Germangroa
Doppia media mobile esponenziale (DEMA)

Price Action Signals V2Indicator that shows buy/sell signals based on price action and volume as it relates to a double EMA. If the candle is above the double EMA, we look for candles with long wicks on the top indicating selling pressure. If the candle is below the double EMA , we look for candles with a long bottom wick indicating buying pressure. The user defined parameters are the length of the double EMA and the length of the volume moving average. Lower timeframes such as 5 minutes and lower are better off using lower lengths while higher timeframes should user higher lengths. Your mileage will vary.
Note, while this indicator can signal the beginning of long term trends, it will also signal minor retracements. Do not blindly buy or sell based on a signal appearing, pay attention to where the candle is in the overall trend and wait for confirmation to avoid losses.
2 EMA PullbackHi everyone!
CAUTION... This is only an indicator. Do not rely 100% on it.
I made this indicator hoping to help everyone with this specific Pull Back Scalping Strategy.
RULES:
Time Chart of 5minuts
Long Condition - "EMA Red Line" below the "EMA Blue Line" and wait for a green long signal.
Short Condition - "EMA Red Line" below the "EMA Blue Line" and wait for a red short signal
Feel free to add any adjustments or give feedback so we can improve.
The strategy idea and guidelines came from the "Master Juan Luis"
Autor: © Germangroa
Dragon Multi Moving Averages With labelThis script is for a many?! moving average strategy where the user can select from different types of moving averages, price sources, lookback periods and resolutions.
Features:
- 6 Moving Averages with variable MA types, periods, price sources, resolutions and the ability to disable each individually. Tow of moving averages are disable by default. you can enabel it
- Crossovers are plotted on the chart with detailed information regarding the crossover (Ex: 50 EMA crossed over 100 EMA ). there is only between 1-2, 2-3, 3-4, 4-5, 5-6 moving average cross label.
- Ribbons added and on by default. Optional setting to disable the ribbons. 5 ribbons between MA3 and MA4 and another 5 between MA4 and MA5 and another 5 between MA5 and MA6.

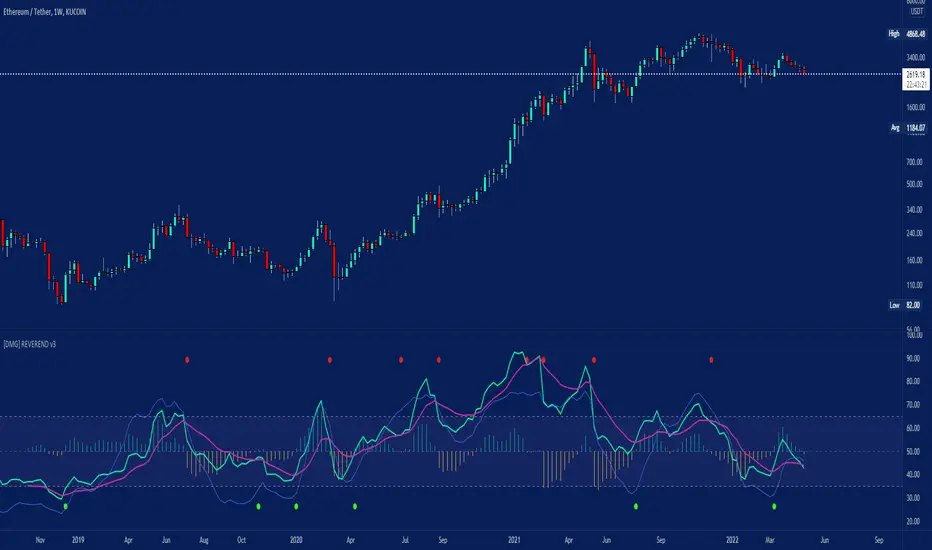
[DMG] REVEREND v2REVEREND (RSI based Trend Reversal Indicator)
Info:
This is an RSI based convergence divergence (like MACD) indicator using SMAs or DEMAs for smoothing.
You can optionally filter the signals with the stochastic momentum indicator (SMI) levels or via simple overbought/oversold RSI levels.
Signals:
Purple is the Slow MA, Green is the Fast MA, Blue is the SMI (Momentum).
Buy and Sell signals are shown as circles (yellow on top sell, green on bottom buy)
The histogram is for easier differentiation (like macd) zero crossings creating the signals.
Usage:
Settings can never be perfect for any indicator, defaults should be good for BTC, ETH.
Sell signals should be taken with falling momentum, buys with rising momentum.
Watch out for false signals if Momentum is still rising while it prints a sell signal it is most likely false, you can filter these by using longer MAs but then it becomes more lagging.
A sufficiently fast fast-MA can be used for tracking RSI itself and since it also displays the stoch. momentum signal you can also check for divergences yourself or anticipate moves by their slope.
This is my main indicator for a year now and I wish I had followed it more ;) I additionally use EMAs, VWAP, Divergences and Volume Indicators, just remember price is king.
If you have questions or additional ideas I'd be happy to read them!
Good Luck! :D


Triple SWMA + EMA Crossover Color Candle+ ADX Color Candle V2! IMPORTANT !
To better see the color of the bars I suggest you deactivate the Borders option in the chart settings / Symbol, LIKE THIS:
════════════════════════════════════════════════════════════════════════════════════════════════════════════════════
The indicator is the same as the previous version, with the only difference that now the indicator is composed of an addition of secondary candles colored according to the EMA cross, while the main candles based on the ADX, the SWMA are inserted into secondary candles
════════════════════════════════════════════════════════════════════════════════════════════════════════════════════
1) SWMA
There are 3 SWMA , with the possibility of modifying the Source and the length of each one, also each SWMA can be removed or can all of them be removed with the ON / OFF option in Inputs-STYLE. (ALL SWMA?)
════════════════════════════════════════════════════════════════════════════════════════════════════════════════════
2) EMA Fast and Slow, Cross
There are two EMAs, fast and slow, both with the possibility of changing the source and length, in the chart settings it is possible to change the color of EMA Long and EMA Short:
EMA Long = Ema Fast > Ema Slow
EMA Short = Ema Slow > Ema Fast
Ema cross has a style choice option, the possible choices are:
NONE = nothing
ALL = all choices
LINE = ema200 colored based on Ema Long-Short
BAR COLOR = color candles based on Ema Long-Short
PLOTSHAPE = signals based on Ema Long-Short
LINE + BAR COLOR = line + bar color
BAR COLOR + PLOTSHAPE = bar color + plotshape
════════════════════════════════════════════════════════════════════════════════════════════════════════════════════
3) ADX Candle
The candles are colored according to 4 inputs:
Color 1 ( Silver ) = ADX < 20
Color 2 (Black) = ADX cross-ADX Index (adx+adx 14 period back) / 2
Color 3 (Lime) = ADX > 0 and DI delta (DI plus - DI minus) > 0
Color 4 (Red) = ADX > 0 and DI delta (DI plus - DI minus) < 0
all colors are editable and if you don't want to have ADX Candle on the chart, just remove the ON / OFF option in Inputs-STYLE. (BAR COLOR ADX )

Triple SWMA + EMA Crossover Color Candle+ ADX Color CandleIMPORTANT
The indicator allows you to view the Color Bars only if it is in the foreground, to do this just put the indicator before the description of the symbol, LIKE THIS:
════════════════════════════════════════════════════════════════════════════════════════════════════════════════════════════════
This indicator is composed of:
1) Tiple SWMA
There are 3 SWMA, with the possibility of modifying the Source and the length of each one, also each SWMA can be removed or can all of them be removed with the ON / OFF option in Inputs-STYLE. (ALL SWMA?)
════════════════════════════════════════════════════════════════════════════════════════════════════════════════════════════════
2) EMA Fast and Slow, Cross
There are two EMAs, fast and slow, both with the possibility of changing the source and length, in the chart settings it is possible to change the color of EMA Long and EMA Short
EMA Long = Ema Fast > Ema Slow
EMA Short = Ema Slow > Ema Fast
Ema cross has a style choice option, the possible choices are:
ALL = all choices
LINE = ema200 colored based on Ema Long-Short
BAR COLOR = color candles based on Ema Long-Short
PLOTSHAPE = signals based on Ema Long-Short
LINE + BAR COLOR = line + bar color
BAR COLOR + PLOTSHAPE = bar color + plotshape
if you don't want to have EMA Fast and Slow, Cross on the chart, just remove the ON / OFF option in Inputs-STYLE. (EMA style)
════════════════════════════════════════════════════════════════════════════════════════════════════════════════════════════════
3) ADX Candle
The candles are colored according to 4 inputs:
Color 1 (Silver) = ADX < 20
Color 2 (Black) = ADX cross-ADX Index (adx+adx 14 period back) / 2
Color 3 (Lime) = ADX > 0 and DI delta (DI plus - DI minus) > 0
Colo 4 (Red) = ADX > 0 and DI delta (DI plus - DI minus) < 0
all colors are editable and if you don't want to have ADX Candle on the chart, just remove the ON / OFF option in Inputs-STYLE. (BAR COLOR ADX)

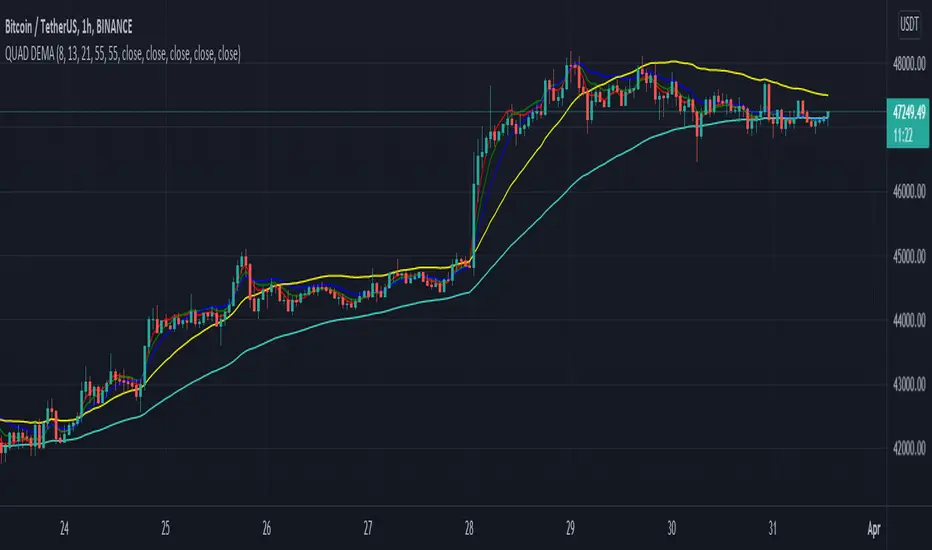
QUAD DEMAHey Folks,
Just created my first script, It's basically 4 DEMA in one indicator which helps you not to use multiple indicators.
It's more accurate than Exponential Moving Average & give signals much prior to the breakout, very helpful in short timeframes.
Tweak it according to your preference
Instructions to use
-When 55 DEMA crosses all the DEMA it's a clear signal for uptrend or downtrend which can potentially be a entry or exit points.
-Don't depend on this when all the DEMA's are entangled to each other.
-Use Stochastic RSI for better approach in entry.
-Most accurate in 1hr time frame for short term entry.
Enjoy!
HBDC Multiple EMAMultiple EMA indicator for trading view
This indicator can plot 6 emas using 1 indicator

EMA 9 + ALMA 20 + BB 50 .2COMBINATION OF EMA, ALMA,BB50 .2
Protected script
This script is published closed-source and you may use it freely. You can favorite it to use it on a chart. You cannot view or modify its source code.
Disclaimer
The information and publications are not meant to be, and do not constitute, financial, investment, trading, or other types of advice or recommendations supplied or endorsed by TradingView. Read more in the Terms of Use.

ema gksthis strategy is very simple scripting to buy and sell based on crossover of exponential moving averages
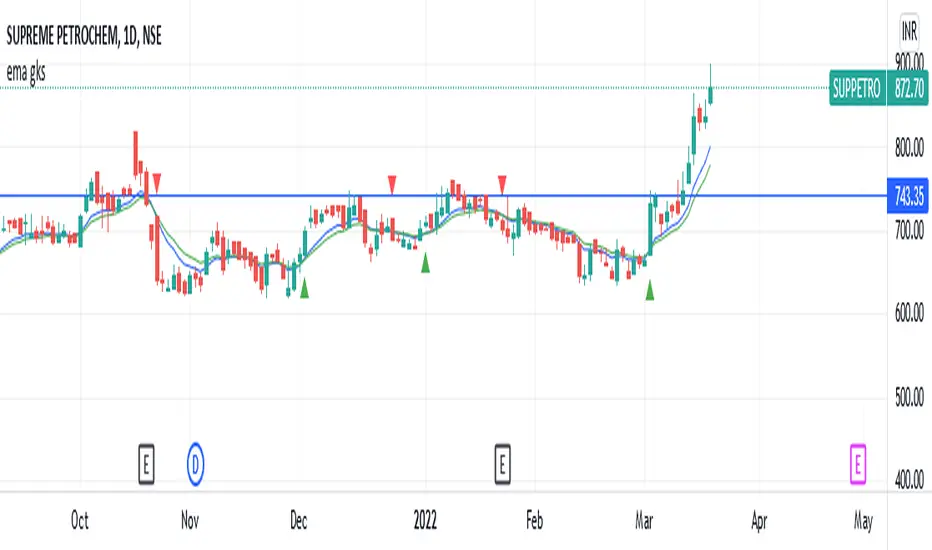
ema_gkstesting my first script
this strategy is very simple scripting to buy and sell based on crossover of exponential moving averages

AR Peti Kemas Candle Cross EMA8 EMA13 EMA21 EMA55 EMA90 EMA200This is implementation of Peti Kemas. Slighly modified for the selection of EMA period, but user can change the period.
The strategy is if the current candle close is below EMA90 and EMA200, the buy signal is generated when the close crosses up EMA13.
When the close above EMA90 and ENA200, then the buy signal is generated when the close crosses up EMA8

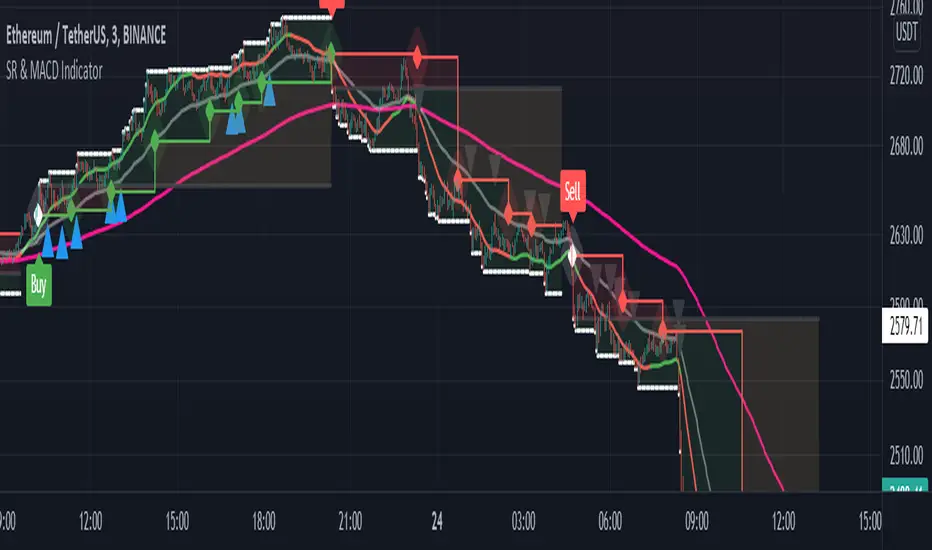
Support and Resistance with MACD IndicatorOriginal script from ©akpaswaniitk. I just added MACD to filter out bad trades and alert function so that we get notified whenever indicator gives us an entry signal. Most of the false breakout has been removed but the remaining ones only pop up during consolidation, so it's wait for the retest before entry. Works better in continuous market. Also look at the color of EMA for further confirmation, only focus on buy side when EMA is green and sell when EMA is red or when after the buy signal EMA changes color from red to green. These are the highly profitable setups I've found with this indicator.
Signals
Red or Green solid line with diamond are trailing stoploses
dotted black line is entry level
dotted white line is optimal exit
Titan EMA Averaging Strategy - (DYOR) By MrCryptoTitan EMA Averaging Strategy (VIP Only) Enable Longs or Shorts only Works With Crypto + Forex with correct back tested settings This is not set and forget. This requires you to back test and have relevant Risk Management in place.
The Strategy: The script uses 3EMA with engulfing candle to enter a trade in either short or long direction.
You will need to test the settings and adjust them so there isn't too many - re-entries and make sure you take profit big enough to not trigger on same candle.
When setting alerts you can use once per bar however this may trigger multiple alerts if the candle is moving very fast so this is not recommended. So doing once per bar close will mean entry is confirmed as bar is closed. You will need to select this in drop down menu.
- Max Trade Limit.
- All in one Alert. - Basically add syntax for example- Long/Take Profit/Re-entry/Emergency Stop. Then add one alert and select "Alert() function calls Only" Change Alert name to custom. That's it.
-Built-in Strategy tester.
- Trade Filter - Multi-MA Filters. - MA", "EMA", "WMA", "HullMA", "VWMA", "RMA", "DEMA", "TEMA", VWAP
- ADX Filter based on Level.
Please note when running this strategy you can only trade longs only or shorts only for this setup to be potentially profitable. Also note that setting unrealistic profit targets will make a loss. So it is very important to back test everything.
This Script does not use any Security functions. All indicators which are used part of the strategy are obtained from Trading View indicator Library and have source code has been changed to make this into Strategy.
Please Do Your Own Research before using this.
Anymore information please DM me directly

action zone - ATR stop reverse order strategy v0.1 by 9nckACTION ZONE-ATR MOD v0.1 DOCUMENTATION
Overview
This tradingview pine script strategy is mainly created to enrich my coding skill. It is a combination of “CDC-ACTIONZONE” and my personal studies of trading techniques in various sources e.g.book, course or blog. This strategy purposefully built to connect with my automatic trading bot. However, It will be very useful to aid your trading routine by diminishing mental distraction which possibly leads to bad trades.
How does it work?
This strategy will do a basic simple thing that most traders do by creating entry signals on both sides long/short and also set the stop loss. Furthermore, It will also reverse the order (from long to short and vice versa (if long/short conditions are met). Finally, it will recalculate the stop loss/take profit price in every complete bar to increase the chance of winning and limit our loss.
Entry rules(Long/Short)
If you have no open order, an order will be created when a fast EMA crosses(up(long)/down(short) the slow EMA(It’s as simple as that).
If you have an open order, the current order will be (sold if long, covered if short) and the opposite side order will be created.
Exit and Reverse rules(Long/Short)
If fast EMA cross (DOWN(long), UP(short)), the current order will be closed, THE OPPOSITE SIDE ORDER WILL ALSO BE CREATED.
Risk management
FLEX STOP PRICE : initial value will be set at the bar which order created. It is a fast ema (+/-) MIDDLE ATR value.
If MIDDLE ATR value rises, it will be our new stop price.
If MIDDLE ATR value falls, stop price unchanged
If Price OVERBOUGHT(long)/SOLD(short), LOW of that bar will be a new stop price.
Minimum position hold period
In order to eliminate risk of repeatedly open, close orders in sideway trends. Minimum hold period must be passed to start exit our position. However, It always respects stop loss prices. The value refers to the number of bars.
MUST READ!!!
This strategy uses only MARKET ORDER. If you trade with a bot, make sure you choose only enormous market cap tokens.
This strategy is bi-direction strategy. It will work best in the DERIVATIVE market.
It was initially designed to compete in the cryptocurrency market which has very high volume and volatility.
I only use this strategy in 1HR (acceptable change rate, optimum trade frequency)
How (should) we use it?
Choose crypto future pairs (recommend only top 10-15 market volume pairs in Binance, let’s say 1000M+ trade value)
Choose your time frame (1H is strongly recommended)
Setup your portfolio profile (Setting->Properties) such as Initial cap, order size, commission. DO NOT USE CAL ON EVERY TICK IT WILL CAUSE REPAINTING AND YOUR CAPITAL IS BLEEDING !!!
BACKTEST FIRST!! Back test is a combination of art, math and statis(and a bit of luck). You can apply to train and test methods or whatever you are familiar with. In my opinion, your test period should include UPTREND, SIDEWAY, DOWNTREND. Fine tune fast, slow ema first(my best ema length of 1H timeframe around 7-10, 17-22). Try to eliminate fault breakout trade and use other options only necessary. Hopefully we can use automatic optimization on Pine Script soon.
Don’t forget to turn off using a specific backtest date option to start your strategy.A
THIS IS NOT A PERFECT (OR EVEN PROFITABLE) STRATEGY. USE AT YOUR OWN RISK AND TRADE RESPONSIBLY. DYOR DUDE.

3 EMA/SMA + Colored Candles[C2Trends]// Indicator Features:
// 1) 3 Exponential Moving Averages and 3 Simple Moving Averages.
// 2) Additional EMA input for colored candles(EMA is hidden from chart, input used for coloring of candles only)
// 3) Turn colored candles on/off from main input tab of indicator settings.
// 4) Turn SMA's and EMA's on/off from main input tab of indicator settings.
// 5) Select single color or 2 color EMA and SMA lines from main input tab of indicator settings.
// Indicator Notes:
// 1) 'Candle EMA' input is the trend lookback period for the price candle colors. When price is above desired Candle EMA, price candles will color green. When price is below the Candle EMA, price candles will color fuchsia.
// 2) If you are using another indicator that colors the price candles it may overlap the candle colors applied by this indicator. Trying hiding or removing other indicators to troubleshoot if having candle color issues.
// 3) Using 2-color price moving averages: when price is above an average the average will color green, when price is below an average the average will color fuchsia.
AI Crypto Signals BTCUSD 15m Ultimate ScriptBYBIT:BTCUSD
Hello everyone! Sky First Capital in partnership with AI Crypto Signals is proud to introduce the AI Crypto Signals 15M BTCUSD Ultimate Script . This script works well on the 15M, 30M, 45M and 1HR chart using traditional candles. This means no false data or inaccurate entry/exit points such as with the ones using HA candles.
The script is based upon an initial strategy developed by user Bunghole here on TradingView, but we have optimized it, back-tested it with ideal settings, and added alerts that you can use to connect with your trading bot such as Alertatron, Cornix, etc. This script uses BB (Bollinger Bands) and RSI (Relative Strength Index) as indicators for signals.
Back-testing data for the 15M chart from 7/1/2021 to 10/15/2021 showed a 51.19% profit.
Back-testing data for the 1HR chart from 7/1/2021 to 10/15/2021 showed a 191% profit.
This script does not repaint.
Ideal use is to enter and exit at the close of the candle and take-profit/stop-loss once per candle.
This script has Entry/Exit/Take-Profit/Stop-Loss alerts.
We offer consulting and training services if you need help on using this script or getting it configured with an automated trading system.
We offer a 24 hour free trial of the script, send us a message to request access.

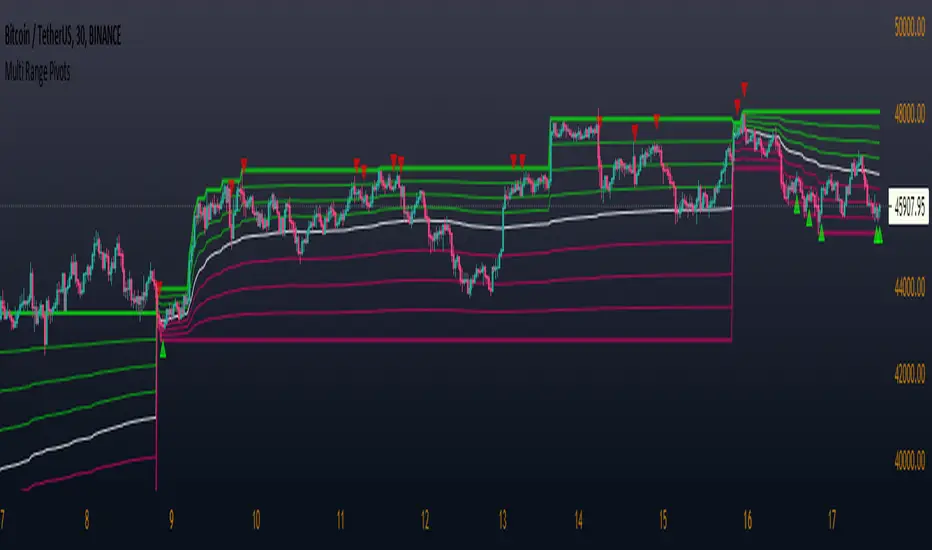
Multi Range Pivots
Multi Range Pivots works by recognizing the high and low of the timeframe selected and plotting range high to MEAN averages and range low to MEAN averages.
This is essentially the VWAP pivots updated to include not only VWAP as a MEAN, but also SMA, EMA, VWMA, DEMA, TEMA, TRIMA, KAMA, MAMA, T3, H/L basis and Donchian basis.
Also, with high and low no longer repainting, I was able to add true reliable signals.
Enjoy