SST Table NewData Table for Update GTT Orders in Stocks....
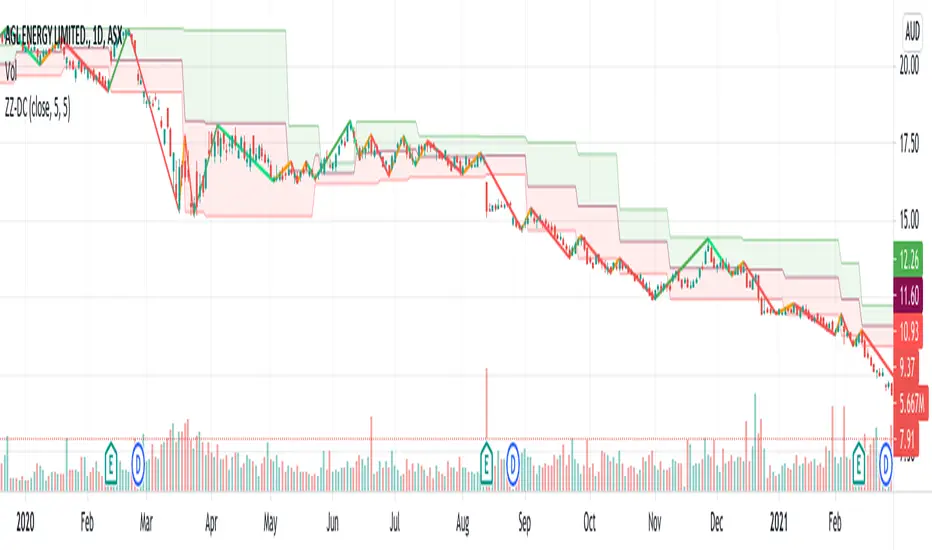
Updated GTT Order details for SST , also added Relative Strength of Stock compared with NIFTY Index for 55 Days (3 Months) period.
RS line plotted on chart… taken reference of close price of day candle… just a bigger picture of actual RS indicator plotted on chart itself... RS line in red color means below zero line (negative) and green color means above zero line (positive).
Added code for checking RS value on chart for any previous day.
Canali Donchian (DC)

Jurik Filtered, Composite Fractal Behavior (CFB) Channels [Loxx]Double Jurik-Filtered Composite Fractal Behavior (CFB) Channels is a channel indicator that acts as both a baseline, similar to Donchian, and as support and resistance levels. This indicator is price time adaptive meaning it flexes to price volatility waves. The indicators adaptive nature is calculated using the Composite Fractal Behavior (CFB) algorithm. The result of this adaptive calculation is then smoothed using Jurik Filtering, and then it's normalized to conform to a range of values. This helps better identify trends.
What is Composite Fractal Behavior (CFB)?
All around you mechanisms adjust themselves to their environment. From simple thermostats that react to air temperature to computer chips in modern cars that respond to changes in engine temperature, r.p.m.'s, torque, and throttle position. It was only a matter of time before fast desktop computers applied the mathematics of self-adjustment to systems that trade the financial markets.
Unlike basic systems with fixed formulas, an adaptive system adjusts its own equations. For example, start with a basic channel breakout system that uses the highest closing price of the last N bars as a threshold for detecting breakouts on the up side. An adaptive and improved version of this system would adjust N according to market conditions, such as momentum, price volatility or acceleration.
Since many systems are based directly or indirectly on cycles, another useful measure of market condition is the periodic length of a price chart's dominant cycle, (DC), that cycle with the greatest influence on price action.
The utility of this new DC measure was noted by author Murray Ruggiero in the January '96 issue of Futures Magazine. In it. Mr. Ruggiero used it to adaptive adjust the value of N in a channel breakout system. He then simulated trading 15 years of D-Mark futures in order to compare its performance to a similar system that had a fixed optimal value of N. The adaptive version produced 20% more profit!
This DC index utilized the popular MESA algorithm (a formulation by John Ehlers adapted from Burg's maximum entropy algorithm, MEM). Unfortunately, the DC approach is problematic when the market has no real dominant cycle momentum, because the mathematics will produce a value whether or not one actually exists! Therefore, we developed a proprietary indicator that does not presuppose the presence of market cycles. It's called CFB (Composite Fractal Behavior) and it works well whether or not the market is cyclic.
CFB examines price action for a particular fractal pattern, categorizes them by size, and then outputs a composite fractal size index. This index is smooth, timely and accurate
Essentially, CFB reveals the length of the market's trending action time frame. Long trending activity produces a large CFB index and short choppy action produces a small index value. Investors have found many applications for CFB which involve scaling other existing technical indicators adaptively, on a bar-to-bar basis.
What is Jurik Volty used in the Juirk Filter?
One of the lesser known qualities of Juirk smoothing is that the Jurik smoothing process is adaptive. "Jurik Volty" (a sort of market volatility ) is what makes Jurik smoothing adaptive. The Jurik Volty calculation can be used as both a standalone indicator and to smooth other indicators that you wish to make adaptive.
What is the Jurik Moving Average?
Have you noticed how moving averages add some lag (delay) to your signals? ... especially when price gaps up or down in a big move, and you are waiting for your moving average to catch up? Wait no more! JMA eliminates this problem forever and gives you the best of both worlds: low lag and smooth lines.
Ideally, you would like a filtered signal to be both smooth and lag-free. Lag causes delays in your trades, and increasing lag in your indicators typically result in lower profits. In other words, late comers get what's left on the table after the feast has already begun.
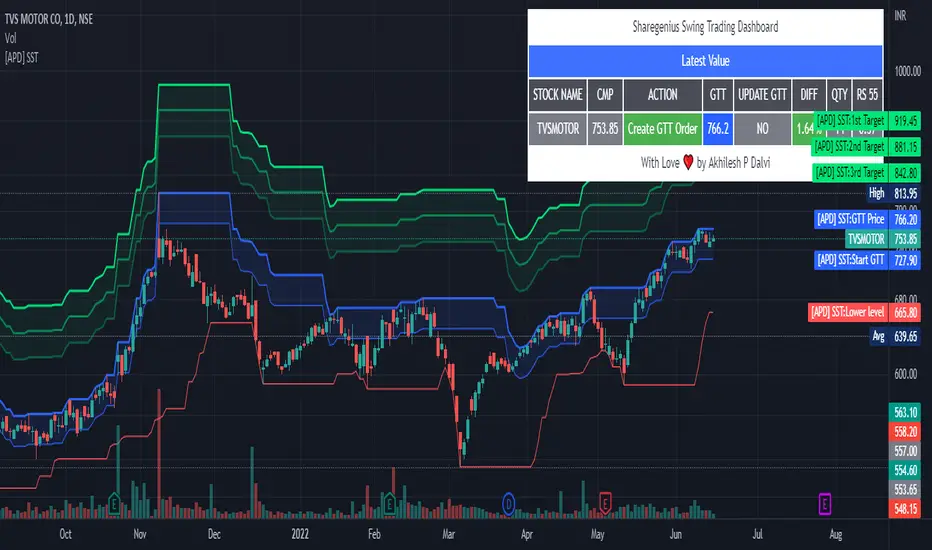
[APD] Sharegenius Swing Trading StrategyThis script plots GTT Price , Target Prices , Buy Zone , Target Zone and Information Dashboard according to Sharegenius Swing Trading Strategy. SST is for Swing Trading.
👉🏻 Strategy by Mahesh Kaushik -
1️⃣ Track the 20-Day Low of the instrument.
2️⃣ Create a GTT order which is 5% above 20 DL.
3️⃣ If the share makes a new 20 DL before getting purchased, then update your GTT order to be 5% above the new 20 DL.
4️⃣ Next GTT will be started when the average price falls by 10%. (GTT will be created as 5% above the last 20 DL or Buy on 10%, 20%, 30% fall in average price.)
5️⃣ Sell target is 5% of the average price. Sell all units or Set sell target on buy price.
6️⃣ No stop loss is needed as we buy when the stock falls.
👉🏻 Note:-
Trade in fundamentally good stocks & strong stocks those are outperforming index because we do not take stop loss in this strategy.
DISCLAIMER:- This Script is for educational purposes only. Nothing in this content should be interpreted as financial advice or a recommendation to buy or sell any sort of security or investment.
donchian diff [LM]Hello traders,
I would like to present you Donchian diff script. The idea behind this script is that as in Ichimoku I consider base line as equilibrium so I calculate percentages between base line and current price and calculate percentage between base line and conversion line and use them as a filter. For signals I used also that candle has to be highest or lowest in x(configurable) consecutive candles.
It has following setting:
Base line setting
Conversion line setting
buy/sell signal setting - here you can setup buy/sell condition
filter setting - here you can set up percentages of the distances
Hope you will enjoy it,
L

Donchian Channels (Close)This indicator shows Donchian Channels based on close prices only. Additionally, a box with the bands and the center line for the last bar can be shown.
The center line, the bands and the box can be hidden independently.
Four periods are being shown at the moment, but the indicator is easily extensible with copy and paste.

Trade Helper [Trading Nerd]Position Size Calculator / Lot Size Calculator
Disclaimer: I do my best to avoid wrong calculations and bugs. I provide this indicator without warranties of any kind. You bear all risks associated with the use of this indicator.
Inputs:
Market: Adds a name tag to the Table to keep track of the trades.
Entry Price: The entry Price of the Position.
Entry Time: The entry Time/Candle of the Position. If Stop Loss Type is 'ATR' or 'HH/LL' the Value for this is calculated by this Candle.
Stop Loss Type: Changes the Stop Loss Type.
Direction: Define if the trade direction is 'Long' or 'Short'. Has no effect on Stop Loss Type 'Custom'. For this you can just set the Stop Loss below/above the Entry Price .
ATR Multiplier: Multiplies the ATR Value by this number. Has only an effect on Stop Loss Type 'ATR'.
HH/LL Lookback Length: Lookback length for determine Highest High/Lowest Low value. Has only an effect on Stop Loss Type 'HH/LL'.
Custom SL Price: The Stop Loss Price if the Stop Loss Type is set to 'Custom'.
Risk Reward Ratio: The Risk is multiplied by this number to determine the Take Profit Price.
Balance: Balance Amount and Currency
Contract Size: The Position Size is divided by this number. E.G. in Forex one Lot is 100.000 Contracts. Change this Value depending on your Broker and Market.
Risk in %: Percent that is risked of the Balance for one Trade.

Stochastic ChannelsDonchain trend following system with overbought/ oversold areas inspired by stochastic. Multiplier to get non repainting HTF capability. features a smoothed price as well as moving average of the smoothed price, also inspired by the stochastic indicators %K and %D. This and slow stochastics compliment each other nicely.
%D line colored by direction.
Filled color areas represent overbought/oversold.
Shows breakouts as well as giving targets and entries in rangebound markets.

Channel IndicatorSimple Donchian Channels and two EMA so you can trade the bottom and the top of the channel.

Donchian SARCombination of Donchian channels and sar. The donchian channels provides simple and easy data of support and resistances and SAR tells the price trend
Keltner Center Of Gravity Channel ( KeltCOG )I have the ambition to create a ‘landscape’ which enables the user to see the ‘mood’ of the market about the price of an instrument, simply by looking where the candles go. Prices are a simple phenomenon , they go up or down or stay the same. This is represented quite well for the short term by a candle. I recommend to study candle patterns. Prices not only fluctuate but also trend up, down or go sideways. The user should analyze this by determining the COG (Center Of Gravity) and the ‘normal’ current range by using the historical data in a lookback period.
As a COG the center line of a Donchian Channel is often used. I.m.o. a COG should be a zone, in this channel I use the gray zone of my Donchian Fibonacci Channel, The ‘normal’ range is a multiple of Average True Range, as used in a Keltner Channel. Combining the two can give a cumbersome result, as one can see in my Keltner Fibonacci Channel. In this KeltCOG channel I solved this by not using all Fibonacci levels and by making the Keltner lines strictly parallel to the nearest COG line. To do this, I use the fact that the COG lines have horizontal stretches, there I make the Keltner lines horizontal too. Only where the COG lines change value, the Keltner lines are recalculated. This way the channel gets a very regular shape with three clear zones.
Interpretation of a chart by using the KeltCOG channel.
Overbought: If the candles go higher then the blue zone, the market is hyper enthusiast, creating an overbought situation. This is often followed by a reversion to the COG.
Uptrend: If the candles form in the blue zone, the market is enthusiast and willing to pay more.
Hopeful: If the candles form in or near the upper uncolored zone, the market is hopeful and is thinking about paying more. Sometimes prices go a little up.
Content: If the candles form in the gray zone, which represents COG, the market is happy with the current prices, so these move sideways
Disappointed: If the candles form in or near the lower uncolored zone, the market is disappointed and contemplates paying less, sometimes prices go a little down.
Downtrend: If the candles form in red zone, the market doesn’t like the instrument at all, rejects the current price and is only prepared to pay less.
Oversold: If the candles form below the red zone, the market overdoes its disgust, creating an oversold situation, often followed by a reversion to the COG.

Current to BTC [Morty]This indicator helps you find strong bull altcoin, it shows the ratio of the current symbol to BTC.
Donchian Channels help to identify trends.
Alts Bull coins:
When BTC goes sideway, they pump first.
Alts Bear coins:
When BTC goes sideway, they move sideway.
When BTC goes down, they go down harder.

ZigZag ChannelThis is recreation of Donchian Channel - Pivot High Low indicator present here:
But, instead of traditional pivot high lows, this is based on pivots created from zigzag indicator.
This indicator is created on top of existing Zigzag indicator using lines array:
Parameter HighLowLength refers to number of zigzag lines back which can be used to calculate top and bottom of donchian channel.
RSI+ChannelbandsThis Indicator displays a normal RSI with overbought/-sold lines which is calculated with donchian channels, pivot channel, bollinger bands and three horizontal lines.
You can averaged the channels, bands and h-lines in any combination or you can use just one of them for calculating the overbought/-sold lines.
The midline is colored in default settings in yellow for upptrending and blue for downtrending.

Adaptive Donchian ChannelThis is Slight modified version of Donchian channel. Only change here is, channels update only when there is breakout. If price keeps ranging within channel, it will not contract based on new highest and lowest range.
This can be used for identifying powerful breakouts post long consolidation and filter out fakeouts.
Value RangeHere is another attempt to chase value based on technical analysis.
This is extended version of PE range script published earlier.
Instead of just PE, this script contains several other factors which defines value. You can chose which factor to look at from input dialog:
Possible value factors included in this script are:
Price to Earnings
Price to Sales
Price to Book
PE - Forwarding
PS - Forwarding
Price to Cashflow
Enterprise Value to EBITDA
Enterprise Value to Cashflow
Some of these can be added to chart directly from financials. But, the script also calculate range based on donchian channel or bollinger bands. Instead of short periods, we are looking for periods in terms of years. Rest of things remain same.

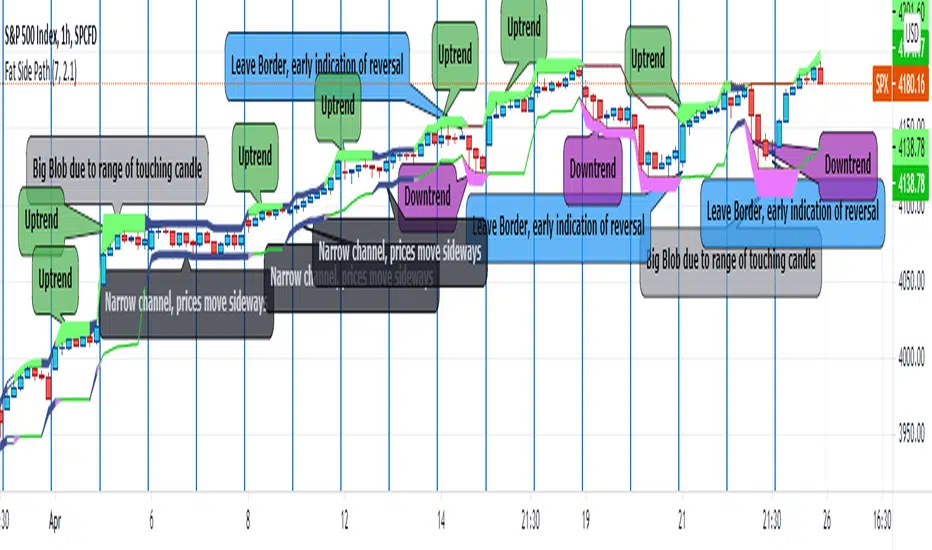
Fat Side PathI got the idea for a narrow Donchian Channel with a short lookback period which closely follows the price fluctuation in which the sides of the channel have a thickness according to the range of the last touching candle.
Any channel, be it Donchian, Keltner, Bollinger Bands or Parallel, has an upside and a downside, touching the upside is a buy signal as this may initiate an uptrend, the downside a sell signal because a down trend may come.
This gave me the idea to make only the last touched side fat, thus creating visible switching between uptrend and downtrend. However this is ‘too digital’, as in practice also periods of no trend occur in which signaling a trend would give a false signal. In a Donchian channel (and also Bollinger Bands) such periods are marked by narrowing the channel. So I gave a no trend signal to the sides when the channel is narrower than a minimum width to call a trend. I gave the thing nice colours and proper default settings.
Use of the channel in trading.
I think this thing can be useful for swing trading. In channels two typical things may happen that should be noted by the trader, these are LB, Leaving the Border, which signals a trend reversal and FTT, Failure To Traverse, i.e. the price doesn’t manage to cross the channel to the other side. This affirms the trend. FTT’s are not expected in short lookback channels like this path (Sidenote: Fibonacci levels can be regarded as predictions where FTT’s may occur). The fat side indicates direction. Because somehow trends seem to end with a notable range extension, this channel sometimes produces a “Big Blob” where the trend reverses.
I intend to use this thing together with my Keltner Fibzones channel, where the zones serve as a ‘landscape’ in which the Fat Side Path meanders providing ‘comments’ on the short term price movements.
Donchian Channel - trend filterTrend filter created based on donchian channel. I am using my custom donchian channel as base for this indicator:
Concept is simple.
We count how many times price is hitting donchian channel top or bottom without hitting the other side and keep counter for both. Thus:
upCount is the number of times price hits donchian channel top without hitting bottom
downCount is the number of times price hits donchian channel bottom without hittin top
trendCountLimit is the minimum value of upCount or downCount to call it uptrend or downtrend.

donchain support&resistance levels [LM]Hello Traders,
I would like to introduce you donchain support&resistance levels. The idea is to look for important levels that are identified by donchain line, where donchain usualy spents a lot of time without any move usualy turns out to be good level for bounces.
Also note that when there is a big spread between first line and second line it usually leads to some pullback.
Here you have an example of big spread:
You are also able to show donchain lines and not only horizontals this you can find in settings:
Enjoy!

Custom FIBOThis script shows 3 Donchian Channel 78.6% and 21.4% intermediary level lines to perform trade analysis. Besides those 6 lines it also optionally shows Fibonacci's retracements with 100%, 127%, 162%, 200% and 262% for one of the Donchian channels.
The 3 Donchian Channels used have default lengths 72, 305 and 1292, calculated after the first length default value of 72. For each of the 3 Donchian Channels only an upper line, set by default at 78.6%, is plotted in green and its complement, set to 21.4%, is plotted in red. When the closing price is above 3 green lines, we say it is Forbidden to Sell ( PV ), and when the closing price is below 3 red lines, we say it is Forbidden to Buy ( PC ). Those conditions are flagged on the chart. These PV-PC conditions were, up to my knowledge, first proposed by Bo Williams.
Fibonacci's retracements are show for the Donchian Channel with length 72 by default, but it can be changed to any length. They are colored as fuchsia (100%), blue (127%), orange (162%), yellow (200%) and navy (262%).

Donchian Channel - CustomThis is an extension to Donchian Channel - Pivot High Low indicator. Creating new version as the new type added isn't related to pivot high/low.
New type added is based on moving average. Instead of using highest and lowest of n bars, here, we are using lowest and highest of moving average of highs and lows for n bars.
Previous version of Donchian channel pivot points can be found here:

Donchian Zig-Zag [LuxAlgo]The following indicator returns a line bouncing of the extremities of a Donchian channel, with the aim of replicating a "zig-zag" indicator. The indicator can both be lagging or lagging depending on the settings user uses.
Various extended lines are displayed in order to see if the peaks and troughs made by the Donchian zig-zag can act as potential support/resistance lines.
User Settings
Length : Period of the Donchian channel indicator, higher values will return fewer changes of directions from the zig-zag line
Bounce Speed : Determine the speed of bounces made by the zig-zag line, with higher values making the zig-zag line converge faster toward the extremities of the Donchian channel.
Gradient : Determine whether to use a gradient to color the area between each Donchian channel extremities, "On" by default.
Transparency : Transparency of the area between each Donchian channel extremities.
Usage
It is clear that this is not a very common indicator to see, as such usages can be limited and very hypothetical. Nonetheless, when a bounce speed value of 1 is used, the zig-zag line will have the tendency to lag behind the price, and as such can provides crosses with the prices which can provide potential entries.
The advantage of this approach against most indicators relying on crosses with the price is that the linear nature of the indicator allows avoiding retracements, thus potentially holding a position for the entirety of the trend.
Altho this indicator would not necessarily be the most adapted to this kind of usage.
When using a bounce speed superior to 1, we can see the predictive aspects of the indicator:
We can link the peaks/troughs made by the zig-zag with the precedent ones made to get potential support and resistance lines, while such a method is not necessarily accurate it still allows for an additional to interpret the indicator.
Conclusions
We presented an indicator aiming to replicate the behaviour of a zig-zag indicator. While somehow experimental, it has the benefits of being innovative and might inspire users in one way or another.

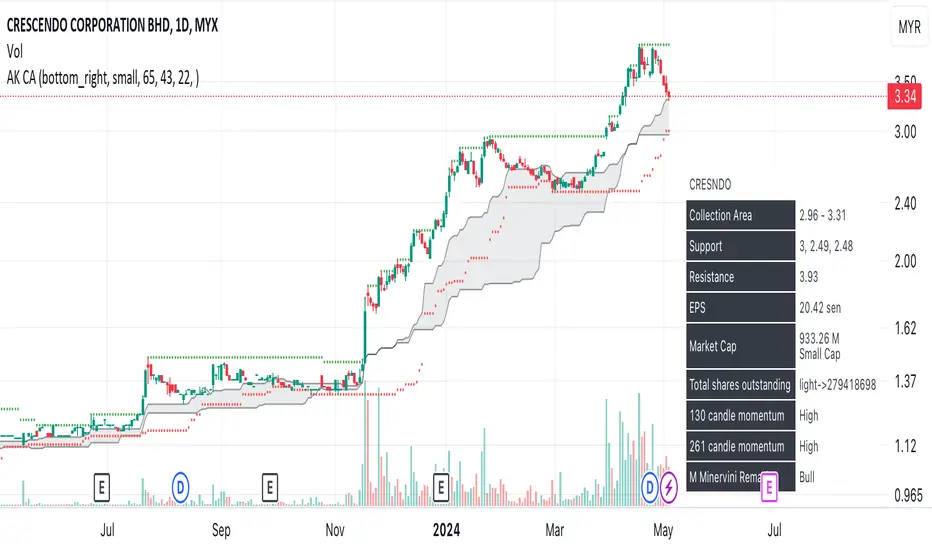
AK collection area- Based on Coach AK formula of determining collection area of retracement stock.
- If price below collection area, collect in tranches.