Inverse Fisher Transform on MFIAbout John EHLERS:
From California, USA, John is a veteran trader. With 35 years trading experience he has seen it all. John has an engineering background that led to his technical approach to trading ignoring fundamental analysis (with one important exception).
John strongly believes in cycles. He’d rather exit a trade when the cycle ends or a new one starts. He uses the MESA principle to make predictions about cycles in the market and trades one hundred percent automatically.
In the show John reveals:
• What is more appropriate than trading individual stocks
• The one thing he relies upon in his approach to the market
• The detail surrounding his unique trading style
• What important thing underpins the market and gives every trader an edge
About INVERSE FISHER TRANSFORM:
The purpose of technical indicators is to help with your timing decisions to buy or
sell. Hopefully, the signals are clear and unequivocal. However, more often than
not your decision to pull the trigger is accompanied by crossing your fingers.
Even if you have placed only a few trades you know the drill.
In this article I will show you a way to make your oscillator-type indicators make
clear black-or-white indication of the time to buy or sell. I will do this by using the
Inverse Fisher Transform to alter the Probability Distribution Function (PDF) of
your indicators. In the past12 I have noted that the PDF of price and indicators do
not have a Gaussian, or Normal, probability distribution. A Gaussian PDF is the
familiar bell-shaped curve where the long “tails” mean that wide deviations from
the mean occur with relatively low probability. The Fisher Transform can be
applied to almost any normalized data set to make the resulting PDF nearly
Gaussian, with the result that the turning points are sharply peaked and easy to
identify. The Fisher Transform is defined by the equation
1)
Whereas the Fisher Transform is expansive, the Inverse Fisher Transform is
compressive. The Inverse Fisher Transform is found by solving equation 1 for x
in terms of y. The Inverse Fisher Transform is:
2)
The transfer response of the Inverse Fisher Transform is shown in Figure 1. If
the input falls between –0.5 and +0.5, the output is nearly the same as the input.
For larger absolute values (say, larger than 2), the output is compressed to be no
larger than unity. The result of using the Inverse Fisher Transform is that the
output has a very high probability of being either +1 or –1. This bipolar
probability distribution makes the Inverse Fisher Transform ideal for generating
an indicator that provides clear buy and sell signals.
Ehlers

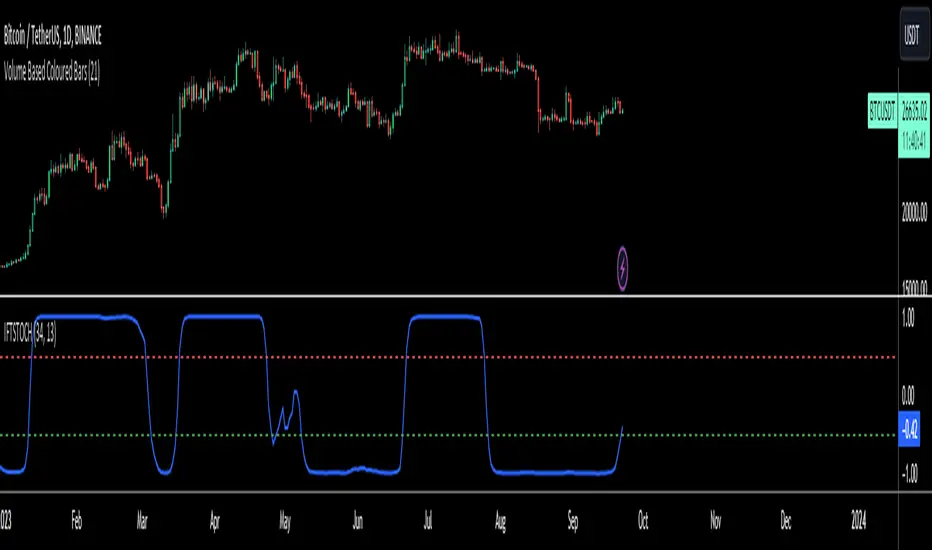
Inverse Fisher Transform on STOCHASTICAbout John EHLERS:
From California, USA, John is a veteran trader. With 35 years trading experience he has seen it all. John has an engineering background that led to his technical approach to trading ignoring fundamental analysis (with one important exception).
John strongly believes in cycles. He’d rather exit a trade when the cycle ends or a new one starts. He uses the MESA principle to make predictions about cycles in the market and trades one hundred percent automatically.
In the show John reveals:
• What is more appropriate than trading individual stocks
• The one thing he relies upon in his approach to the market
• The detail surrounding his unique trading style
• What important thing underpins the market and gives every trader an edge
About INVERSE FISHER TRANSFORM:
The purpose of technical indicators is to help with your timing decisions to buy or
sell. Hopefully, the signals are clear and unequivocal. However, more often than
not your decision to pull the trigger is accompanied by crossing your fingers.
Even if you have placed only a few trades you know the drill.
In this article I will show you a way to make your oscillator-type indicators make
clear black-or-white indication of the time to buy or sell. I will do this by using the
Inverse Fisher Transform to alter the Probability Distribution Function (PDF) of
your indicators. In the past12 I have noted that the PDF of price and indicators do
not have a Gaussian, or Normal, probability distribution. A Gaussian PDF is the
familiar bell-shaped curve where the long “tails” mean that wide deviations from
the mean occur with relatively low probability. The Fisher Transform can be
applied to almost any normalized data set to make the resulting PDF nearly
Gaussian, with the result that the turning points are sharply peaked and easy to
identify. The Fisher Transform is defined by the equation
1)
Whereas the Fisher Transform is expansive, the Inverse Fisher Transform is
compressive. The Inverse Fisher Transform is found by solving equation 1 for x
in terms of y. The Inverse Fisher Transform is:
2)
The transfer response of the Inverse Fisher Transform is shown in Figure 1. If
the input falls between –0.5 and +0.5, the output is nearly the same as the input.
For larger absolute values (say, larger than 2), the output is compressed to be no
larger than unity. The result of using the Inverse Fisher Transform is that the
output has a very high probability of being either +1 or –1. This bipolar
probability distribution makes the Inverse Fisher Transform ideal for generating
an indicator that provides clear buy and sell signals.
Inverse Fisher Transform on CCIAbout John EHLERS:
From California, USA, John is a veteran trader. With 35 years trading experience he has seen it all. John has an engineering background that led to his technical approach to trading ignoring fundamental analysis (with one important exception).
John strongly believes in cycles. He’d rather exit a trade when the cycle ends or a new one starts. He uses the MESA principle to make predictions about cycles in the market and trades one hundred percent automatically.
In the show John reveals:
• What is more appropriate than trading individual stocks
• The one thing he relies upon in his approach to the market
• The detail surrounding his unique trading style
• What important thing underpins the market and gives every trader an edge
About INVERSE FISHER TRANSFORM:
The purpose of technical indicators is to help with your timing decisions to buy or
sell. Hopefully, the signals are clear and unequivocal. However, more often than
not your decision to pull the trigger is accompanied by crossing your fingers.
Even if you have placed only a few trades you know the drill.
In this article I will show you a way to make your oscillator-type indicators make
clear black-or-white indication of the time to buy or sell. I will do this by using the
Inverse Fisher Transform to alter the Probability Distribution Function (PDF) of
your indicators. In the past12 I have noted that the PDF of price and indicators do
not have a Gaussian, or Normal, probability distribution. A Gaussian PDF is the
familiar bell-shaped curve where the long “tails” mean that wide deviations from
the mean occur with relatively low probability. The Fisher Transform can be
applied to almost any normalized data set to make the resulting PDF nearly
Gaussian, with the result that the turning points are sharply peaked and easy to
identify. The Fisher Transform is defined by the equation
1)
Whereas the Fisher Transform is expansive, the Inverse Fisher Transform is
compressive. The Inverse Fisher Transform is found by solving equation 1 for x
in terms of y. The Inverse Fisher Transform is:
2)
The transfer response of the Inverse Fisher Transform is shown in Figure 1. If
the input falls between –0.5 and +0.5, the output is nearly the same as the input.
For larger absolute values (say, larger than 2), the output is compressed to be no
larger than unity. The result of using the Inverse Fisher Transform is that the
output has a very high probability of being either +1 or –1. This bipolar
probability distribution makes the Inverse Fisher Transform ideal for generating
an indicator that provides clear buy and sell signals.

Inverse Fisher Transform on RSIAbout John EHLERS:
From California, USA, John is a veteran trader. With 35 years trading experience he has seen it all. John has an engineering background that led to his technical approach to trading ignoring fundamental analysis (with one important exception).
John strongly believes in cycles. He’d rather exit a trade when the cycle ends or a new one starts. He uses the MESA principle to make predictions about cycles in the market and trades one hundred percent automatically.
In the show John reveals:
• What is more appropriate than trading individual stocks
• The one thing he relies upon in his approach to the market
• The detail surrounding his unique trading style
• What important thing underpins the market and gives every trader an edge
About INVERSE FISHER TRANSFORM:
The purpose of technical indicators is to help with your timing decisions to buy or
sell. Hopefully, the signals are clear and unequivocal. However, more often than
not your decision to pull the trigger is accompanied by crossing your fingers.
Even if you have placed only a few trades you know the drill.
In this article I will show you a way to make your oscillator-type indicators make
clear black-or-white indication of the time to buy or sell. I will do this by using the
Inverse Fisher Transform to alter the Probability Distribution Function (PDF) of
your indicators. In the past12 I have noted that the PDF of price and indicators do
not have a Gaussian, or Normal, probability distribution. A Gaussian PDF is the
familiar bell-shaped curve where the long “tails” mean that wide deviations from
the mean occur with relatively low probability. The Fisher Transform can be
applied to almost any normalized data set to make the resulting PDF nearly
Gaussian, with the result that the turning points are sharply peaked and easy to
identify. The Fisher Transform is defined by the equation
1)
Whereas the Fisher Transform is expansive, the Inverse Fisher Transform is
compressive. The Inverse Fisher Transform is found by solving equation 1 for x
in terms of y. The Inverse Fisher Transform is:
2)
The transfer response of the Inverse Fisher Transform is shown in Figure 1. If
the input falls between –0.5 and +0.5, the output is nearly the same as the input.
For larger absolute values (say, larger than 2), the output is compressed to be no
larger than unity. The result of using the Inverse Fisher Transform is that the
output has a very high probability of being either +1 or –1. This bipolar
probability distribution makes the Inverse Fisher Transform ideal for generating
an indicator that provides clear buy and sell signals.
PRO Sinewave - BETAThis is a BETA version. Which means that there might be unstability, errors...
I just decided to create this separate version of the indicator in order to let people test & give reviews before pushing the actual release to the public version.
This versions will be more "advanced" but can be less reliable.. Choose wisely !
THIS SCRIPT ACCESS WILL ONLY BE GRANTED TO SUBSCRIBED USERS... (infos on the public release) So please don't post comments to ask for unlocking !
LINK TO THE PUBLIC RELEASE
Don't forget to hit the like/follow button if you feel like my work deserves it ;)
You can check my other indicators via my TradingView's Profile : @PRO_Indicators
Bests,
Phil

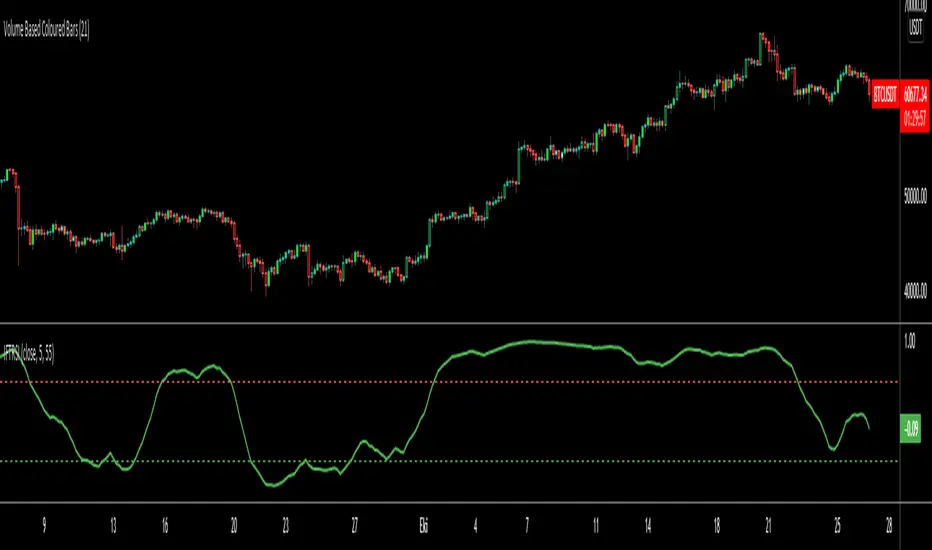
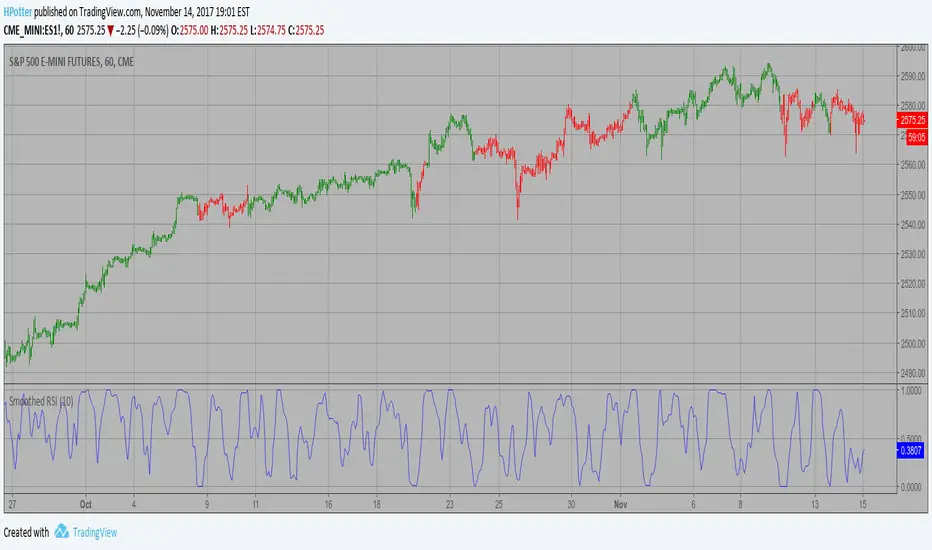
Smoothed RSI Backtest ver.2 This is new version of RSI oscillator indicator, developed by John Ehlers.
The main advantage of his way of enhancing the RSI indicator is smoothing
with minimum of lag penalty.
You can change long to short in the Input Settings
WARNING:
- For purpose educate only
- This script to change bars colors.

Smoothed RSI Strategy ver.2 This is new version of RSI oscillator indicator, developed by John Ehlers.
The main advantage of his way of enhancing the RSI indicator is smoothing
with minimum of lag penalty.
WARNING:
- This script to change bars colors.

Smoothed RSI Backtest This is new version of RSI oscillator indicator, developed by John Ehlers.
The main advantage of his way of enhancing the RSI indicator is smoothing
with minimum of lag penalty.
You can change long to short in the Input Settings
WARNING:
- For purpose educate only
- This script to change bars colors.

Smoothed RSI Strategy This is new version of RSI oscillator indicator, developed by John Ehlers.
The main advantage of his way of enhancing the RSI indicator is smoothing
with minimum of lag penalty.
WARNING:
- This script to change bars colors.
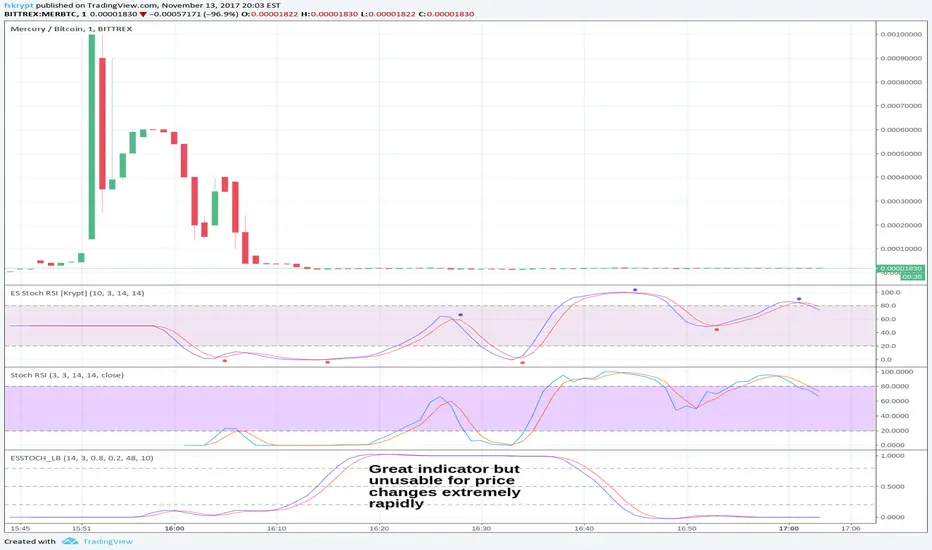
Ehlers-Smoothed Stochastic RSI [Krypt]This script uses a regular Stochastic RSI formula and then runs Ehlers' Super Smoother on top of it. It also provides buy/sell signals on crossovers.
The script is inspired by LazyBear Ehlers-Smoothed Stochastic RSI with Roofing Filter, except I find that the Roofing filter (existing implementation) does not work well near extreme price changes, where a regular formula is preferable. The Ehlers Super Smoother however is excellent and seems to provide earlier signals in most cases than an EMA-EMA smoother. Combined, the super-smoother and regular Stochastic RSI formula provide very good results.
Ehlers MESA Adaptive Moving Average [LazyBear with ekoronin fix]Mama/Fama with ekronin's fix: www.tradingview.com

Zero Lag Exponential Moving Average (ZLEMA) The Zero lag exponential moving average (ZLEMA) indicator was created
by John Ehlers and Ric Way.
As is the case with the Double exponential moving average (DEMA) and
the Triple exponential moving average (TEMA) and as indicated by the
name, the aim is to eliminate the inherent lag associated to all trend
following indicators which average a price over time.

RSX FracticalityA little project I was working on to avoid studying for finals. Using LazyBear's RSX code for a smoother RSI, then taking the RSX of fib number lengths. Take the average of that, then the JMA of that from the same fib numbers. The average of that is then treated as the trend, take the average of the trend values from the main time frames, the script calls pretty far back so adding a W or M TF I think would throw the calculations off. Then I smoothed that value using the jma's to create the overall trend. I got the idea from Ehler's Empirical Mode Decomposition about identifying peaks and valleys and creating an average of that to create a range. The idea is that if the trend is above the Average Peak then it is a bull trend, less than the average valley it's a bear trend, in between it's ranging. It looks like it turned out alright, I'll be working on this idea of fractals a lot this summer to see if I can improve it or build something better off of the idea.

D_ELI (Ehlers Leading Indicator) Strategy Backtest This Indicator plots a single
Daily DSP (Detrended Synthetic Price) and a Daily ELI (Ehlers Leading
Indicator) using intraday data.
Detrended Synthetic Price is a function that is in phase with the dominant
cycle of real price data. This one is computed by subtracting a 3 pole Butterworth
filter from a 2 Pole Butterworth filter. Ehlers Leading Indicator gives an advanced
indication of a cyclic turning point. It is computed by subtracting the simple
moving average of the detrended synthetic price from the detrended synthetic price.
Buy and Sell signals arise when the ELI indicator crosses over or under the detrended
synthetic price.
See "MESA and Trading Market Cycles" by John Ehlers pages 64 - 70.
You can change long to short in the Input Settings
Please, use it only for learning or paper trading. Do not for real trading

D_ELI (Ehlers Leading Indicator) Strategy This Indicator plots a single
Daily DSP (Detrended Synthetic Price) and a Daily ELI (Ehlers Leading
Indicator) using intraday data.
Detrended Synthetic Price is a function that is in phase with the dominant
cycle of real price data. This one is computed by subtracting a 3 pole Butterworth
filter from a 2 Pole Butterworth filter. Ehlers Leading Indicator gives an advanced
indication of a cyclic turning point. It is computed by subtracting the simple
moving average of the detrended synthetic price from the detrended synthetic price.
Buy and Sell signals arise when the ELI indicator crosses over or under the detrended
synthetic price.
See "MESA and Trading Market Cycles" by John Ehlers pages 64 - 70.

D_DSP (Detrended Synthetic Price) Strategy 2 Backtest Detrended Synthetic Price is a function that is in phase with the
dominant cycle of real price data. This DSP is computed by subtracting
a half-cycle exponential moving average (EMA) from the quarter cycle
exponential moving average.
See "MESA and Trading Market Cycles" by John Ehlers pages 64 - 70.
You can change long to short in the Input Settings
Please, use it only for learning or paper trading. Do not for real trading.

D_DSP (Detrended Synthetic Price) Strategy 2 Detrended Synthetic Price is a function that is in phase with the
dominant cycle of real price data. This DSP is computed by subtracting
a half-cycle exponential moving average (EMA) from the quarter cycle
exponential moving average.
See "MESA and Trading Market Cycles" by John Ehlers pages 64 - 70.

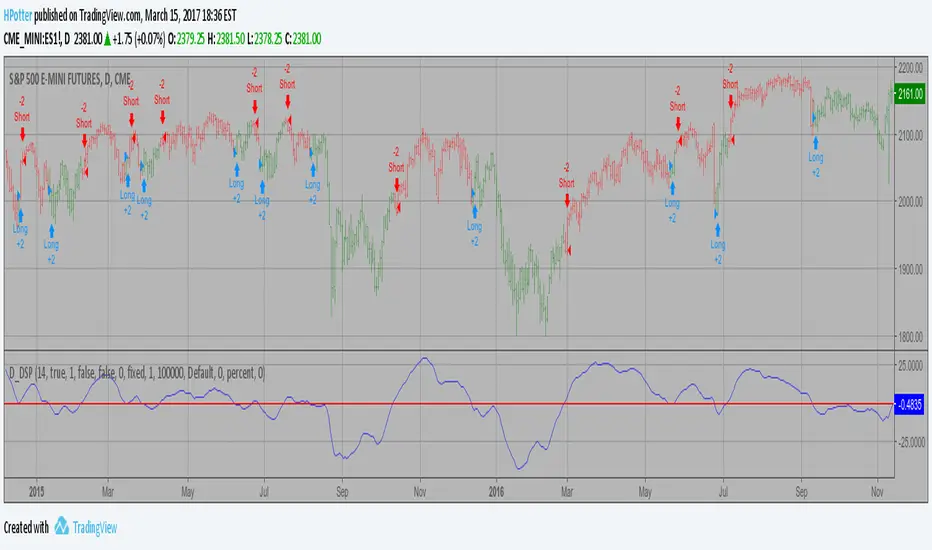
D_DSP (Detrended Synthetic Price) Strategy Backtest Detrended Synthetic Price is a function that is in phase with the
dominant cycle of real price data. This DSP is computed by subtracting
a half-cycle exponential moving average (EMA) from the quarter cycle
exponential moving average.
See "MESA and Trading Market Cycles" by John Ehlers pages 64 - 70.
D_DSP (Detrended Synthetic Price) Strategy Detrended Synthetic Price is a function that is in phase with the
dominant cycle of real price data. This DSP is computed by subtracting
a half-cycle exponential moving average (EMA) from the quarter cycle
exponential moving average.
See "MESA and Trading Market Cycles" by John Ehlers pages 64 - 70.

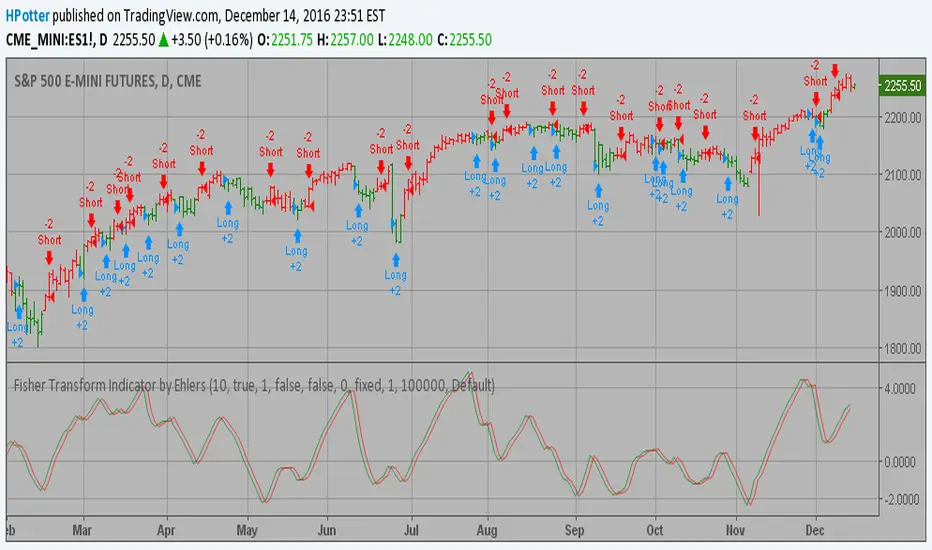
Fisher Transform Indicator by Ehlers Backtest v 2.0 Market prices do not have a Gaussian probability density function
as many traders think. Their probability curve is not bell-shaped.
But trader can create a nearly Gaussian PDF for prices by normalizing
them or creating a normalized indicator such as the relative strength
index and applying the Fisher transform. Such a transformed output
creates the peak swings as relatively rare events.
Fisher transform formula is: y = 0.5 * ln ((1+x)/(1-x))
The sharp turning points of these peak swings clearly and unambiguously
identify price reversals in a timely manner.
For signal used zero.
You can change long to short in the Input Settings
Please, use it only for learning or paper trading. Do not for real trading.
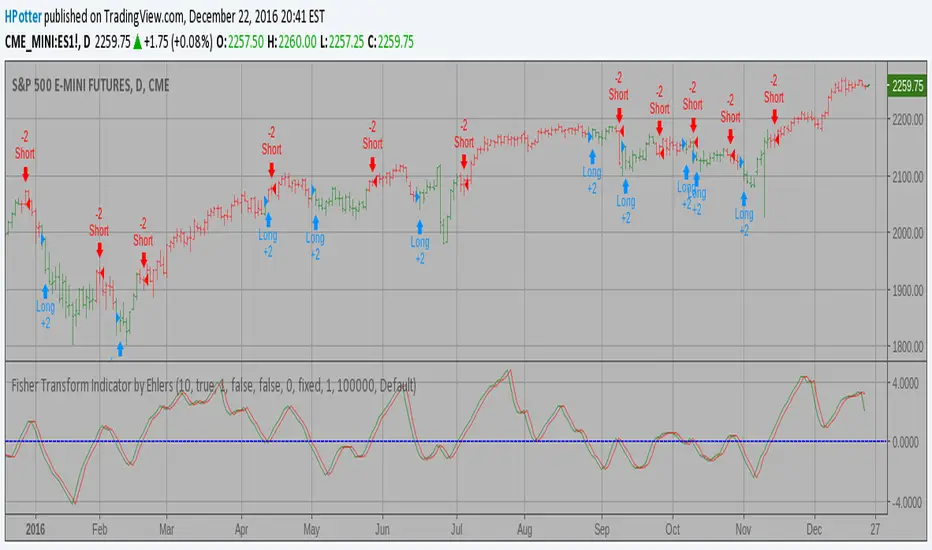
Fisher Transform Indicator by Ehlers Backtest Market prices do not have a Gaussian probability density function
as many traders think. Their probability curve is not bell-shaped.
But trader can create a nearly Gaussian PDF for prices by normalizing
them or creating a normalized indicator such as the relative strength
index and applying the Fisher transform. Such a transformed output
creates the peak swings as relatively rare events.
Fisher transform formula is: y = 0.5 * ln ((1+x)/(1-x))
The sharp turning points of these peak swings clearly and unambiguously
identify price reversals in a timely manner.
You can change long to short in the Input Settings
Please, use it only for learning or paper trading. Do not for real trading.
FRAMA (Ehlers true modified calculation)Credit goes to Shizaru for the original calculation. I made just a few fixes, so that the calculation is really that of Ehlers.
Fixed H2 and L2 period, fixed w natural logarithm
Ehlers Super Smoother by ShizaruJohn Ehlers’ “Super Smoother”, a 2-pole Butterworth filter combined with a 2-bar SMA that suppresses the Nyquist frequency
