Ehlers Reverse EMAOverview
The Ehlers Reverse EMA is an advanced momentum indicator designed by John Ehlers and implemented here with additional features for improved trading decision-making. This indicator helps identify trend direction, potential reversals, and generates precise buy/sell signals based on multiple confirmation methods.
What Makes It Unique
Unlike conventional EMAs, the Ehlers Reverse EMA uses a sophisticated reverse-engineering approach to provide smoother, more responsive signals with reduced lag. The indicator combines a proprietary EMA calculation with optional moving average confirmation to filter out market noise and highlight meaningful price movements.
Features
Dynamic Color Coding: Green when momentum is positive, red when negative
Moving Average Overlay: Optional MA with selectable types (SMA, EMA, WMA, VWMA)
Multiple Signal Generation Methods:
Zero-Line Crossovers: Signals when momentum shifts from positive to negative or vice versa
MA Crossovers: Signals when the Ehlers EMA crosses its own moving average
Combined Confirmation: Requires both zero-line and MA crossovers for highest probability signals
On-Chart Signal Visualization: Clear buy/sell arrows directly on the price chart
Customizable Parameters: Adjust alpha value, MA type, and signal generation to suit your trading style
How To Use
Add the main "Ehlers Reverse EMA" indicator to your chart
Add the companion "EREMA Signals" indicator to display buy/sell signals on the price chart
Ensure both indicators have matching settings for consistency
Signal Interpretation
Buy Signals (Green Triangles): Appear below price bars when conditions are met
Sell Signals (Red Triangles): Appear above price bars when conditions are met
Recommended Timeframes
Works well on all timeframes from 5-minute to daily charts. For swing trading, 4H or daily timeframes often provide the most reliable signals.
Strategy Applications
Trend Following: Use zero-line crossovers to enter with the trend
Momentum Trading: Use MA crossovers for entry and exit points
Confirmation Tool: Combine with price action or other indicators for higher-probability trades
Divergence Analysis: Compare indicator movement with price action to spot potential reversals
Parameter Settings
Alpha (Default: 0.1): Lower values create smoother lines but more lag; higher values increase responsiveness but may increase false signals
MA Length (Default: 14): Adjust based on your trading timeframe and style
This versatile indicator helps identify high-probability trading opportunities while filtering out market noise, making it valuable for both novice and experienced traders alike.
Media mobile esponenziale (EMA)

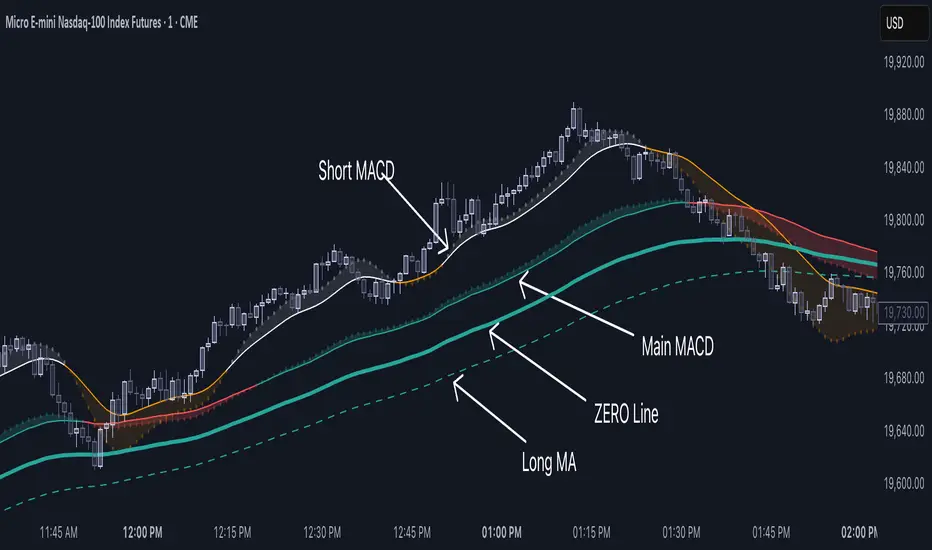
Double MACD Overlay [NLR]This indicator plots two MACD signals directly on your price chart to help you spot trends and shifts in momentum more clearly:
🔹 Main MACD - The classic MACD with customizable Fast, Slow, and Signal lengths. Great for confirming broader trend direction.
🔹 Short MACD - A faster MACD with an option to smooth the input, helping you catch early signals or identify short-term momentum changes.
Each MACD is visualized as:
A line showing the moving average
A colored histogram showing the MACD minus the signal
A zero line for reference
Why use this?
By comparing a short-term MACD with a longer-term one, you get early signals without losing the big picture. Use it for confirmation, divergence spotting, or just cleaner trend visualization.
Best For:
✅ Trend-followers
✅ Momentum traders
✅ Anyone who wants more context from their MACD signals
Recommended Settings:
Here are some ideal settings to get the most out of this indicator:
On a 5-Minute Chart:
Compare your current MACD with the 15-minute MACD.
- MACD Multiplier: 3
On a 1-Minute Chart:
Spot short-term moves while comparing them to the 5-minute MACD.
- MACD Multiplier: 5
- Use Smoothed Source (Short MACD): ON (for a cleaner short MACD signal)
Happy trading! 💹
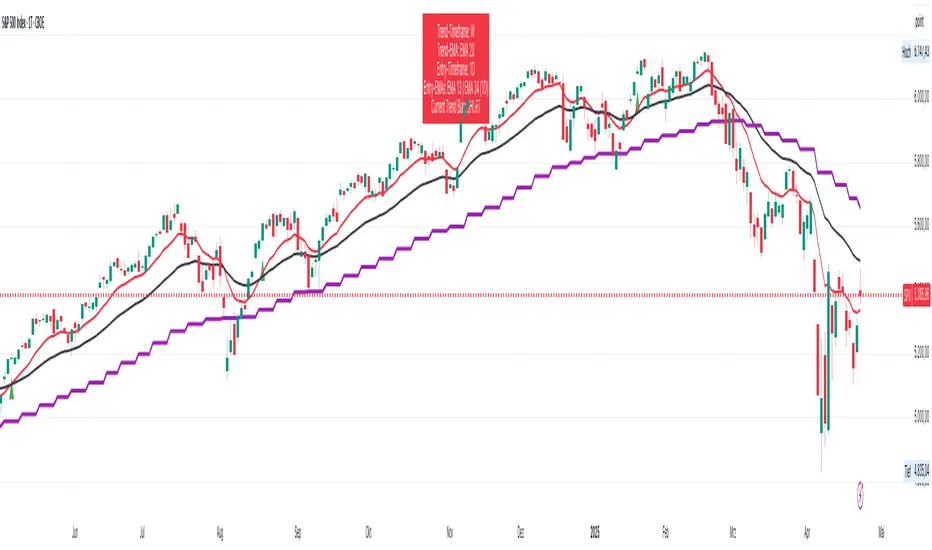
Ryna 3 EMA Multi-Timeframe Indicator**EMA Multi-Timeframe Strategy (Pine Script v6)**
This TradingView indicator is designed to assist traders using a **multi-timeframe trend-following strategy** based on Exponential Moving Averages (EMAs).
**Core Functionality**
- **Trend Identification:**
Uses a configurable **EMA (e.g., EMA 50)** on a **higher timeframe** (e.g., H1, D1, W1) to determine the market bias:
- If price is **above** the trend EMA → **Long bias**
- If price is **below** the trend EMA → **Short bias**
- **Entry Signals:**
Uses two EMAs (fast & slow, e.g., EMA 8 & EMA 21) on either:
- The **current chart timeframe**, or
- A **separately selected timeframe** (e.g., entry on M15, trend on H1)
→ Signals are generated based on **EMA crossovers**:
- **Bullish crossover** (fast crosses above slow) → Long signal
- **Bearish crossover** (fast crosses below slow) → Short signal
- Only when aligned with the higher-timeframe trend
- **Visual Output:**
- Optional display of entry EMAs when sourced from the trend timeframe
- Always displays the trend EMA
- Entry signals shown with triangle markers on the chart
- **Info Panel (Top Center):**
- Shows selected timeframes and EMA settings
- Indicates current trend bias (LONG / SHORT / NEUTRAL)
- Notes if entry EMAs are hidden due to settings
- **Alerts:**
- Optional alerts for long and short entry signals based on EMA crossovers
#### **User Inputs**
- **Trend Timeframe & EMA Length**
- **Entry Timeframe & EMA Fast/Slow Lengths**
- **Option to show/hide entry EMAs when using the trend timeframe**
- **Option to show/hide Infobox on Chart**
Multi-Timeframe MA DashboardThis indicator monitors 5 timeframes: 5min, 15min, 1hr, 4hr, and Daily. It displays fast and slow moving averages for each timeframe, along with the current price. The trend direction is color-coded: green for bullish (fast MA above slow MA) and red for bearish (fast MA below slow MA).
The dashboard also shows the last crossover signal (Buy/Sell) for each timeframe.
Visual arrows are plotted on the chart for the current timeframe. A green up arrow indicates a potential bullish crossover (Buy signal), while a red down arrow indicates a potential bearish crossover (Sell signal).
The dashboard is elegant and professional, with alternating row colors for better readability. It can be placed in any corner of the screen and customized with user-defined colors for bullish and bearish trends.
Alerts are triggered when a crossover occurs on any timeframe. These alerts include the timeframe and signal type (e.g., "5min: ↑ BUY").
How to Read the Indicator
The dashboard displays the following for each timeframe:
Fast MA: The value of the fast moving average.
Slow MA: The value of the slow moving average.
Price: The current price for the timeframe.
Trend: The current trend direction (Bullish or Bearish).
Signal: The last crossover signal (↑ BUY or ↓ SELL).
On the chart, green up arrows indicate a bullish crossover (Fast MA crosses above Slow MA), while red down arrows indicate a bearish crossover (Fast MA crosses below Slow MA).
Green text in the dashboard indicates a bullish trend or signal, while red text indicates a bearish trend or signal.
How to Use the Indicator
Use the dashboard to monitor the trend direction across multiple timeframes. Look for confluence (agreement) between timeframes to identify stronger trends. Observe the "Signal" column in the dashboard for the last crossover on each timeframe. Use the arrows on the chart to identify potential crossover points for the current timeframe.
Enable alerts to be notified of crossover signals on any timeframe. Alerts include the timeframe and signal type for easy reference.
Adjust the fast and slow moving average lengths to suit your trading style. Choose between EMA, SMA, or WMA for the moving average type. Customize the dashboard placement and colors for better visibility.
Important Notes
This indicator is not a buy or sell recommendation. It is a tool to assist traders in their analysis. Always use this indicator in conjunction with other tools, such as support/resistance levels, volume analysis, and price action. Past performance of moving averages does not guarantee future results.
How to Add the Indicator
Add the indicator to your chart from the TradingView library. Configure the inputs:
Fast MA Length: Default is 20.
Slow MA Length: Default is 50.
MA Type: Choose between EMA, SMA, or WMA.
Dashboard Placement: Select the corner of the screen where the dashboard will appear.
Colors: Customize the colors for bullish and bearish trends.
Monitor the dashboard and chart for trends and signals.
Disclaimer
This indicator is for educational and informational purposes only. It does not provide financial, investment, or trading advice. Always perform your own analysis and consult with a financial advisor before making trading decisions.

Uptrick: Z-Score FlowOverview
Uptrick: Z-Score Flow is a technical indicator that integrates trend-sensitive momentum analysi s with mean-reversion logic derived from Z-Score calculations. Its primary objective is to identify market conditions where price has either stretched too far from its mean (overbought or oversold) or sits at a statistically “normal” range, and then cross-reference this observation with trend direction and RSI-based momentum signals. The result is a more contextual approach to trade entry and exit, emphasizing precision, clarity, and adaptability across varying market regimes.
Introduction
Financial instruments frequently transition between trending modes, where price extends strongly in one direction, and ranging modes, where price oscillates around a central value. A simple statistical measure like Z-Score can highlight price extremes by comparing the current price against its historical mean and standard deviation. However, such extremes alone can be misleading if the broader market structure is trending forcefully. Uptrick: Z-Score Flow aims to solve this gap by combining Z-Score with an exponential moving average (EMA) trend filter and a smoothed RSI momentum check, thus filtering out signals that contradict the prevailing market environment.
Purpose
The purpose of this script is to help traders pinpoint both mean-reversion opportunities and trend-based pullbacks in a way that is statistically grounded yet still mindful of overarching price action. By pairing Z-Score thresholds with supportive conditions, the script reduces the likelihood of acting on random price spikes or dips and instead focuses on movements that are significant within both historical and current contextual frameworks.
Originality and Uniquness
Layered Signal Verification: Signals require the fulfillment of multiple layers (Z-Score extreme, EMA trend bias, and RSI momentum posture) rather than merely breaching a statistical threshold.
RSI Zone Lockout: Once RSI enters an overbought/oversold zone and triggers a signal, the script locks out subsequent signals until RSI recovers above or below those zones, limiting back-to-back triggers.
Controlled Cooldown: A dedicated cooldown mechanic ensures that the script waits a specified number of bars before issuing a new signal in the opposite direction.
Gradient-Based Visualization: Distinct gradient fills between price and the Z-Mean line enhance readability, showing at a glance whether price is trading above or below its statistical average.
Comprehensive Metrics Panel: An optional on-chart table summarizes the Z-Score’s key metrics, streamlining the process of verifying current statistical extremes, mean levels, and momentum directions.
Why these indicators were merged
Z-Score measurements excel at identifying when price deviates from its mean, but they do not intrinsically reveal whether the market’s trajectory supports a reversion or if price might continue along its trend. The EMA, commonly used for spotting trend directions, offers valuable insight into whether price is predominantly ascending or descending. However, relying solely on a trend filter overlooks the intensity of price moves. RSI then adds a dedicated measure of momentum, helping confirm if the market’s energy aligns with a potential reversal (for example, price is statistically low but RSI suggests looming upward momentum). By uniting these three lenses—Z-Score for statistical context, EMA for trend direction, and RSI for momentum force—the script offers a more comprehensive and adaptable system, aiming to avoid false positives caused by focusing on just one aspect of price behavior.
Calculations
The core calculation begins with a simple moving average (SMA) of price over zLen bars, referred to as the basis. Next, the script computes the standard deviation of price over the same window. Dividing the difference between the current price and the basis by this standard deviation produces the Z-Score, indicating how many standard deviations the price is from its mean. A positive Z-Score reveals price is above its average; a negative reading indicates the opposite.
To detect overall market direction, the script calculates an exponential moving average (emaTrend) over emaTrendLen bars. If price is above this EMA, the script deems the market bullish; if below, it’s considered bearish. For momentum confirmation, the script computes a standard RSI over rsiLen bars, then applies a smoothing EMA over rsiEmaLen bars. This smoothed RSI (rsiEma) is monitored for both its absolute level (oversold or overbought) and its slope (the difference between the current and previous value). Finally, slopeIndex determines how many bars back the script compares the basis to check whether the Z-Mean line is generally rising, falling, or flat, which then informs the coloring scheme on the chart.
Calculations and Rational
Simple Moving Average for Baseline: An SMA is used for the core mean because it places equal weight on each bar in the lookback period. This helps maintain a straightforward interpretation of overbought or oversold conditions in the context of a uniform historical average.
Standard Deviation for Volatility: Standard deviation measures the variability of the data around the mean. By dividing price’s difference from the mean by this value, the Z-Score can highlight whether price is unusually stretched given typical volatility.
Exponential Moving Average for Trend: Unlike an SMA, an EMA places more emphasis on recent data, reacting quicker to new price developments. This quicker response helps the script promptly identify trend shifts, which can be crucial for filtering out signals that go against a strong directional move.
RSI for Momentum Confirmation: RSI is an oscillator that gauges price movement strength by comparing average gains to average losses over a set period. By further smoothing this RSI with another EMA, short-lived oscillations become less influential, making signals more robust.
SlopeIndex for Slope-Based Coloring: To clarify whether the market’s central tendency is rising or falling, the script compares the basis now to its level slopeIndex bars ago. A higher current reading indicates an upward slope; a lower reading, a downward slope; and similar readings, a flat slope. This is visually represented on the chart, providing an immediate sense of the directionality.
Inputs
zLen (Z-Score Period)
Specifies how many bars to include for computing the SMA and standard deviation that form the basis of the Z-Score calculation. Larger values produce smoother but slower signals; smaller values catch quick changes but may generate noise.
emaTrendLen (EMA Trend Filter)
Sets the length of the EMA used to detect the market’s primary direction. This is pivotal for distinguishing whether signals should be considered (price aligning with an uptrend or downtrend) or filtered out.
rsiLen (RSI Length)
Defines the window for the initial RSI calculation. This RSI, when combined with the subsequent smoothing EMA, forms the foundation for momentum-based signal confirmations.
rsiEmaLen (EMA of RSI Period)
Applies an exponential moving average over the RSI readings for additional smoothing. This step helps mitigate rapid RSI fluctuations that might otherwise produce whipsaw signals.
zBuyLevel (Z-Score Buy Threshold)
Determines how negative the Z-Score must be for the script to consider a potential oversold signal. If the Z-Score dives below this threshold (and other criteria are met), a buy signal is generated.
zSellLevel (Z-Score Sell Threshold)
Determines how positive the Z-Score must be for a potential overbought signal. If the Z-Score surpasses this threshold (and other checks are satisfied), a sell signal is generated.
cooldownBars (Cooldown (Bars))
Enforces a bar-based delay between opposite signals. Once a buy signal has fired, the script must wait the specified number of bars before registering a new sell signal, and vice versa.
slopeIndex (Slope Sensitivity (Bars))
Specifies how many bars back the script compares the current basis for slope coloration. A bigger slopeIndex highlights larger directional trends, while a smaller number emphasizes shorter-term shifts.
showMeanLine (Show Z-Score Mean Line)
Enables or disables the plotting of the Z-Mean and its slope-based coloring. Traders who prefer minimal chart clutter may turn this off while still retaining signals.
Features
Statistical Core (Z-Score Detection):
This feature computes the Z-Score by taking the difference between the current price and the basis (SMA) and dividing by the standard deviation. In effect, it translates price fluctuations into a standardized measure that reveals how significant a move is relative to the typical variation seen over the lookback. When the Z-Score crosses predefined thresholds (zBuyLevel for oversold and zSellLevel for overbought), it signals that price could be at an extreme.
How It Works: On each bar, the script updates the SMA and standard deviation. The Z-Score is then refreshed accordingly. Traders can interpret particularly large negative or positive Z-Score values as scenarios where price is abnormally low or high.
EMA Trend Filter:
An EMA over emaTrendLen bars is used to classify the market as bullish if the price is above it and bearish if the price is below it. This classification is applied to the Z-Score signals, accepting them only when they align with the broader price direction.
How It Works: If the script detects a Z-Score below zBuyLevel, it further checks if price is actually in a downtrend (below EMA) before issuing a buy signal. This might seem counterintuitive, but a “downtrend” environment plus an oversold reading often signals a potential bounce or a mean-reversion play. Conversely, for sell signals, the script checks if the market is in an uptrend first. If it is, an overbought reading aligns with potential profit-taking.
RSI Momentum Confirmation with Oversold/Overbought Lockout:
RSI is calculated over rsiLen, then smoothed by an EMA over rsiEmaLen. If this smoothed RSI dips below a certain threshold (for example, 30) and then begins to slope upward, the indicator treats it as a potential sign of recovering momentum. Similarly, if RSI climbs above a certain threshold (for instance, 70) and starts to slope downward, that suggests dwindling momentum. Additionally, once RSI is in these zones, the indicator locks out repetitive signals until RSI fully exits and re-enters those extreme territories.
How It Works: Each bar, the script measures whether RSI has dropped below the oversold threshold (like 30) and has a positive slope. If it does, the buy side is considered “unlocked.” For sell signals, RSI must exceed an overbought threshold (70) and slope downward. The combination of threshold and slope helps confirm that a reversal is genuinely in progress instead of issuing signals while momentum remains weak or stuck in extremes.
Cooldown Mechanism:
The script features a custom bar-based cooldown that prevents issuing new signals in the opposite direction immediately after one is triggered. This helps avoid whipsaw situations where the market quickly flips from oversold to overbought or vice versa.
How It Works: When a buy signal fires, the indicator notes the bar index. If the Z-Score and RSI conditions later suggest a sell, the script compares the current bar index to the last buy signal’s bar index. If the difference is within cooldownBars, the signal is disallowed. This ensures a predefined “quiet period” before switching signals.
Slope-Based Coloring (Z-Mean Line and Shadow):
The script compares the current basis value to its value slopeIndex bars ago. A higher reading now indicates a generally upward slope, while a lower reading indicates a downward slope. The script then shades the Z-Mean line in a corresponding bullish or bearish color, or remains neutral if little change is detected.
How It Works: This slope calculation is refreshingly straightforward: basis – basis . If the result is positive, the line is colored bullish; if negative, it is colored bearish; if approximately zero, it remains neutral. This provides a quick visual cue of the medium-term directional bias.
Gradient Overlays:
With gradient fills, the script highlights where price stands in relation to the Z-Mean. When price is above the basis, a purple-shaded region is painted, visually indicating a “bearish zone” for potential overbought conditions. When price is below, a teal-like overlay is used, suggesting a “bullish zone” for potential oversold conditions.
How It Works: Each bar, the script checks if price is above or below the basis. It then applies a fill between close and basis, using distinct colors to show whether the market is trading above or below its mean. This creates an immediate sense of how extended the market might be.
Buy and Sell Labels (with Alerts):
When a legitimate buy or sell condition passes every check (Z-Score threshold, EMA trend alignment, RSI gating, and cooldown clearance), the script plots a corresponding label directly on the chart. It also fires an alert (if alerts are set up), making it convenient for traders who want timely notifications.
How It Works: If rawBuy or rawSell conditions are met (refined by RSI, EMA trend, and cooldown constraints), the script calls the respective plot function to paint an arrow label on the chart. Alerts are triggered simultaneously, carrying easily recognizable messages.
Metrics Table:
The optional on-chart table (activated by showMetrics) presents real-time Z-Score data, including the current Z-Score, its rolling mean, the maximum and minimum Z-Score values observed over the last zLen bars, a percentile position, and a short-term directional note (rising, falling, or flat).
Current – The present Z-Score reading
Mean – Average Z-Score over the zLen period
Min/Max – Lowest and highest Z-Score values within zLen
Position – Where the current Z-Score sits between the min and max (as a percentile)
Trend – Whether the Z-Score is increasing, decreasing, or flat
Conclusion
Uptrick: Z-Score Flow offers a versatile solution for traders who need a statistically informed perspective on price extremes combined with practical checks for overall trend and momentum. By leveraging a well-defined combination of Z-Score, EMA trend classification, RSI-based momentum gating, slope-based visualization, and a cooldown mechanic, the script reduces the occurrence of false or premature signals. Its gradient fills and optional metrics table contribute further clarity, ensuring that users can quickly assess market posture and make more confident trading decisions in real time.
Disclaimer
This script is intended solely for informational and educational purposes. Trading in any financial market comes with substantial risk, and there is no guarantee of success or the avoidance of loss. Historical performance does not ensure future results. Always conduct thorough research and consider professional guidance prior to making any investment or trading decisions.

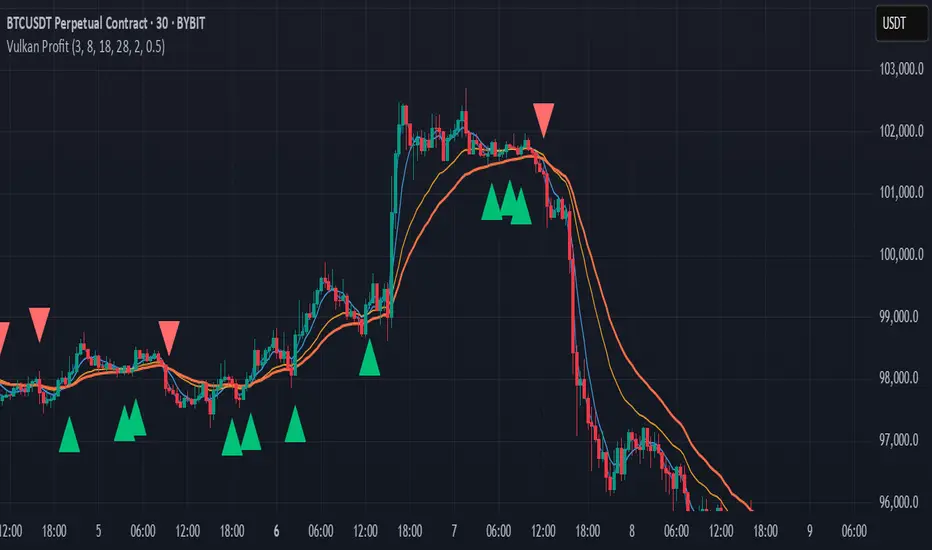
Vulkan Profit
Overview
The Vulkan Profit indicator is a trend-following tool that identifies potential entry and exit points by monitoring the relationship between short-term and long-term moving averages. It generates clear buy and sell signals when specific moving average conditions align, making it useful for traders looking to confirm trend changes across multiple timeframes.
How It Works
The indicator utilizes four different moving averages:
Fast WMA (period 3) - A highly responsive weighted moving average
Medium WMA (period 8) - A less sensitive weighted moving average
Fast EMA (period 18) - A responsive exponential moving average
Slow EMA (period 28) - A slower exponential moving average
These moving averages are grouped into two categories:
Short-term MAs: Fast WMA and Medium WMA
Long-term MAs: Fast EMA and Slow EMA
Signal Generation Logic
The Vulkan Profit indicator generates signals based on the relative positions of these moving averages:
Buy Signal (Green Triangle)
A buy signal appears when the minimum value of the short-term MAs becomes greater than the maximum value of the long-term MAs. In other words, when both short-term MAs cross above both long-term MAs.
Sell Signal (Red Triangle)
A sell signal appears when the maximum value of the short-term MAs becomes less than the minimum value of the long-term MAs. In other words, when both short-term MAs cross below both long-term MAs.
Visual Components
Moving Averages - All four moving averages can be displayed or hidden
Signal Arrows - Green triangles for buy signals, red triangles for sell signals
Colored Line - A line that changes color based on the current market stance (green for bullish, red for bearish)
Customization Options
The indicator offers several customization settings:
Toggle the visibility of moving averages
Toggle the visibility of buy/sell signals
Adjust the color, width, and position of the signal line
Choose between different line styles (Line, Stepline, Histogram)
Practical Trading Applications
Trend Identification: The relative positioning of all moving averages helps identify the current market trend
Entry/Exit Points: The buy and sell signals can be used as potential entry and exit points
Trend Confirmation: The colored line provides ongoing confirmation of the trend direction
Filter: Can be used in conjunction with other indicators as a trend filter
Trading Strategy Suggestions
Trend Following: Enter long positions on buy signals and exit on sell signals during trending markets
Confirmation Tool: Use the signals to confirm trades identified by other indicators
Timeframe Analysis: Apply the indicator across multiple timeframes for stronger confirmation
Risk Management: Place stop-loss orders below recent swing lows for long positions and above recent swing highs for short positions
Tips for Best Results
The indicator performs best in trending markets and may generate false signals in ranging or highly volatile markets
Consider the broader market context before taking trades based solely on these signals
Use appropriate position sizing and risk management regardless of the indicator's signals
The longer timeframes generally produce more reliable signals with fewer false positives
The Vulkan Profit indicator combines the responsiveness of short-term averages with the stability of long-term averages to capture significant trend changes while filtering out minor price fluctuations.
Trend Strength MeterThe Trend Strength Meter (TSM) is a powerful and versatile indicator designed to help traders identify market trends, measure their strength, and detect potential reversals with ease. This indicator combines the power of moving averages, divergence detection, and a clean, customizable dashboard to provide actionable insights for traders of all levels.
How It Works
Trend Strength Calculation:
1. The TSM calculates the trend strength using the difference between two Exponential Moving Averages (EMAs): a fast EMA (default: 20) and a slow EMA (default: 50).
2. The difference is expressed as a percentage of the slow EMA, providing a clear measure of the trend's strength and direction.
Histogram Visualization:
1. A color-coded histogram visually represents the trend strength:
Green: Bullish trend
Red: Bearish trend
Gray: Neutral or no significant trend
2. A smoothed trend strength line (SMA of the trend strength) is also plotted for better clarity.
Divergence Detection:
1. The indicator detects bullish and bearish divergences using the RSI (Relative Strength Index) and price action.
2. Bullish Divergence: Price makes a lower low, but RSI makes a higher low, signaling potential upward momentum.
3. Bearish Divergence: Price makes a higher high, but RSI makes a lower high, signaling potential downward momentum.
=> Divergences are marked with arrows on the chart:
Green Arrow: Bullish divergence
Red Arrow: Bearish divergence
Dashboard:
1. A clean and informative dashboard displays key information:
Trend Strength Value: The current strength of the trend
Trend Direction: Bullish, Bearish, or Neutral
Last Signal: Buy, Sell, or None (based on divergence signals)
The dashboard is fully customizable and can be positioned anywhere on the chart (e.g., top-right, bottom-left, center, etc.).
Key Features
1. Trend Strength Measurement: Quickly identify the strength and direction of the trend.
2. Divergence Detection: Spot potential reversals before they occur with bullish and bearish divergence signals.
3. Customizable Dashboard: Move the dashboard to your preferred location on the chart for better visibility.
4. User-Friendly Design: Clean visuals and intuitive color coding make it easy to interpret market conditions.
5. Actionable Signals: Provides clear Buy/Sell signals based on divergence, helping traders make informed decisions.
How to Use
1. Trend Confirmation:
Use the histogram and trend strength value to confirm the current market trend.
Green bars indicate a bullish trend, while red bars indicate a bearish trend.
2. Divergence Signals:
Look for divergence arrows (green for bullish, red for bearish) to anticipate potential reversals.
Combine divergence signals with other technical analysis tools for higher accuracy.
3. Dashboard Insights:
Monitor the dashboard for real-time updates on trend strength, direction, and the latest signal.
Use the "Last Signal" (Buy/Sell) to validate your trading decisions.
4. Custom Settings:
Adjust the EMA lengths and divergence lookback period to suit your trading style and timeframe.
Position the dashboard anywhere on the chart for convenience.
Best Practices
1. Use the TSM in conjunction with other indicators or price action analysis for confirmation.
2. Test the indicator on different timeframes to find the one that works best for your strategy.
3. Always practice proper risk management when trading.
Disclaimer
This indicator is a tool to assist in technical analysis and should not be used as a standalone trading strategy. Past performance is not indicative of future results. Always conduct your own research and consult with a financial advisor before making trading decisions.

Adv EMA Cloud v6 (ADX, Alerts)Summary:
This indicator provides a multi-faceted view of market trends using Exponential Moving Averages (EMAs) arranged in visually intuitive clouds, enhanced with an optional ADX-based range filter and configurable alerts for key market conditions. It aims to help traders quickly gauge trend alignment across short, medium, and long timeframes while filtering signals during potentially choppy market conditions.
Key Features:
Multiple EMAs: Displays 10-period (Fast), 20-period (Mid), and 50-period (Slow) EMAs.
Long-Term Trend Filter: Includes a 200-period EMA to provide context for the overall dominant trend direction.
Dual EMA Clouds:
Fast/Mid Cloud (10/20 EMA): Fills the area between the 10 and 20 EMAs. Defaults to Green when 10 > 20 (bullish short-term momentum) and Red when 10 < 20 (bearish short-term momentum).
Mid/Slow Cloud (20/50 EMA): Fills the area between the 20 and 50 EMAs. Defaults to Aqua when 20 > 50 (bullish mid-term trend) and Fuchsia when 20 < 50 (bearish mid-term trend).
Optional ADX Range Filter: Uses the Average Directional Index (ADX) to identify potentially non-trending or choppy markets. When enabled and ADX falls below a user-defined threshold, the EMA clouds will turn grey, visually warning that trend-following signals may be less reliable.
Configurable Alerts: Provides several built-in alert conditions using Pine Script's alertcondition function:
Confluence Condition: Triggers when a 10/20 EMA crossover occurs while both EMA clouds show alignment (both bullish/green/aqua or both bearish/red/fuchsia) and price respects the 200 EMA filter and the ADX filter indicates a trend (if filters are enabled).
MA Filter Cross: Triggers when price crosses above or below the 200 EMA filter line.
Full Alignment Start: Triggers on the first bar where full bullish or bearish alignment occurs (both clouds aligned + MA filter respected + ADX trending, if filters are enabled).
How It Works:
EMA Calculation: Standard Exponential Moving Averages are calculated for the 10, 20, 50, and 200 periods based on the closing price.
Cloud Creation: The fill() function visually shades the area between the 10 & 20 EMAs and the 20 & 50 EMAs.
Cloud Coloring: The color of each cloud is determined by the relationship between the two EMAs that define it (e.g., if EMA 10 is above EMA 20, the first cloud is bullish-colored).
ADX Filter Logic: The script calculates the ADX value. If the "Use ADX Trend Filter?" input is checked and the calculated ADX is below the specified "ADX Trend Threshold", the script considers the market potentially ranging.
ADX Visual Effect: During detected ranging periods (if the ADX filter is active), the plotCloud12Color and plotCloud23Color variables are assigned a neutral grey color instead of their normal bullish/bearish colors before being passed to the fill() function.
Alert Logic: Boolean variables track the specific conditions (crossovers, cloud alignment, filter positions, ADX state). The alertcondition() function creates triggerable alerts based on these pre-defined conditions.
Potential Interpretation (Not Financial Advice):
Trend Alignment: When both clouds share the same directional color (e.g., both bullish - Green & Aqua) and price is on the corresponding side of the 200 EMA filter, it may suggest a stronger, more aligned trend. Conversely, conflicting cloud colors may indicate indecision or transition.
Dynamic Support/Resistance: The EMA lines themselves (especially the 20, 50, and 200) can sometimes act as dynamic levels where price might react.
Range Warning: Greyed-out clouds (when ADX filter is enabled) serve as a visual warning that trend-based strategies might face increased difficulty or whipsaws.
Confluence Alerts: The specific confluence alerts signal moments where multiple conditions align (crossover + cloud agreement + filters), which some traders might view as higher-probability setups.
Customization:
All EMA lengths (10, 20, 50, 200) are adjustable via the Inputs menu.
The ADX length and threshold are configurable.
The MA Trend Filter and ADX Trend Filter can be independently enabled or disabled.
Disclaimer:
This indicator is provided for informational and educational purposes only. Trading financial markets involves significant risk. Past performance is not indicative of future results. Always conduct your own thorough analysis and consider your risk tolerance before making any trading decisions. This indicator should be used in conjunction with other analysis methods and tools. Do not trade based solely on the signals or visuals provided by this indicator.

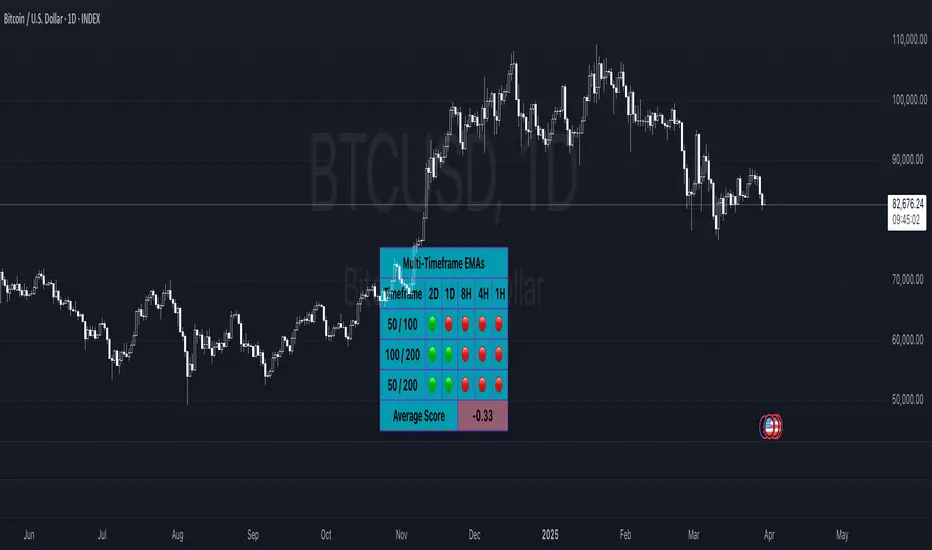
Multi-Timeframe EMAsMulti Timeframe EMA's
The 'Multi-Timeframe EMA Band Comparison' indicator is a tool designed to analyze trend direction across multiple timeframes using Exponential Moving Averages. it calculates the 50, 100, and 200 period EMAs for fiver user defined timeframes and compares their relationships to provide a visual snapshot of bullish or bearish momentum.
How it Works:
EMA Calculations: For each selected timeframe, the indicator computes the 50, 100, and 200 period EMAs based on the closing price.
Band Comparisons: Three key relationships are evaluated:
50 EMA vs 100 EMA
100 EMA vs 200 EMA
50 EMA vs 200 EMA
Scoring System: Each comparison is assigned a score:
🟢 (Green Circle): The shorter EMA is above the longer EMA, signaling bullish momentum.
🔴 (Red Circle): The shorter EMA is below the longer EMA, signaling bearish momentum.
⚪️ (White Circle): The EMAs are equal or data is unavailable (rare).
Average Score:
An overall average score is calculated across all 15 comparisons ranging from 1 to -1, displayed with two decimal places and color coded.
Customization:
This indicator is fully customizable from the timeframe setting to the color of the table. The only specific part that is not changeable is the EMA bands.
Long Term Profitable Swing | AbbasA Story of a Profitable Swing Trading Strategy
Imagine you're sailing across the ocean, looking for the perfect wave to ride. Swing trading is quite similar—you're navigating the stock market, searching for the ideal moments to enter and exit trades. This strategy, created by Abbas, helps you find those waves and ride them effectively to profitable outcomes.
🌊 Finding the Perfect Wave (Entry)
Our journey begins with two simple signs that tell us a great trading opportunity is forming:
- Moving Averages: We use two lines that follow price trends—the faster one (EMA 16) reacts quickly to recent price moves, and the slower one (EMA 30) gives us a longer-term perspective. When the faster line crosses above the slower line, it's like a clear signal saying, "Hey! The wave is rising, and prices might move higher!"
- RSI Momentum: Next, we check a tool called the RSI, which measures momentum (how strongly prices are moving). If the RSI number is above 50, it means there's enough strength behind this rising wave to carry us forward.
When both signals appear together, that's our green light. It's time to jump on our surfboard and start riding this promising wave.
⚓ Safely Riding the Wave (Risk Management)
While we're riding this wave, we want to ensure we're safe from sudden surprises. To do this, we use something called the Average True Range (ATR), which measures how volatile (or bumpy) the price movements are:
- Stop-Loss: To avoid falling too hard, we set a safety line (stop-loss) 8 times the ATR below our entry price. This helps ensure we exit if the wave suddenly turns against us, protecting us from heavy losses.
- Take Profit: We also set a goal to exit the trade at 11 times the ATR above our entry. This way, we capture significant profits when the wave reaches a nice high point.
🌟 Multiple Rides, Bigger Adventures
This strategy allows us to take multiple positions simultaneously—like riding several waves at once, up to 5. Each trade we make uses only 10% of our trading capital, keeping risks manageable and giving us multiple opportunities to win big.
🗺️ Easy to Follow Settings
Here are the basic settings we use:
- Fast EMA**: 16
- Slow EMA**: 30
- RSI Length**: 9
- RSI Threshold**: 50
- ATR Length**: 21
- ATR Stop-Loss Multiplier**: 8
- ATR Take-Profit Multiplier**: 11
These settings are flexible—you can adjust them to better suit different markets or your personal trading style.
🎉 Riding the Waves of Success
This simple yet powerful swing trading approach helps you confidently enter trades, clearly know when to exit, and effectively manage your risk. It’s a reliable way to ride market waves, capture profits, and minimize losses.
Happy trading, and may you find many profitable waves to ride! 🌊✨
Please test, and take into account that it depends on taking multiple longs within the swing, and you only get to invest 25/30% of your equity.

Combined EMA Technical AnalysisThis script is written in Pine Script (version 5) for TradingView and creates a comprehensive technical analysis indicator called "Combined EMA Technical Analysis." It overlays multiple technical indicators on a price chart, including Exponential Moving Averages (EMAs), VWAP, MACD, PSAR, RSI, Bollinger Bands, ADX, and external data from the S&P 500 (SPX) and VIX indices. The script also provides visual cues through colors, shapes, and a customizable table to help traders interpret market conditions.
Here’s a breakdown of the script:
---
### **1. Purpose**
- The script combines several popular technical indicators to analyze price trends, momentum, volatility, and market sentiment.
- It uses color coding (green for bullish, red for bearish, gray/white for neutral) and a table to display key information.
---
### **2. Custom Colors**
- Defines custom RGB colors for bullish (`customGreen`), bearish (`customRed`), and neutral (`neutralGray`) signals to enhance visual clarity.
---
### **3. User Inputs**
- **EMA Colors**: Users can customize the colors of five EMAs (8, 20, 9, 21, 50 periods).
- **MACD Settings**: Adjustable short length (12), long length (26), and signal length (9).
- **RSI Settings**: Adjustable length (14).
- **Bollinger Bands Settings**: Length (20), multiplier (2), and proximity threshold (0.1% of band width).
- **ADX Settings**: Adjustable length (14).
- **Table Settings**: Position (e.g., "Bottom Right") and text size (e.g., "Small").
---
### **4. Indicator Calculations**
#### **Exponential Moving Averages (EMAs)**
- Calculates five EMAs: 8, 20, 9, 21, and 50 periods based on the closing price.
- Used to identify short-term and long-term trends.
#### **Volume Weighted Average Price (VWAP)**
- Resets daily and calculates the average price weighted by volume.
- Color-coded: green if price > VWAP (bullish), red if price < VWAP (bearish), white if neutral.
#### **MACD (Moving Average Convergence Divergence)**
- Uses short (12) and long (26) EMAs to compute the MACD line, with a 9-period signal line.
- Displays "Bullish" (green) if MACD > signal, "Bearish" (red) if MACD < signal.
#### **Parabolic SAR (PSAR)**
- Calculated with acceleration factors (start: 0.02, increment: 0.02, max: 0.2).
- Indicates trend direction: green if price > PSAR (bullish), red if price < PSAR (bearish).
#### **Relative Strength Index (RSI)**
- Measures momentum over 14 periods.
- Highlighted in green if > 70 (overbought), red if < 30 (oversold), white otherwise.
#### **Bollinger Bands (BB)**
- Uses a 20-period SMA with a 2-standard-deviation multiplier.
- Color-coded based on price position:
- Green: Above upper band or close to it.
- Red: Below lower band or close to it.
- Gray: Neutral (within bands).
#### **Average Directional Index (ADX)**
- Manually calculates ADX to measure trend strength:
- Strong trend: ADX > 25.
- Very strong trend: ADX > 50.
- Direction: Bullish if +DI > -DI, bearish if -DI > +DI.
#### **EMA Crosses**
- Detects bullish (crossover) and bearish (crossunder) events for:
- EMA 9 vs. EMA 21.
- EMA 8 vs. EMA 20.
- Visualized with green (bullish) or red (bearish) circles.
#### **SPX and VIX Data**
- Fetches daily closing prices for the S&P 500 (SPX) and VIX (volatility index).
- SPX trend: Bullish if EMA 9 > EMA 21, bearish if EMA 9 < EMA 21.
- VIX levels: High (> 25, fear), Low (< 15, stability).
- VIX color: Green if SPX bullish and VIX low, red if SPX bearish and VIX high, white otherwise.
---
### **5. Visual Outputs**
#### **Plots**
- EMAs, VWAP, and PSAR are plotted on the chart with their respective colors.
- EMA crosses are marked with circles (green for bullish, red for bearish).
#### **Table**
- Displays a summary of indicators in a customizable position and size.
- Indicators shown (if enabled):
- EMA 8/20, 9/21, 50: Green dot if bullish, red if bearish.
- VWAP: Green if price > VWAP, red if price < VWAP.
- MACD: Green if bullish, red if bearish.
- MACD Zero: Green if MACD > 0, red if MACD < 0.
- PSAR: Green if price > PSAR, red if price < PSAR.
- ADX: Arrows for very strong trends (↑/↓), dots for weaker trends, colored by direction.
- Bollinger Bands: Arrows (↑/↓) or dots based on price position.
- RSI: Numeric value, colored by overbought/oversold levels.
- VIX: Numeric value, colored based on SPX trend and VIX level.
---
### **6. Alerts**
- Triggers alerts for EMA 8/20 crosses:
- Bullish: "EMA 8/20 Bullish Cross on Candle Close!"
- Bearish: "EMA 8/20 Bearish Cross on Candle Close!"
---
### **7. Key Features**
- **Flexibility**: Users can toggle indicators on/off in the table and adjust parameters.
- **Visual Clarity**: Consistent use of green (bullish), red (bearish), and neutral colors.
- **Comprehensive**: Combines trend, momentum, volatility, and market sentiment indicators.
---
### **How to Use**
1. Add the script to TradingView.
2. Customize inputs (colors, lengths, table position) as needed.
3. Interpret the chart and table:
- Green signals suggest bullish conditions.
- Red signals suggest bearish conditions.
- Neutral signals indicate indecision or consolidation.
4. Set up alerts for EMA crosses to catch trend changes.
This script is ideal for traders who want a multi-indicator dashboard to monitor price action and market conditions efficiently.

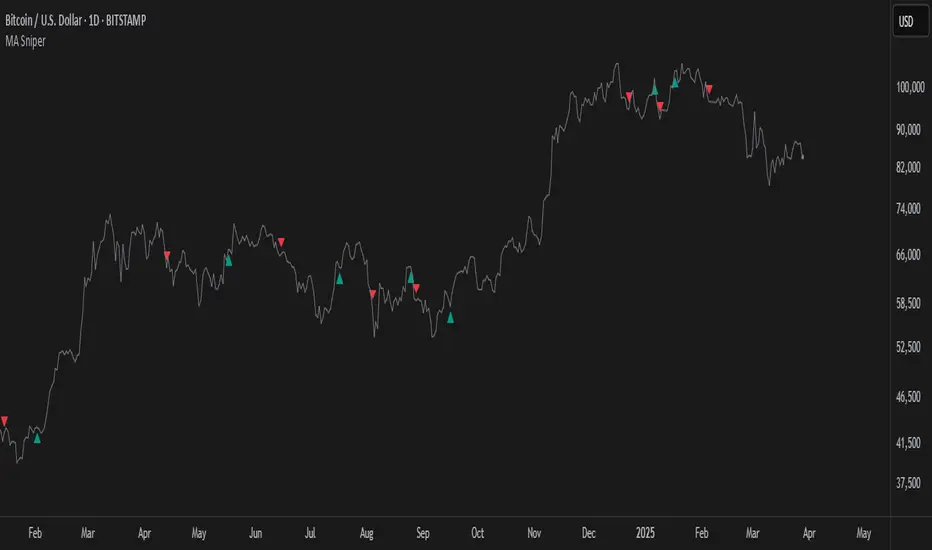
MA SniperThis indicator automatically finds the most effective moving average to use in a price crossover strategy—so you can focus on trading, not testing. It continuously evaluates a wide range of moving average periods, ranks them based on real-time market performance, and selects the one delivering the highest quality signals. The result? A smarter, adaptive tool that shows you exactly when price crosses its optimal moving average—bullish signals in green, bearish in red.
What makes it unique is the way it thinks.
Under the hood, the script doesn’t just pick a random MA or let you choose one manually. Instead, it backtests a large panel of moving average lengths for the current asset and timeframe. It evaluates each one by calculating its **Profit Factor**—a key performance metric used by pros to measure the quality of a strategy. Then, it assigns each MA a score and ranks them in a clean, built-in table so you can see, at a glance, which ones are currently most effective.
From that list, it picks the top-performing MA and uses it to generate live crossover signals on your chart. That MA is plotted automatically, and the signals adapt in real-time. This isn’t a static setup—it’s a dynamic system that evolves as the market evolves.
Even better: the indicator detects the type of instrument you’re trading (forex, stocks, etc.) and adjusts its internal calculations accordingly, including how many bars per day to consider. That means it remains highly accurate whether you’re trading EURUSD, SPX500, or TSLA.
You also get a real-time dashboard (via the table) that acts as a transparent scorecard. Want to see how other MAs are doing? You can. Want to understand why a certain MA was selected? The data is right there.
This tool is for traders who love crossover strategies but want something smarter, faster, and more precise—without spending hours manually testing. Whether you're scalping or swing trading, it offers a data-driven edge that’s hard to ignore.
Give it a try—you’ll quickly see how powerful it can be when your MA does the thinking for you.
This tool is for informational and educational purposes only. Trading involves risk, and past performance does not guarantee future results. Use responsibly.
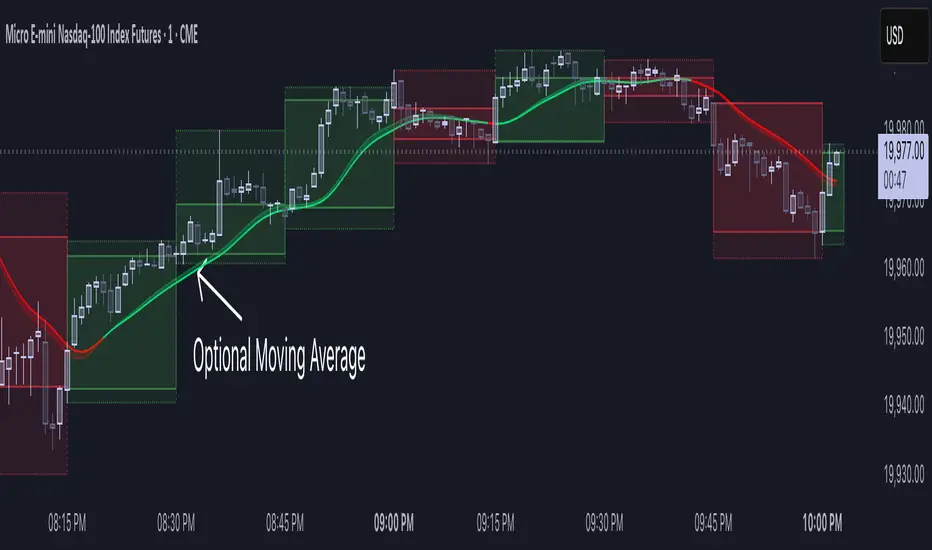
Realtime HTF Candle [NLR]This lightweight indicator displays higher timeframe candles on your current chart - in real-time as they form, not just after they close.
Unlike most HTF candle indicators that only show completed candles (and often feel bloated with too many features), this script updates the current HTF candle live, including its open, high, low, and close as it develops.
🔹 Features:
Draws full-body HTF candles (high-to-low and open-to-close ranges).
Supports any custom HTF (e.g., 15m candles on a 1m chart).
Color-coded boxes to differentiate between bullish and bearish candles.
Live updating HTF candle box as price evolves — no delay.
Optional moving average overlays with smoothing to help track short- and long-term trends.
Perfect for intraday traders who want to stay aligned with higher timeframe structure without clogging up their charts.
TradeDots - Buy Sell Signals ProThe TradeDots - Buy Sell Signals Pro is an advanced technical analysis tool engineered to identify key market turning points and trend continuations. By combining multiple confirmation methods, this indicator provides traders with a comprehensive system for recognizing high-probability entry and exit points across various market conditions.
📝 HOW IT WORKS
Enhanced Supertrend Implementation
Unlike the traditional Supertrend indicator that simply changes color when price crosses above or below a calculated line, our implementation incorporates multiple layers of confirmation:
Advanced Calculation: Uses an enhanced ATR-based algorithm that incorporates trend bias detection and momentum filtering
Multi-Factor Confirmation: Considers price interaction with previous Supertrend values, not just current crossovers
Contextual Awareness: Distinguishes between different entry types based on market risk levels and momentum conditions
Visual Enhancement: Provides background shading to clearly indicate trend direction and strength
Smart Trendline Algorithm
The indicator employs a proprietary Smart Trendline that adapts to market conditions using an advanced moving average system. Unlike traditional moving averages that simply track price, the Smart Trendline incorporates volatility data to change colors based on momentum strength, providing immediate visual feedback about the current market phase with zero lag.
Calculation: Processes price data through selectable advanced calculation methods (including Hull, Jurik, and McGinley averages) with dynamic color-coding based on a modified Keltner Channel system.
Visualization: Green indicates strong bullish momentum, purple represents bearish momentum, and gray signals consolidation or uncertain conditions.
Multi-Signal Confirmation System
The indicator integrates three distinct signal mechanisms to confirm trading opportunities:
1. RSI-Sequential Reversal Signals: Combines RSI levels with seq count patterns to identify potential short-term reversals.
Calculation: Analyzes RSI conditions against specific thresholds while tracking consecutive pattern formations.
Visualization: Green triangles for buy signals and red triangles for sell signals.
2. Statistical Reversal Signals: Identifies statistically significant deviations from normal price behavior.
Calculation: Uses a modified standard deviation approach to determine when price has moved too far from its statistical average.
Visualization: Large green arrows emoji for powerful buy signals and red arrows emoji for powerful sell signals.
3. Supply & Demand Zone Detection: Automatically identifies key price levels where significant buying or selling pressure may exist.
Calculation: Uses RSI extremes combined with confirmation periods to establish high-probability reversal zones.
Visualization: Green-filled areas mark support (demand) zones and red-filled areas mark resistance (supply) zones.
Buy/Sell Signal Generation
The system generates several types of signals with varying strengths:
1. Regular Buy/Sell Signals: Generated when:
Price crosses with MA above/below the Supertrend line
RSI conditions confirm the direction
Candlestick patterns support the signal direction (bullish/bearish candle formation)
Visualized as green/red triangles
2. Strong Buy/Sell Signals: Appear when multiple confirmation factors align:
Regular buy/sell condition is met
Price is interacting with a Supply/Demand zone
Additional momentum confirmation from auxiliary indicators
Seq count reaches significant levels
Statistical Reversal signal confirms the direction
3. Breakout Signals: Special case signals that appear during:
Trend transitions after consolidation
When price breaks through significant resistance/support levels from previous trend
Following pattern completions that suggest increased momentum
Market Structure Analysis
The indicator categorizes market conditions and provides visual cues for traders:
Trend Identification: Supertrend-based algorithm with enhanced visual presentation identifies the prevailing market direction.
Bar Coloring System: Candles change color based on price position relative to EMAs to clearly display strength and direction of momentum
🛠️ HOW TO USE
Signal Interpretation
Buy Signals: "Buy" signals, Green triangles (RSI-Sequential) and large green arrows (Statistical Reversals) appear at potential buy points.
Sell Signals: "Sell" signals, Red triangles (RSI-Sequential) and large red arrows (Statistical Reversals) appear at potential sell points.
Highest Probability Entries: Occur when signals appear near or within Supply & Demand zones.
Trading Strategies
Trend-Following Strategy
1. Identify the main trend using the Smart Trendline color
2. Enter long positions during uptrends when:
Price pulls back to the Smart Trendline
Green triangles or arrows appear
Signals occur near green demand zones
3. Enter short positions during downtrends when:
Price bounces up to the Smart Trendline
Red triangles or arrows appear
Signals occur near red supply zones
Counter-Trend/Reversal Strategy
1. Look for Statistical Reversal arrows at significant price extremes
2. Confirm with an RSI-Sequential signal in the same direction
3. Pay special attention when these signals appear inside Supply & Demand zones
4. Use the Smart Trendline color change as additional confirmation
Multiple Confirmation Technique
For highest probability trades, look for:
Signal alignment (both signal types in same direction)
Supply/Demand zone interaction
Smart Trendline color supporting the signal direction
❗️LIMITATIONS
Signal Lag: The system identifies reversals after they have begun, potentially missing the absolute bottom or top.
False Signals: Can occur during periods of high volatility or range-bound markets.
Timeframe Sensitivity: Some signals work better on higher timeframes for long-term trading, while others are more effective on lower timeframes for short-term trading.
Bar Closing Requirement: All signals are based on closed candles and may be subject to change until the candle closes.
RISK DISCLAIMER
Trading involves substantial risk, and most traders may incur losses. All content, tools, scripts, articles, and education provided by TradeDots are for informational and educational purposes only. Past performance is not indicative of future results.
This indicator should be used as part of a complete trading approach that includes proper risk management, consideration of the broader market context, and confirmation from price action patterns. No trading system can guarantee profits, and users should always exercise caution and use appropriate position sizing.

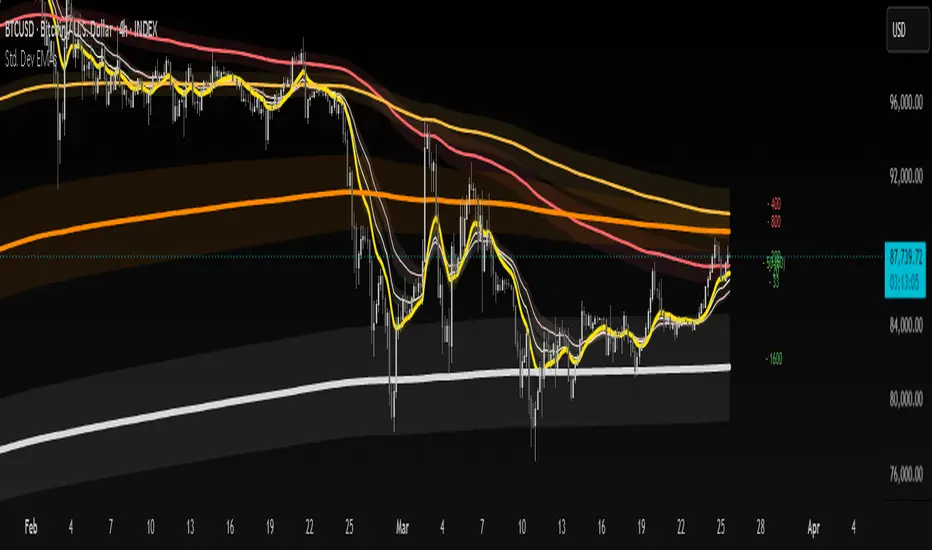
Advanced Standard Deviation EMAs📊 Advanced Standard Deviation EMAs Indicator
This indicator plots up to 7 customizable EMAs with standard deviation channels which helps traders see the potential levels surrounding the EMAs that accounts for recent volatility.
📈 What is Standard Deviation?
Standard deviation is a statistical measure that quantifies the amount of variation or dispersion in a set of values. In trading, it measures how much price movement deviates from the average (mean) price over a specific period. Higher standard deviation indicates higher volatility, while lower values suggest more consistent price action. When applied to EMAs, standard deviation channels help traders identify when price is behaving normally versus when it's making extraordinary moves, potentially signaling trading opportunities or increased risk.
- - - - - - -
✨ Key Features
- Highly Customizable: Each EMA can be independently configured for maximum flexibility
- Multi-Timeframe Analysis: Each EMA can calculate on its own timeframe while displayed on the same chart
- Adaptive Labels: Smart labels show period, timeframe, and trend direction
- Visual Clarity: Fully customizable colors, transparency, and visual elements
🛠️ Per-EMA Customization
Each of the 7 EMAs offers individual control over:
- 📏 Period Length: Set your preferred EMA calculation period
- ⏱️ Timeframe: Calculate each EMA on its own timeframe (defaults to chart timeframe)
- 📏 Standard Deviation Multiplier: Fine-tune channel width with individual multipliers
- 🎨 Colors: Custom colors for lines, fills, and labels
- 🔍 Visibility: Toggle line, fill, and label visibility independently
- 🌫️ Transparency: Adjust fill transparency for each Standard Deviation Channel
🏷️ Smart Labels
Labels automatically display:
1. EMA length (e.g., "- 200")
2. Calculation timeframe when custom (e.g., "- 200 (240)")
3. Trend direction through color
Label colors indicate trend direction:
- 🟢 Green: EMA is trending upward (customizable)
- 🔴 Red: EMA is trending downward (customizable)
⚙️ Global Settings
- Label Offset: Position labels away from price action (default: 20 bars)
- Label Size: Choose from multiple text sizes
- Quick Toggle: Disable all EMA lines and fills with one click while keeping labels
💡 Use Cases
- Multi-timeframe trend analysis
- Dynamic support/resistance identification
- Price volatility assessment
- Trend strength confirmation
- - - - - -
Comment down below if you have any cool feature ideas or want to show your support and give this indicator a like if you're enjoying it :)
Enjoy!
SS
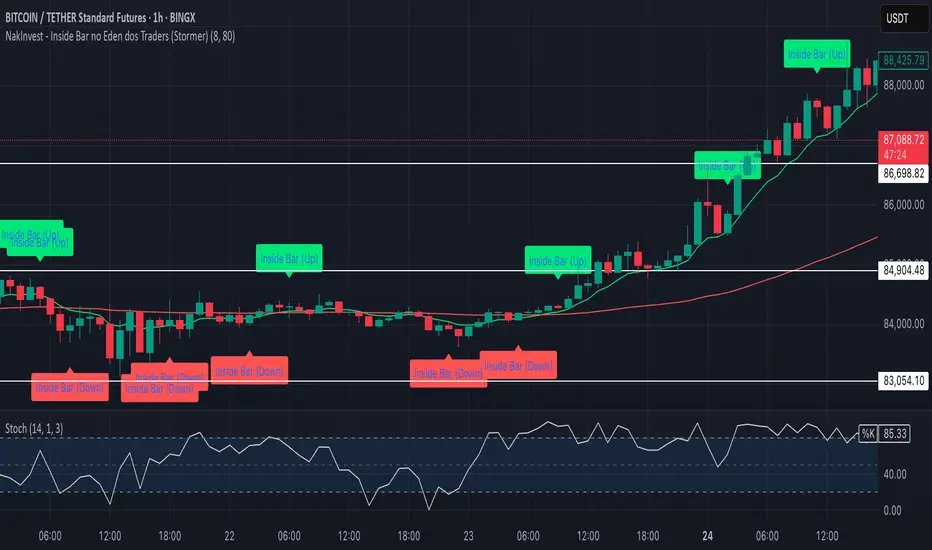
NakInvest - Inside Bar no Eden dos Traders (Stormer)📌 NakInvest - Inside Bar Detector (Éden dos Traders Enhanced Detection)
This indicator is designed to identify Inside Bars that occur during strong trending conditions, following the popular Éden dos Traders strategy by Stormer, famous brazilian trader. It uses the relationship between two EMAs (Short EMA & Long EMA) to determine whether the market is in a bullish or bearish trend, and highlights Inside Bars that meet specific criteria.
⸻
🔍 What This Indicator Does:
1. EMA-Based Trend Detection:
• Identifies Uptrends when the Short EMA is above the Long EMA.
• Identifies Downtrends when the Short EMA is below the Long EMA.
2. Inside Bar Detection:
• An Inside Bar is detected when the entire candle (body & wicks) is contained within the body of the previous candle.
• This pattern suggests consolidation and potential breakouts, especially when found within a strong trend.
3. Debug Mode for Transparency:
• When enabled, provides visual markers to indicate when the conditions for trend detection and Inside Bars are met.
• Helps traders understand why certain candles are detected and others are not.
⸻
📈 How to Use:
• Apply this indicator to any market and timeframe, but it’s most effective on higher timeframes (H1, H4, Daily).
• Ideal for traders looking for trend-continuation setups or reversal signals after periods of consolidation.
• Combine this indicator with other tools (e.g., Volume Analysis, Price Action Patterns) for greater accuracy.
⸻
⚙️ Indicator Settings:
1. Short EMA Length: The period for the fast-moving average (default: 8).
2. Long EMA Length: The period for the slow-moving average (default: 80).
3. Enable Debug Mode: Toggle visibility of debug markers to better understand condition logic.
⸻
📢 Alerts:
This script includes labels for:
• IB (Up): Inside Bar detected during an uptrend.
• IB (Down): Inside Bar detected during a downtrend.
⸻
📌 Disclaimer:
This indicator is intended for educational purposes only and is not financial advice. Always perform your own research and consult with a financial professional before making any trading decisions.
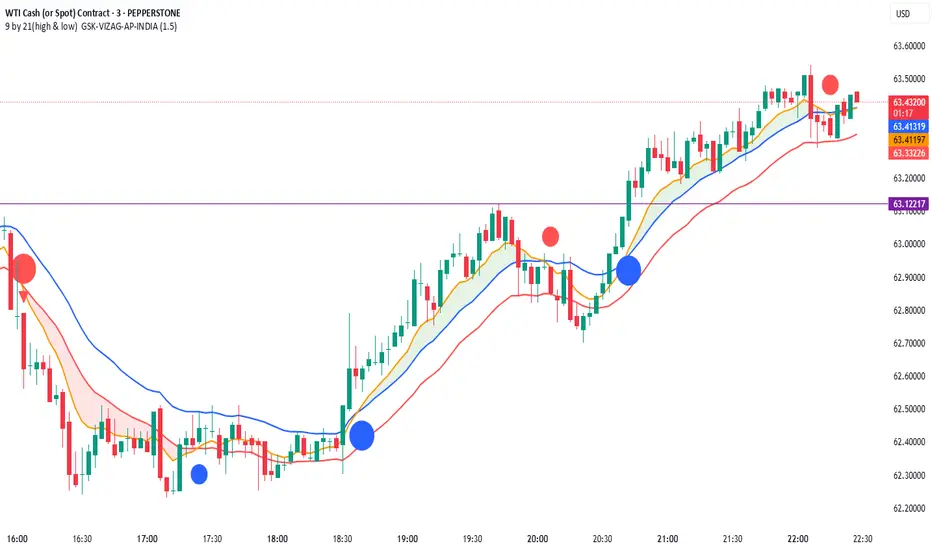
9 by 21(high & low) GSK-VIZAG-AP-INDIA21 EMA High & Low + 9 EMA Crossover with Volume & Wick Confirmation
🔹 What Does This Indicator Do?
This indicator is designed for momentum-based trend trading by combining exponential moving averages (EMAs), price action filters, and volume analysis. It provides traders with high-probability buy and sell signals while filtering out weak trends and false breakouts.
🔹 How Is It Different from Other Indicators?
Unlike traditional EMA crossover strategies that rely only on moving averages, this indicator enhances reliability by incorporating custom volume conditions, price action validation, and wick-based filtering.
Key Features That Make It Unique:
Dynamic EMA Bands for Trend Identification
Uses 21 EMA High & 21 EMA Low as dynamic support & resistance levels, creating a flexible trading range.
Helps traders identify trend strength and potential reversals without relying on static levels.
Enhanced EMA Crossover System
Includes a 9 EMA crossover signal to detect momentum shifts before traditional EMAs react.
Avoids lagging signals often seen in standard moving average crossovers.
Smart Volume-Based Confirmation
Uses a custom volume multiplier to detect significant market participation.
Filters out low-volume breakouts that may lead to false signals.
Wick-Based Filtering for Precision
Identifies candles with no lower wick (for buy signals) and no upper wick (for sell signals) to confirm strong price movements.
Helps traders avoid weak reversals and focus only on strong momentum shifts.
🔹 How to Use This Indicator in Trading?
Buy Conditions:
Bullish candle (green) with no lower wick, confirming strong buying pressure.
Price is above the 21 EMA High and remains above 21 EMA Low.
Volume shows an increase, confirming market participation.
Sell Conditions:
Bearish candle (red) with no upper wick, signaling strong selling pressure.
Price is below the 21 EMA Low and remains under the 21 EMA High.
Volume confirms strong momentum in the downward direction.
Bonus: The indicator also highlights 9 EMA & 21 EMA crossovers to provideearly trend confirmations.
Who Should Use This Indicator?
✅ Intraday Traders – Looking for quick entry and exit signals based on price momentum.
✅ Swing Traders – Who want to identify medium-term trend shifts with volume confirmation.
✅ Trend Followers – Seeking a robust moving average system to avoid false breakouts.
✅ Momentum Traders – Who need price-action-based confirmation before taking a trade.
Why This Indicator Stands Out?
Unlike standard EMA-based indicators that often generate false breakouts, this tool:
✔️ Filters low-quality signals using smart volume analysis.
✔️ Enhances trend confirmation with wick-based filtering.
✔️ Detects momentum early using a unique EMA crossover combination.
This makes it more reliable than traditional moving average-based systems and highly adaptable for different market conditions.
Note: The logic behind this indicator is proprietary and non-repainting, making it a powerful tool for traders who rely on EMA-based trend strategies.
Try it out and see how it improves your trading decisions!
Why This Description Works?
✔ No code exposure – The logic is explained in concept but not in detail.
✔ Clear differentiation – Shows why this is better than other indicators.
✔ Compliant with TradingView rules – No vague claims, but precise explanations.
Would you like to add any specific trading examples or screenshots to further enhance it? Let me know!
Share Your Experience!
Your feedback is valuable! If you find this indicator useful, leave a comment with your experience—how it worked for you, any improvements you suggest, or the best settings you discovered.
Let’s build a community of traders refining strategies together!
Disclaimer:
This indicator is for educational and informational purposes only. It does not guarantee profitable trades and should be used with proper risk management. Always conduct your own research before making trading decisions.
Ripster Trend Labels LT INTRODUCTION
Ripster Trend Labels are Extension of Ripster Clouds on Daily & Hourly & Weekly Timeframe for Long Term Analysis for Swing Traders and Investors
Key Components of the Code:
Initialization:
The script starts with the study function, which sets up the overlay on the chart and titles it "Ripster Trend Labels LT".
Users can customize the position of the trend table on the chart via an input option that allows selection among various placements like top_right, top_center, etc.
EMA Calculations:
Daily EMAs: The script calculates two daily EMAs (21-day and 55-day) using the security function to fetch the daily closing prices, ensuring no lookahead bias.
Weekly EMAs: Similarly, it calculates two weekly EMAs (12-week and 50-week) using weekly closing prices.
1-Hour EMA: A 50-period EMA is calculated based on 1-hour closing prices
Trend Label Determination:
For each timeframe (1-hour, daily, and weekly), the script compares the closing prices with their respective EMAs to determine if the trend is bullish or bearish.
Labels like "Bullish" or "Bearish" are dynamically generated based on these comparisons and are updated in real-time as new data becomes available.
Table Creation and Display:
A table is dynamically generated at the user-specified position on the chart.
The table has rows corresponding to each analyzed timeframe, displaying trend labels which are color-coded (green for bullish, red for bearish) to provide visual cues about the market condition.
Explanation of the Clouds & How to Use:
The strategy employs a multi-timeframe analysis using EMA-based "clouds" to evaluate stock trends from short-term fluctuations to long-term movements. This method allows traders to systematically identify potential bullish reversals or signs of a bearish trend weakening, and to make informed decisions based on the overall alignment of these clouds.
Sequence of Cloud Shifts for Trend Analysis:
Ripster 1-Hour Cloud (34/50 1HR): The first indicator to respond, a bullish shift here signals the initial potential for upward momentum. It serves as an early alert for traders to monitor subsequent clouds for confirmation of trend reversal.
MTF1 20/21 Daily Cloud: A bullish turn following the Ripster 1-Hour Cloud strengthens the reversal signal on a daily timeframe. This cloud's shift adds reliability to the initial bullish signal by confirming sustained daily trend strength.
MTF2 50/55 Daily Cloud: Further confirmation comes from this cloud turning bullish, which underscores a robust daily bullish trend. It solidifies the market's bullish sentiment, indicating a sustainable upward trend.
Weekly 5/12 Cloud: This intermediate-term indicator turning bullish consolidates the bullish signals from shorter timeframes, indicating broader market acceptance and strength of the bullish trend.
Weekly 34/50 Cloud: The bullish shift in this cloud confirms a long-term bullish trend. This is a critical confirmation for long-term traders, indicating that the stock might be entering a strong and sustained upward trajectory.
Overall Cloud Alignment and Strategic Implication ns:
All Clouds Are Bullish: When every cloud from the 1-Hour to the Weekly 34/50 is bullish, it signals a strong, unified bullish market sentiment.
Strategy for Bullish Alignment: Traders should view this as an optimal condition for buying dips. The unanimous bullish signal across all timeframes suggests that any pullbacks are temporary, offering buying opportunities.
Using Other Analysis: Enhance this strategy by confirming dips with other bullish indicators like rebounding from key support resistance levels or any other technical analysis
All Clouds Are Bearish: A bearish alignment across all clouds indicates a pervasive downtrend.
Strategy for Bearish Alignment: Traders are advised to avoid long positions and consider risk management strategies, such as tightening stop-losses or taking short positions.
Complementary Analysis: Confirm bearish trends with additional indicators like breakdowns below key support levels etc
Conclusion:
This cloud-based trend analysis provides a structured way to track market dynamics across multiple timeframes, offering clear signals for entry and exit strategies. By observing the sequential shifts in these clouds, traders can align their trading strategies with both short-term and long-term market trends, enhancing their decision-making process. The integration of other technical tools with this cloud-based analysis not only validates the trend signals but also helps in managing trades more effectively, capitalizing on the comprehensive view of market conditions provided by the clouds.

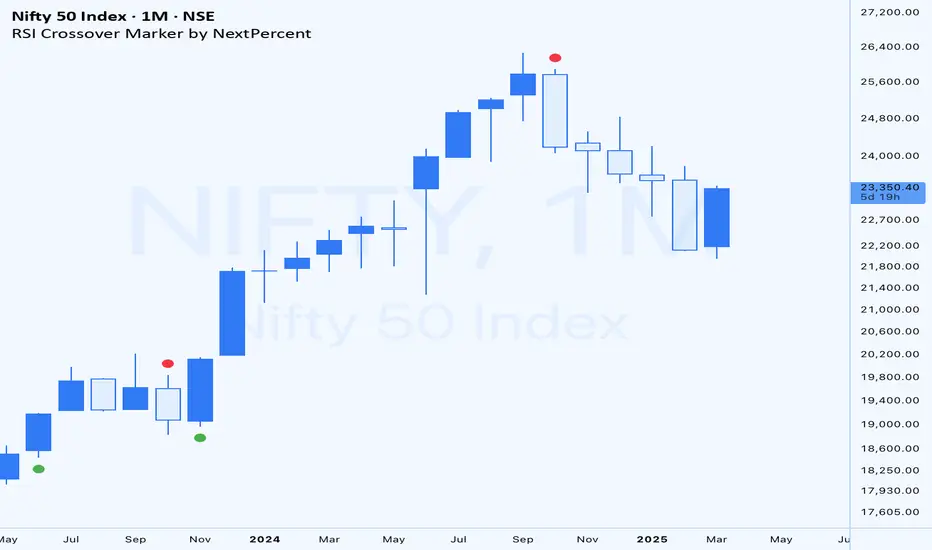
RSI Crossover Marker by NextPercentRSI Crossover Marker by NextPercent
This indicator combines RSI crossovers with moving averages and optional divergence detection to generate trading signals.
Key Features:
• RSI crossover signals with customizable moving average (EMA, SMA, WMA, RMA)
• Optional divergence detection
• Flexible timeframe settings
• Wait for candle close option
• Visual signals using triangles above/below price bars
Signal Generation:
• Bullish Signal: RSI crosses above the moving average
• Bearish Signal: RSI crosses below the moving average
• When divergence is enabled, signals only appear with confirmed divergence patterns
Customizable Parameters:
• RSI Length and Source
• Moving Average Type and Length
• Bollinger Band Standard Deviation
• Timeframe Selection
• Divergence Detection Toggle
Visual Signals:
• Green triangles appear below bars for bullish signals
• Red triangles appear above bars for bearish signals
Note:
This indicator is designed to help identify potential trend reversals and trading opportunities based on RSI momentum and optional divergence confirmation.
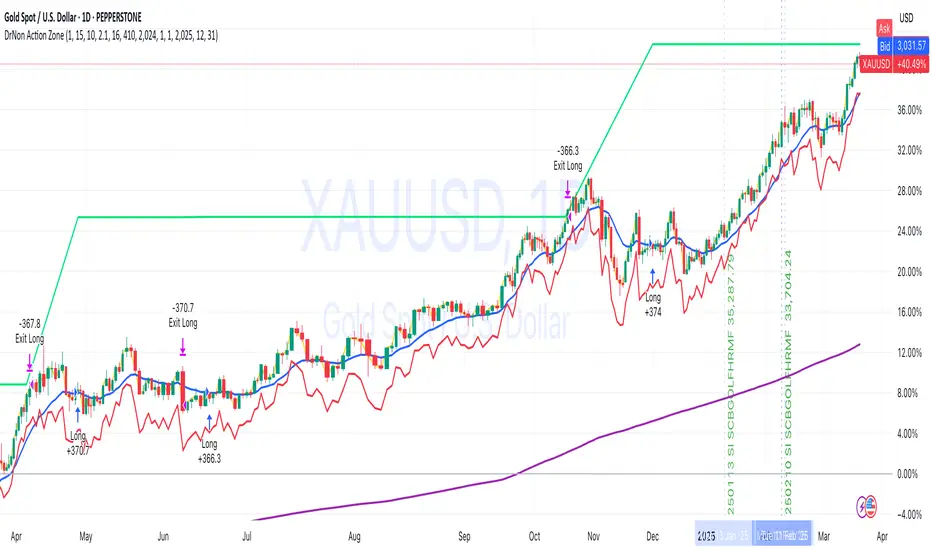
DrNon Action Zone📈 Strategy Title:
DrNon Action Zone — EMA Cross with ATR Stop, % Take-Profit, Alerts & Date Range
⸻
🧠 Strategy Concept:
DrNon Action Zone is a long-only trend-following strategy that enters trades when momentum aligns with long-term trend confirmation. It uses:
• EMA Cross (Fast vs. Slow) to identify momentum shift
• Optional EMA Filter based on days to confirm that price is in a “trend zone”
• ATR-based trailing stop for adaptive risk management
• Percentage Take-Profit for reward targeting
• Date Range Filter for focused backtesting or event-based execution
It also includes alerts, visual signals, and full customization via inputs.
⸻
⚙️ Strategy Inputs Explained:
Input Name Description
Fast EMA Length Period of the short-term EMA used for crossover signals (default: 5)
Slow EMA Length Period of the long-term EMA used for crossover signals (default: 200)
ATR Period Period used to calculate the Average True Range (ATR)
ATR Multiplier Multiplies ATR value to calculate the trailing stop distance
Take-Profit % Percentage above entry price to exit the trade for profit
Use EMA Filter? If enabled, long entries require price to be above a customizable EMA filter
EMA Filter Days Number of days used for EMA filter (converted to bars based on chart timeframe)
Use Date Range? Enable or disable the date filter
Start Date / End Date Specify a custom range to apply the strategy
⸻
✅ Long Entry Conditions (The Action Zone):
A long trade is entered when:
1. EMA(Fast) crosses above EMA(Slow)
2. If EMA Filter is enabled, Close > EMA(Filter Days)
3. If Date Filter is enabled, current candle is within specified start and end dates
⸻
❌ Exit Conditions:
The strategy will close the position when either:
• Price drops to ATR-based trailing stop, OR
• Price reaches the Take-Profit % target
⸻
🛎️ Alerts:
Alert Name Trigger Condition
Long Entry Alert EMA cross and all filters passed (entry signal triggered)
Exit Alert Price hit ATR Stop or Take-Profit (exit signal triggered)
⸻
📊 Visual Elements:
• Yellow Line — Fast EMA
• Blue Line — Slow EMA
• Purple Line — EMA Filter (based on user-defined days)
• Red Line — ATR-based Trailing Stop
• Lime Line — Take-Profit Level
• Green Triangle — Long Entry Signal (on crossover)
⸻
🧪 Backtesting Tips:
• Adjust EMA Filter Days to simulate different trend conditions (e.g., 100d, 150d, 200d).
• Use ATR Multiplier to adapt the stop-loss to market volatility.
• Combine date filtering with known events (e.g., earnings, FOMC meetings).
• Test in multiple timeframes — 1H, 4H, or Daily for stronger signals.
EMA Clouds with Strict Buy/Sell SignalsEMA Clouds with Strict Buy/Sell Signals - Precision Trading Unleashed
Unlock the power of trend-following precision with the EMA Clouds with Strict Buy/Sell Signals indicator, a sophisticated tool built for traders who demand reliability and clarity in their decision-making. Inspired by the legendary Ripster EMA Clouds, this indicator takes the classic cloud concept to the next level by incorporating stricter, high-confidence signals—perfect for navigating the markets on 15-minute or higher timeframes.
Why You’ll Want This on Your Chart:
Dual EMA Clouds for Crystal-Clear Trends: Watch as two dynamic clouds—formed by carefully paired Exponential Moving Averages (8/21 and 34/50)—paint a vivid picture of market momentum. The green short-term cloud and red long-term cloud provide an intuitive, at-a-glance view of trend direction and strength.
Stricter Signals, Fewer False Moves: Tired of chasing weak signals? This indicator only triggers buy and sell signals when the stars align: a cloud crossover (short-term crossing above or below long-term) and price confirmation above or below both clouds. The result? Fewer trades, higher conviction, and a cleaner chart.
Customizable Timeframe Power: Whether you’re a scalper on the 15-minute chart or a swing trader on the daily, tailor the clouds to your preferred higher timeframe (15min, 30min, 1hr, 4hr, or daily) for seamless integration into your strategy.
Visual Mastery Meets Actionable Alerts: Green buy triangles below the bars and red sell triangles above them make spotting opportunities effortless. Pair this with built-in alerts, and you’ll never miss a high-probability trade again.
How It Works:
Buy Signal: Triggers when the short-term cloud crosses above the long-term cloud and the price surges above both, signaling a robust bullish breakout.
Sell Signal: Activates when the short-term cloud dips below the long-term cloud and the price falls beneath both, confirming bearish dominance.
Cloud Visualization: The green cloud (8/21 EMA) tracks fast-moving trends, while the red cloud (34/50 EMA) anchors the broader market direction—together, they filter noise and spotlight tradable moves.
Why Traders Will Love It:
Designed for those who value precision over guesswork, this indicator cuts through market clutter to deliver signals you can trust. Whether you’re trading stocks, forex, crypto, or futures, its adaptability and strict logic make it a must-have tool for serious traders. Customize the EMA lengths, tweak the timeframe, and watch your edge sharpen.
Add EMA Clouds with Strict Buy/Sell Signals to your chart today and experience the confidence of trading with a tool that’s as disciplined as you are. Your next big move is waiting—don’t let it slip away.

Crypto Strategy SUSDT 10 minThis strategy is designed to trade the **SUSDT** pair on a **10-minute time frame**, using a combination of an Exponential Moving Average (EMA) and percentage-based Stop Loss (SL) and Take Profit (TP) levels.
### How the strategy works:
1. **EMA Calculation**:
- The strategy calculates a 24-period Exponential Moving Average (EMA) based on the closing price.
- This EMA serves as the primary trend indicator.
2. **Entry Conditions**:
- **Long Position**: A long position is entered when the closing price is above the EMA and the opening price is below the EMA. This indicates a potential upward trend.
- **Short Position**: A short position is entered when the closing price is below the EMA and the opening price is above the EMA. This indicates a potential downward trend.
3. **Stop Loss and Take Profit**:
- Both Stop Loss (SL) and Take Profit (TP) are calculated based on the entry price of the position.
- **For Long Positions**:
- Stop Loss is set as a percentage below the entry price.
- Take Profit is set as a percentage above the entry price.
- **For Short Positions**:
- Stop Loss is set as a percentage above the entry price.
- Take Profit is set as a percentage below the entry price.
- The percentage values for SL and TP can be adjusted in the strategy's settings (default: SL = 2%, TP = 4%).
4. **Exit Conditions**:
- The position is closed automatically when either the Stop Loss or Take Profit level is reached.
5. **Visualization**:
- The 24-period EMA is plotted on the chart as a blue line, helping visualize the trend direction.
### Key Features:
- **Pair and Time Frame**: The strategy is optimized for the SUSDT pair on a 10-minute time frame.
- **Customizable Parameters**: Users can adjust the Stop Loss and Take Profit percentages to suit their risk tolerance and trading style.
- **Trend-Following Approach**: The strategy uses the EMA to identify and follow the current market trend.
This strategy is simple yet effective for capturing trends while managing risk through predefined Stop Loss and Take Profit levels.

Air Gap MTF with alert settingsWhat it shows:
This indicator will show a horizontal line at a price where each EMAs are on on different time frames, which will remove the effort of having to flick through different time frames or look at different chart.
The lines itself will move in real time as price moves and therefore as the EMA values changes so no need to manually adjustment the lines.
How to use it:
The price gap between each of the lines are known as "air gaps", which are essentially zones price can move with less resistance. Therefore bigger the airgap there is more likely more movement in price.
In other words, where lines are can be a resistance (or support) and can expect price stagnation or rejection.
On the chart it is clear to see lines are acting as resistances/supports.
Key settings:
The time frame are fixed to: 30min, 1hr and 4hr. This cannot be changed as of now.
EMA values for each time frame are user changeable in the settings, and up to 4 different values can be chosen for each time frame. Default is 5,12,34 and 50 for each timeframe.
Line colour, thickness and style can be user adjusted. Start point for where line will be drawn can be changed in the settings, either: start of day, user defined start or across the chart. In case of user defined scenario user can input a number that specifies a offset from current candle.
Label colour, font, alignment, text size and text itself can be user adjusted in the settings. Price can be also displayed if user chooses to do so. Position of label (offset from current candle) is user specified and can be adjusted by the user.
Both the lines and labels can be turned off (both and individually), for each lines.
Alert Settings:
Manually, user can set alerts for when price crosses a specific line.
This can be done by:
right click on any of line
choose first option (add alert on...)
On the second option under condition, use the dropdown menu to choose the desired EMA/timeframe to set alert for.
Hit "create" at bottom right of option
----------------------------------------------------------------------
If anything is not clear please let me know!
