PercentagefromEMAEMA (Exponential moving average) often acts as dynamic support and resistance and trend detector and the further price is away from ema the more it has chance to reverse, hence percentage levels gives a range to exit your trades.
*choose your favourite timeframe and EMA length , alter percentages as you wish to generate Take profit levels
thank you..
Happy Trading.
Media mobile esponenziale (EMA)

Bogdan Ciocoiu - CoordinatorDescription
The Coordinator is an indicator developed on the back of the RSI algorithm, modified substantially to form a cloud. In addition, the Coordinator uses EMA/SMA to compare the location of the RSI cloud with the chosen moving averages (EMA vs SMA).
This indicator is helpful as it confirms when a trader should enter a position or exit based on the proximity of the RSI cloud to the relevant MA.
Uniqueness
The Coordinator provides unique benefits, including:
It shows the strength of the RSI in the shape of the RSI cloud, using two sets of dimensions (one more long term and one more short-term oriented).
It indicates the positioning of the RSI cloud in conjunction with the relevant moving averages to help traders remain in positions for longer.
It shows the RSI 14 (useful when spotting divergences aligned with the price action).
Open-source
The Coordinator uses the following open-source scripts:
www.tradingview.com

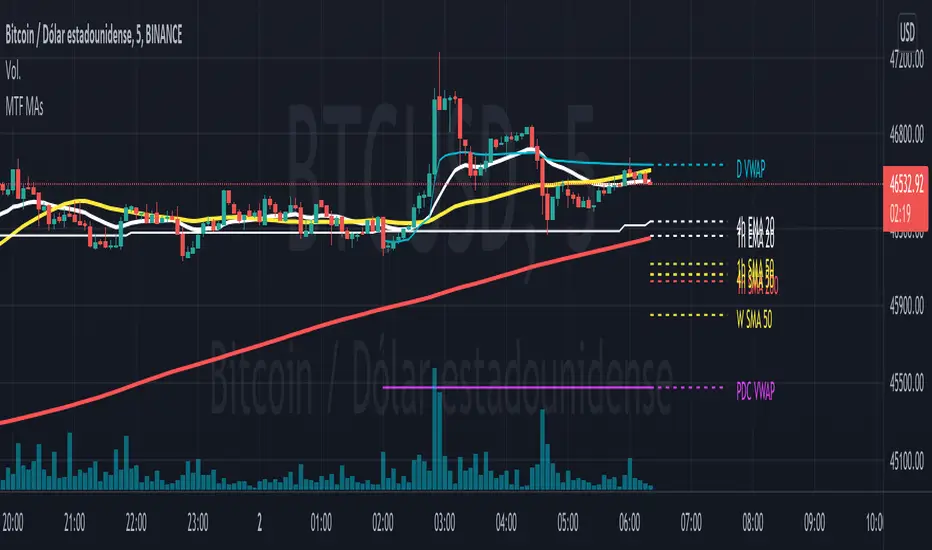
Multi Timeframe Moving AveragesI made this script to keep an eye on most important timeframes (1h, 4h, D, W, M)) moving averages while watching another timeframe. You can select what Ma's you want to be shown for each timeframe and some options to help your analysis (show history, show prices on mouse over label, etc...)
It includes 3 MA's:
- Fast (EMA)
- Middle (SMA)
- Slow (SMA)
You can configure length, source and color for each one.
Also includes a daily VWAP and an option to show the previous day close.
This script includes code from user Frien_dd-DisDev. I am very grateful to him
Thank you for interest.
Pablo.
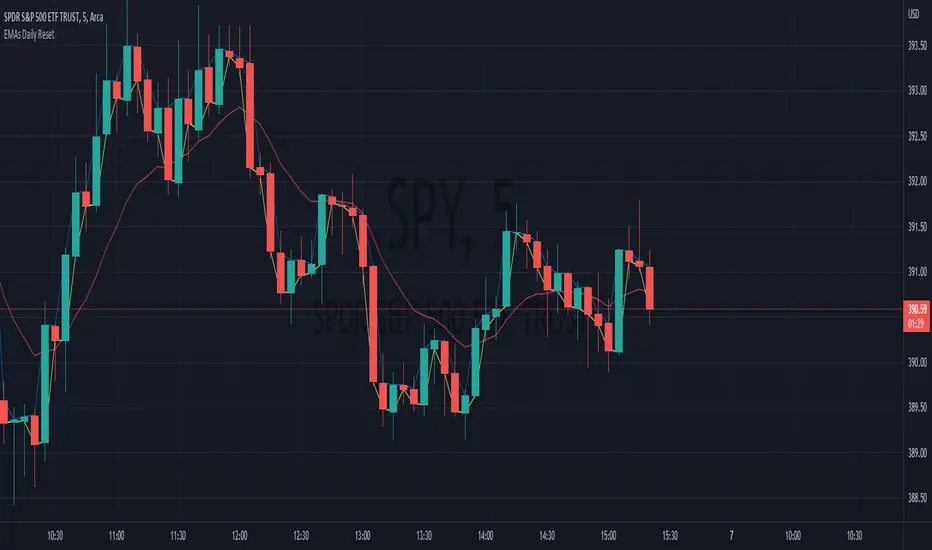
EMAs Daily ResetThis indicator displays 3 EMAs that recalculate every day.
This is useful for intraday trading by removing the bias of the previous day's ema price. This ensures your EMAs stay near the most current price action.
Note: If your length is larger than the number of bars in the day, your EMAs will not have time to properly catch up in the day.
ALMA cross signal by hk4jerry<< ALMA CROSS signal >>
*NONE REPAINT STRATEGY*
--As a result of testing for a month, using alma does not result in repainting--
--ALMA 크로스 결과는 한달간의 테스트 결과, 리페인팅되지 않습니다--
(ENGLISH description O)
==NOTE==
1. MA 크로스 지표는 잘못된 신호들이 자주 등장합니다. 정확성을 더 높일수 있는 방법은 없을까 고민을 해봤습니다. 더 낮은 가격에 매수하고, 더 높은 가격에서 매도하는 것이 중요했습니다. 우리가 흔히 저점, 고점을 알아내기 위한 지표이자, 선행지표인 RSI를 추가하는 방법을 연구했습니다.
2. 예를 들어, MA 크로스 매수 신호가 발생했을때, rsi값이 50이면 가격이 더 떨어질 가능성이 큽니다. 하지만, rsi값이 30이하인 경우에만 매수 신호가 발생한다면, 그 가격이 저점일 확률이 매우 높아지는 원리 입니다.
3. 신호는 확률입니다. 트레이딩에 100%는 없습니다. 그 확률을 높이는 것은 리스크 관리 입니다. 분할 매수 관점으로 포지션을 잡으시거나, 단기 매매로 가져가시는걸 추천드립니다.
==rsi ma source 설정==
1. 'rsi ma' 값의 소스입니다.
2. 'rsi 길이' 는 값이 클수록 더욱 정확한 시그널이 발생합니다.
3. EMA 길이가 짧을수록 더 많은 시그널이 발생합니다. 그러나, 정확도는 떨어집니다.
==rsi ma 설정==
1. rsi를 source로한 EMA입니다.
2. rsi와 유사한 성격을 가집니다.
3. 'rsi ma' 값이 30이하이면 과매도, 70이상이면 과매수 입니다.
4. ' rsi ma long value' 이 30이면 매수 신호가 rsi ma 값이 30 이하인 경우에만 발생함을 의미 합니다.
5. "rsi ma short value' 가 70이면 매도 신호가 rsi ma 값이 70 이상인 경우에만 발생함을 의미 합니다.
==rsi 설정==
1. 실제 rsi(14,close) 값을 의미합니다.
2. rsi ma value와 비슷한 기능입니다.
3. rsi 길이가 14이므로, 값은 40~50 사이가 적당합니다.
4. 30 또는 70으로 설정할 시, 신호가 거의 발생하지 않습니다.
(ENG)
==NOTE==
1. MA cross indicator often shows false signals. I was wondering if there is a way to increase the accuracy further. It was important to buy at a lower price and sell at a higher price. We studied how to add RSI, which is a leading indicator and an indicator to find lows and highs, often.
2. For example, when a buy MA cross signal occurs, if the rsi value is 50, the price is more likely to fall. However, if a buy signal occurs only when the rsi value is below 30, the probability that the price is at the bottom is very high.
3. A signal is a probability. There is no 100% in trading. Increasing that probability is risk management. It is recommended to hold a position from the perspective of a split buy or take it as a short-term trade.
==rsi ma source option==
1. The source of the 'rsi ma' value.
2. The larger the 'rsi length' value, the more accurate the signal is generated.
3. Shorter EMA lengths produce more signals. However, the accuracy is reduced.
==rsi ma options==
1. EMA with rsi as the source.
2. It has similar characteristics to rsi.
3. If the 'rsi ma' value is below 30, it is oversold, and if it is above 70, it is overbought.
4. If 'rsi ma long value' is 30, it means that a buy signal will only occur when the rsi ma value is less than or equal to 30.
5. If "rsi ma short value' is 70, it means that a sell signal will only occur when the rsi ma value is above 70.
==rsi option==
1. It means the actual rsi(14,close) value.
2. This function is similar to rsi ma value.
3. Since the rsi length is 14, a value between 40 and 50 is appropriate.
4. When set to 30 or 70, almost no signal is generated.

FTL - Range Filter X2 + EMA + UOThjs script combines two range filters, an EMA and the Ultimate oscillator.
This is an indicator type of script with alerts that is ideal for one minute scalping and was developed initially for NAS100 but has been used successfully with other symbols.
The two range filters are used to detect when the short and mid term trends are in the same direction.
The EMA indicates the longer term trend and the UO is used to determine if an asset is overbought or oversold.
This indicator pairs well with divergence indicators to add confluence to a change in direction.
Additional features of this indicator:
- Configure whether to show buy and sell labels only when asset is not overbought or oversold
- Select whether to show buys only when price is above the EMA , or sells only below the EMA
- Indicate a bar where a trend crosses the EMA and select if the crossover or cross under should be shown only in a counter trend.
- Pullbacks within a trend can be identified. This may indicate trend continuation.
- Alerts can be created for pullbacks, EMA crossing and for buy or sell signals

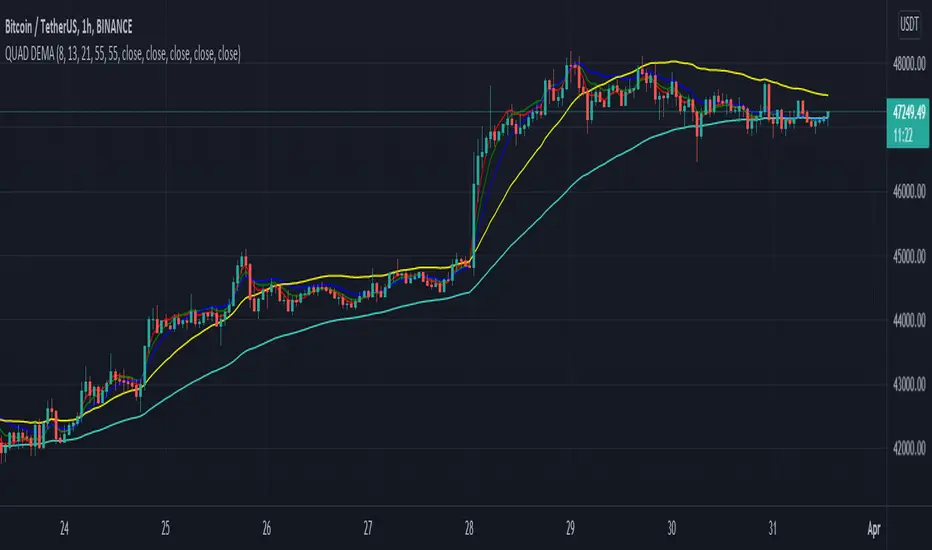
QUAD DEMAHey Folks,
Just created my first script, It's basically 4 DEMA in one indicator which helps you not to use multiple indicators.
It's more accurate than Exponential Moving Average & give signals much prior to the breakout, very helpful in short timeframes.
Tweak it according to your preference
Instructions to use
-When 55 DEMA crosses all the DEMA it's a clear signal for uptrend or downtrend which can potentially be a entry or exit points.
-Don't depend on this when all the DEMA's are entangled to each other.
-Use Stochastic RSI for better approach in entry.
-Most accurate in 1hr time frame for short term entry.
Enjoy!
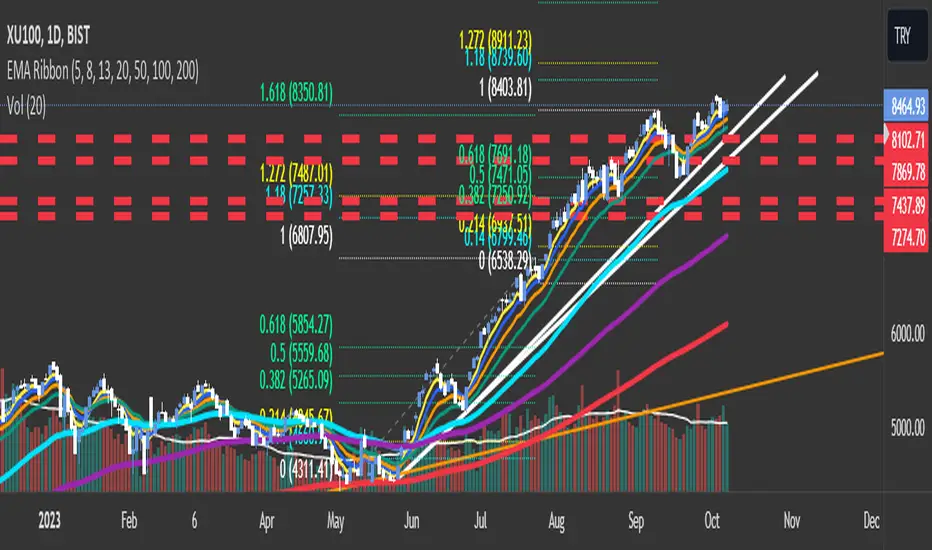
EMA RibbonI added 7 EMA in a ribbon form ( basically, I took from the open script base and just combined them)
By default:
To see Short trends ( Alligator)
EMA(5)
EMA(8)
EMA(13)
To See Longer Trends
EMA(20)
EMA(50)
EMA(100)
EMA(200)
Cheers
[VDB]TrendScalp-FractalBox-3EMAThere are many indicators with William’s Fractal and Alligator. As many use EMA’s it may be useful to define a 3-EMA ribbon and combining Fractal Levels/Box (filling background between top and bottom fractals) for trend scalping. I searched for this kind of indicator in community – some show fractals, some just levels, some with alligator etc. but couldn't find the one needed. Hence thought of this indicator which may be of interest to other users too.
Key Points:
EMA ribbon is created using 3 EMA’s 35/70/105. Users can change these as per their preference. This is used for trend identification – 1. Bullish bias if Price > EMA1 > EMA2 > EMA3. 2. Bearish bias if Price < EMA1 < EMA2 < EMA3.
Background is marked during crossing of EMA1 and EMA2 to alert possible trend change.
5-bar fractals are used to mark the Fractal levels and background between top and bottom fractals are filled to create a Fractal Box.
Fractal levels are marked only when the fractal formation is complete. Given offset is used this is lagging.
How to Use:
Sloping EMA ribbon is used for identifying the trend.
Fractal box break-out/ break-downs are used to trigger the trade with fractal high/low for entry/SL. Waiting for price contraction towards EMA ribbon resulting in smaller boxes is key to initiate trade. Avoid bigger boxes as SL’s will be big and price may move within. To draw the vertical lines of FractalBox change fractal level0 style to step-line.
This indicator combined with the cycle high/low (overbought/oversold) indicators such as CCI/Stochastic/RSI etc. can make it a good trend scalping setup while trading in the direction of momentum in higher timeframe.
This setup could be used for any timeframes. Do your back-testing before using it in live market.
This indicator was achieved by combing some fractal ideas from “Fractal and Alligator Alerts by JustUncleL”
DISCLAIMER : This indicator has been created for educational reference only and do not constitute investment advice. This indicator should not be relied upon as a substitute for extensive independent market research before making your actual trading decisions. Market data or any other content is subject to change at any time without notice. Liability for any loss or damage, including without limitation any loss of profit, which may arise directly or indirectly from use of this indicator is accountability of user using it.


Indicator of MagoIn this indicator you will find a combination of the indicators used by Mago Gobira. Being them EMA , RSI Levels...

USFuturesInvestments Moving Averages - Exponencia and SimpleThis indicator contains the main exponential moving averages (9, 21 and 80) and the simple moving averages (200, 305 and 610), which I use in my operational.
It was developed by my friend Giovani, who is a 10 note guy!
I hope he can help you on your journey to becoming a Professional Trader.
You can modify it the way you prefer, it is very simple.
Neste indicador estão reunidas as principais médias móveis exponenciais (9, 21 e 80) e as médias móveis simples (200, 305 e 610), que uso em meu operacional.
Ele foi desenvolvido por meu amigo Giovani, que é um cara nota 10!
Espero que ele possa ajudar a você na jornada para se tornar um Trader Profissional.
Você pode modifica-la do jeito que preferir, é muito simples.

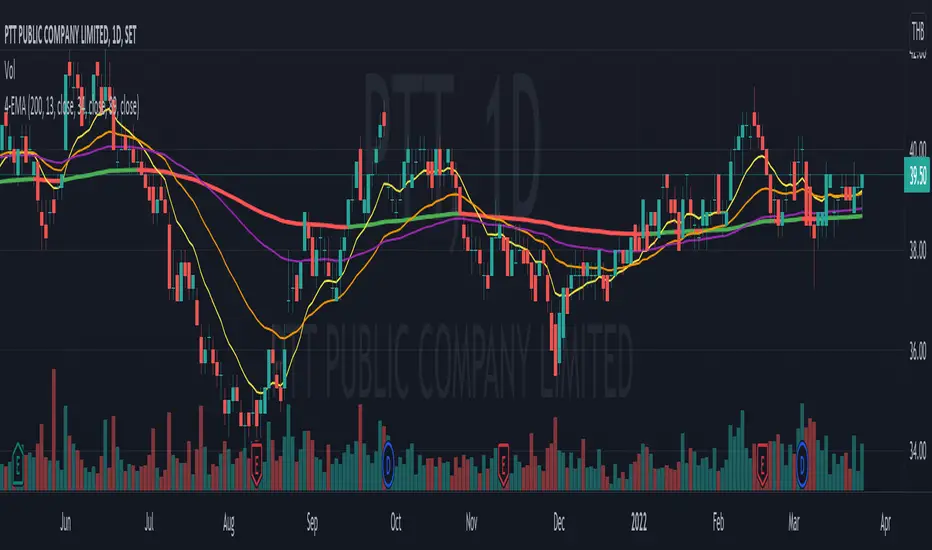
4 Moving Averages4 EMAs indicators, I use these for daily time frame. Please feel free to explore. Comments are invited.
Quad-EMAThis indicator allows you to setup four Exponential Moving Averages onto your chart and control their lengths and colors from the same indicator
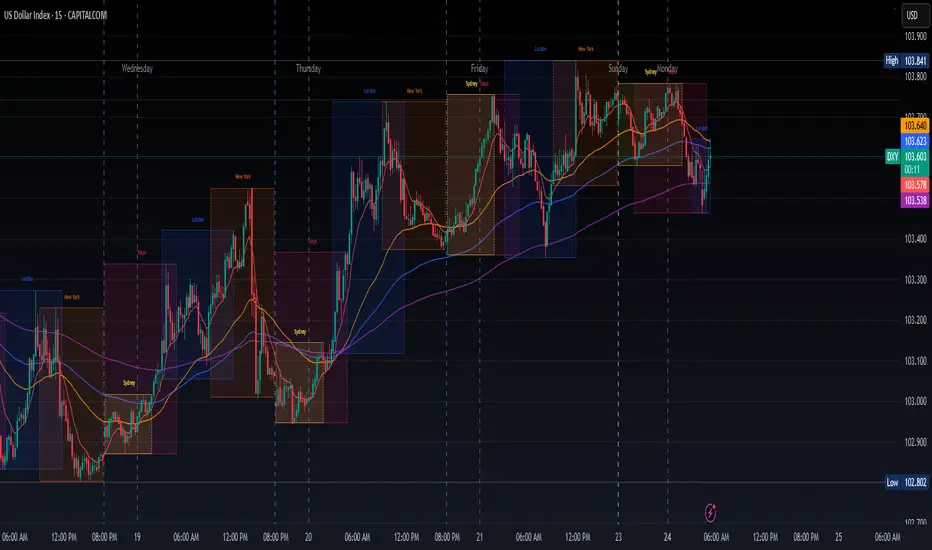
EMA/Session/ATR/LotSizeSeveral indicators combined
1. 6 Exponential Moving Averages - Identifying the trend direction or using EMAs as a dynamic support/resistance.
2. Session on Chart - Highlighting session for day trading. London, New York, Tokyo, and Sydney.
3. Average True Range - display the Average True Range on recent price to calculate the volatility.
4. Lot Size Calculator - to calculate lot size based on account balance, risk per trade, atr stop-loss, and art multiplier.
5. ATRX - ATRX is an indicator that gives the value of the (close price - EMA 27)/ATR (14)
It tells how strong the trend is compared to its volatility
According to AJ. BANK FTMO Trader Thailand, if the value of ATRX is between 2X-3X or -2X-3X, you should consider trading using climax zone on timeframe H1.
If the ATRX is more than 3X or less than -3X but does not exceed 4X or -4X, you should consider trading using timeframe M15 in the climax zone.
However, if the ATRX exceeds 4X or -4X, use M5 instead.

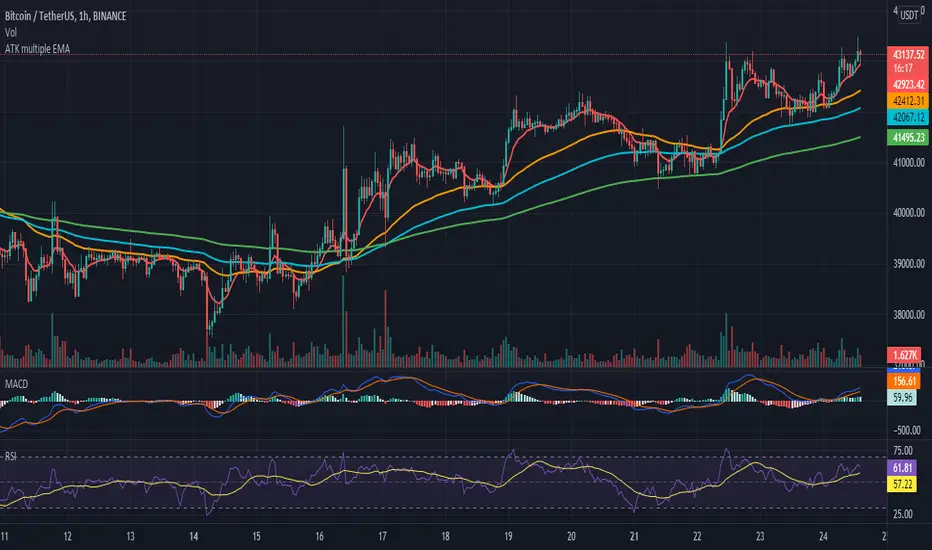
ATK multiple EMA This indicator Have EMA 9/50/99/200 . You can edit number and I add parabolic SAR And Auto Fib Retracement. if don't want to use you can close
Ema Crosses nklassEs un simple indicador de cruces con EMAs, de 11, 22, 50 y 200 periodos.
En un intervalo de velas diarias se obtienen las mejores señales, pero funciona bien para 4h y 15min tambien, recomiendo operar con los cruces de mayor probabilidad por encima y por debajo de la ema200, por debajo solo entradas en CORTO, y por encima solo entradas en Largo, luego de una señal se puede obtener un mejor Riesgo Beneficio si se espera a un posible test del ema 50, y se entra luego de un cierre de vela por por fuera de la ema 11, dandote un buen punto para el stop loss. Recomiendo utilizarlo basandose en zonas de soporte y resistencia de marcos temporales mas altos y teniendo en cuenta posibles divergencias en RSI al igual que su posicion en el momento de entrar al mercado.


Triple EMAThis script contains triple EMAs (20, 50 and 200) you can edit them according to your preferences by going to settings and select whatever EMA you are used to.
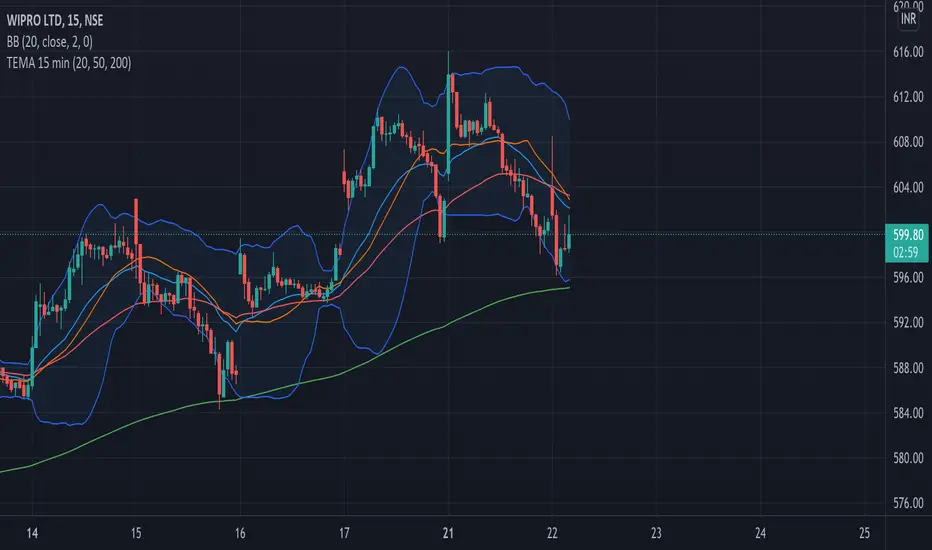
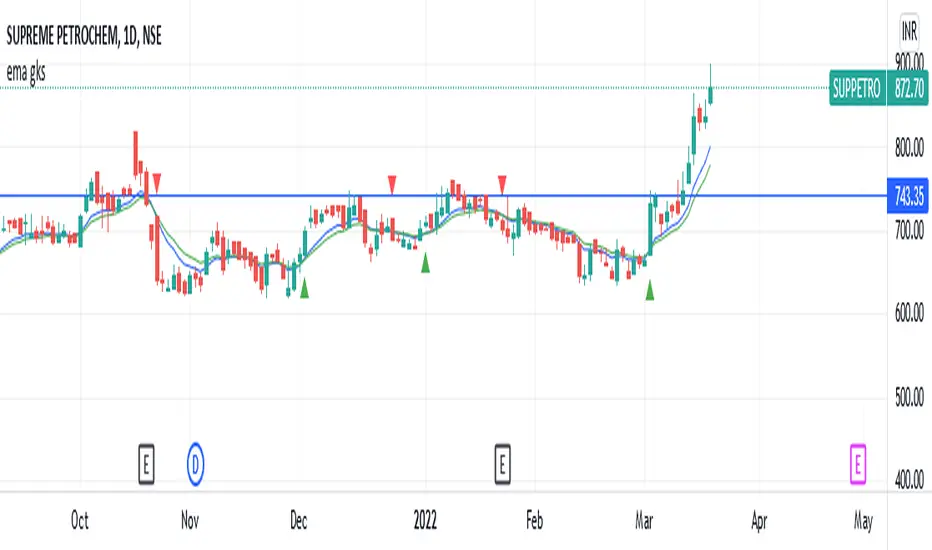
ema gksthis strategy is very simple scripting to buy and sell based on crossover of exponential moving averages
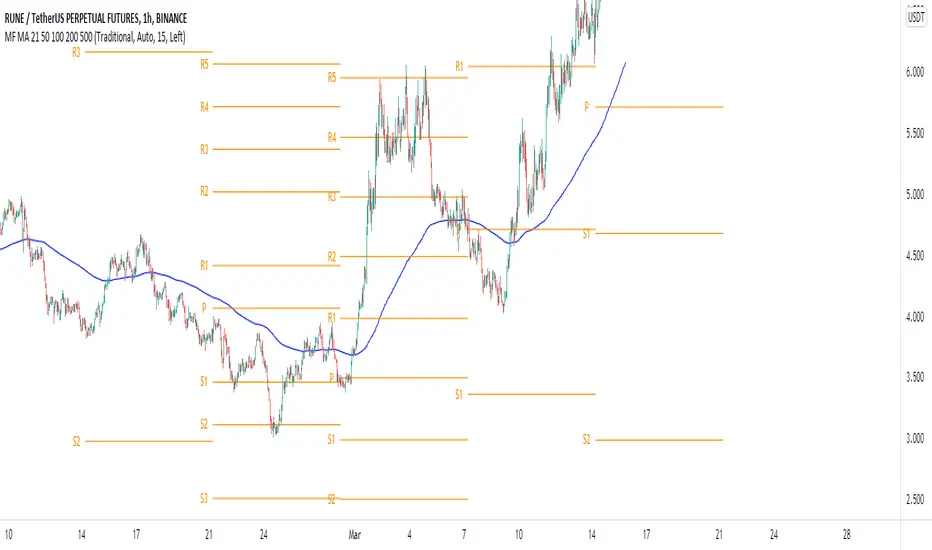
MF 200 EMA PivotPointWe will be using the 200 EMA for identifying the trend of the market & possible cross overs for Swing trades. Pivot points will be really useful for defining the Supports & resistance. By combining with these two strategies we can understand the markets simple & clear. No need to fill your chart with Graphical designs.
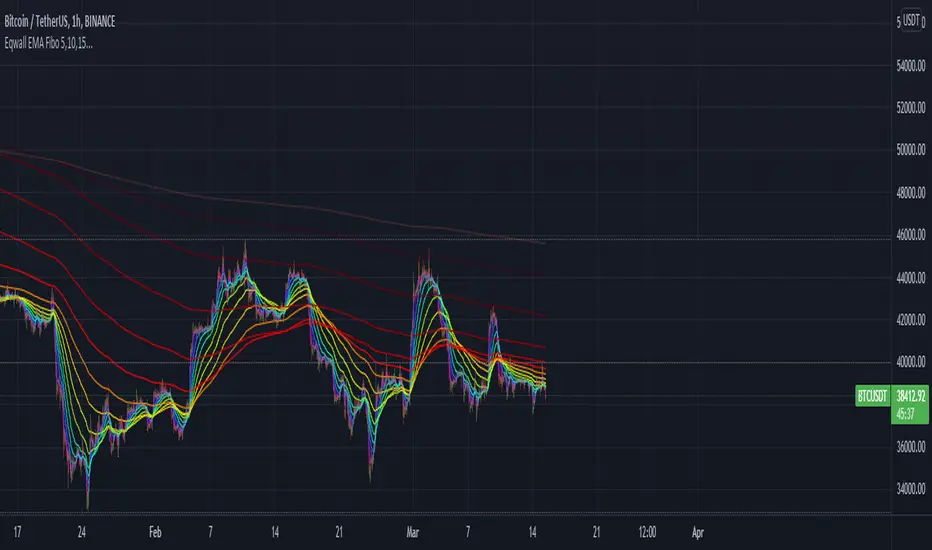
Awen1s EMA FiboEMA based on Fibonacci sequence starting at 5 hours.
Hours: 5, 10, 15, 25, 40, 65, 105, 170, 275, 445, 720, 1165, 1885, 3050, 4935