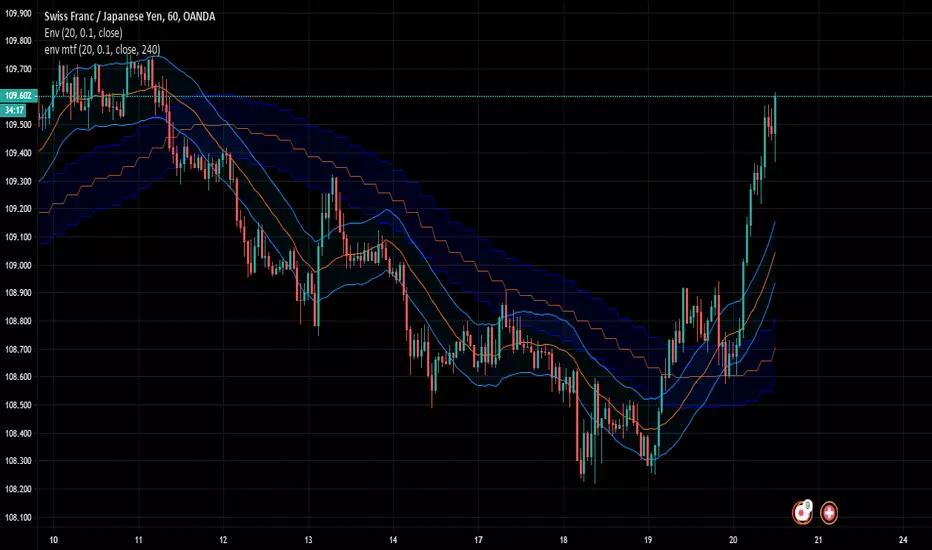
Envelope (ENV)

Envelope MTFthis is a multi time frame envelop indicator.
You can use it on multiple time frames to show the trend from a different time frame perspective
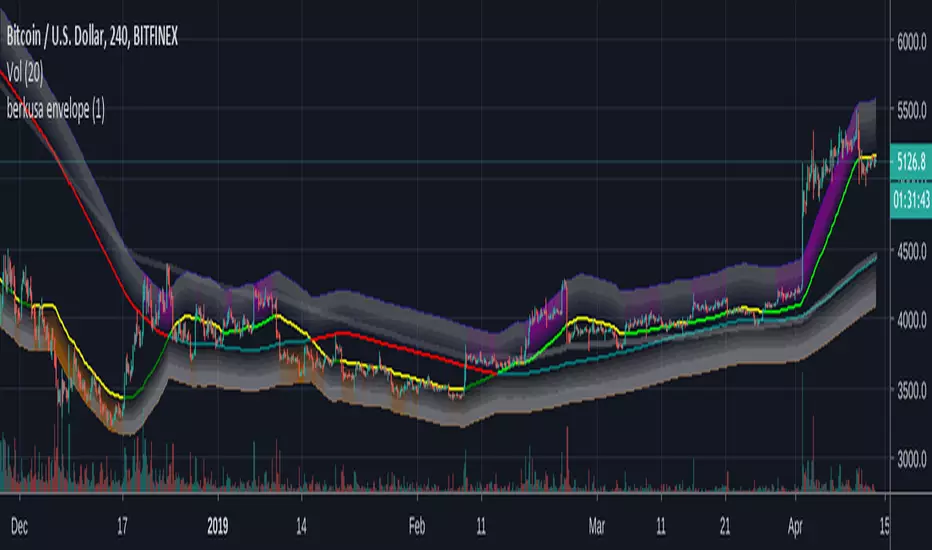
Volume Adaptive BandsIntroduction
I have been asked by @Coppermine and @Verbena to make bands that use volume to provide adaptive results. My first approach was to use exponential averaging, in order to do so i needed to quantify volume movement using rescaling with the objective to make the bands go away from each others when there is low volume, this approach is efficient and can work on any time frame, however i decided at the end to use another method which rely on recursive weighting, cleaner but more parametric. Those bands aim to highlight great breakouts point to go with the trend.
The Indicator
length control the period of the moving averages used in the script, however low length's don't necessarily provide indications for shorter terms breakouts as shown here :
As i said the bands are close to each others when there is high volume and away when there is low volumes.
Low volume period, bands will avoid to cross price
High volume, bands will be close to generate signals.
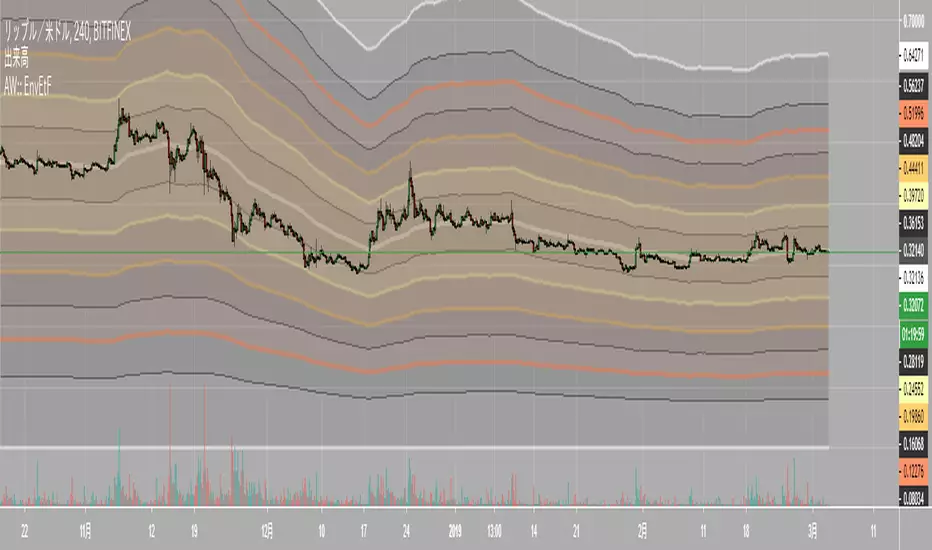
Correction Factor
Higher time frames will lower the distance between each band, this is because volume is higher during higher time frames, remember that the indicator bands are close to each others when volume is high.
1h chart eurusd.
This is why i added a correction factor, this factor can help you control the distance between each bands, when the correction factor is greater than 1 the bands will be closer to each others, this is useful for low time frames where the average volume is lower. When the time frame is high, use values between 0 and 1 to increase distance between each bands.
Correction factor = 0.2
Conclusion
I presented a new adaptive band indicator that adapt to trading volume by using recursive weighting, volume can be replaced by other indicators but you can have results going nuts, at the end its about experimentation. I hope you will find an use to it, thanks to @Coppermine and @Verbena for the request :)
Thanks for reading !

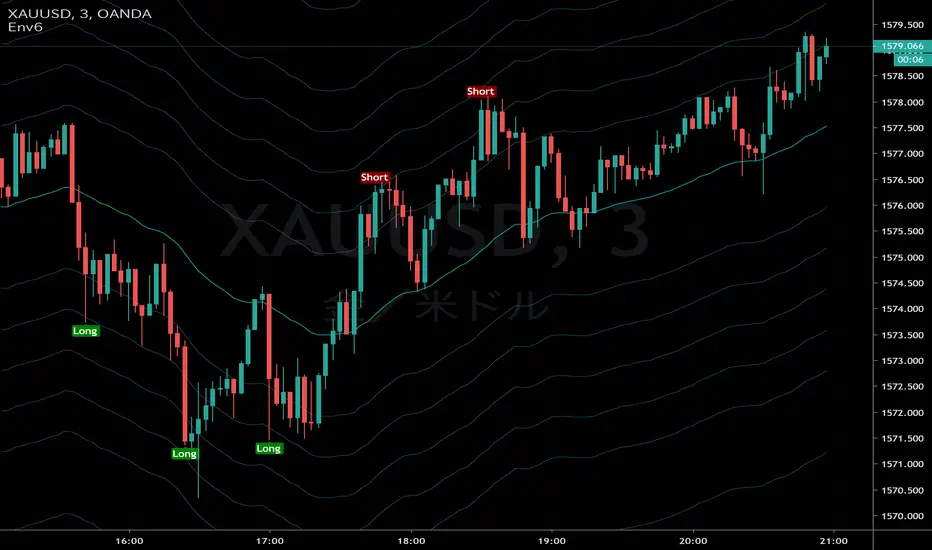
Envelope Breakout Alerts (Heikin Ashi)This is an experimental strategy designed to identify breakouts on 4h to 3d timeframes.
Use at your own risk, it's still only a proof of concept based off the built-in Envelope indicator. Heikin Ashi smoothing is built in.


13utc EUR/USD TariHi guys,
this new strategy is on 1hr chart eur/usd.
It's very easy to follow, becuase you will get 1 signal at 13Utc (1pm utc)
You have only to set Stop Loss @50 and Take Profit@60 (pips not ticks!), but to avoid mistakes green or red lines will appear on the chart to have a better view of Sl and TP.
So, what more? Nothing! Subscribe!
Enjoy your Wallet!
Tari.

AutoEnvelopeA channel that contains approximately 95% of all price data for the past 100 bars, about five months on a daily chart. It automatically plots correct channels for any trading vehicle in any timeframe.
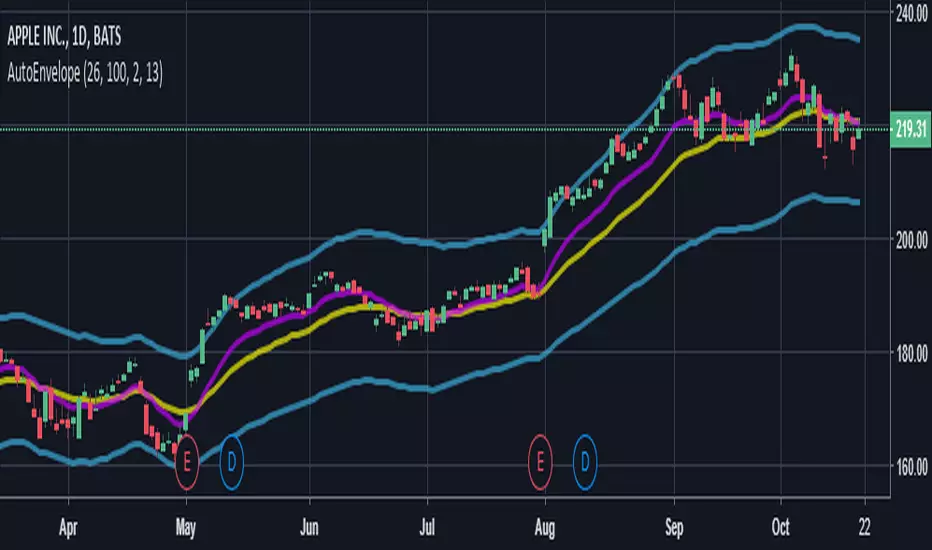
AutoEnvelopeA channel that contains approximately 95% of all price data for the past 100 bars, about five months on a daily chart. It automatically plots correct channels for any trading vehicle in any timeframe.

Elder AutoEnvelopeReference: Transcription of script taken from TC2000 - forums.worden.com
Please let me know if you want me to change the script in anyway, or add new features

clouded pastSearch indicators for "clouded" to find this one, and add to your chart.
Takes lowest(min) and highest(max) of several bars,
averages that over several bars,
shifts by half of the middle of those two bar numbers,
and colors the inbetween by candle color.
You can choose 3 parameters.
Please give feedback, or donation.
Thanks.


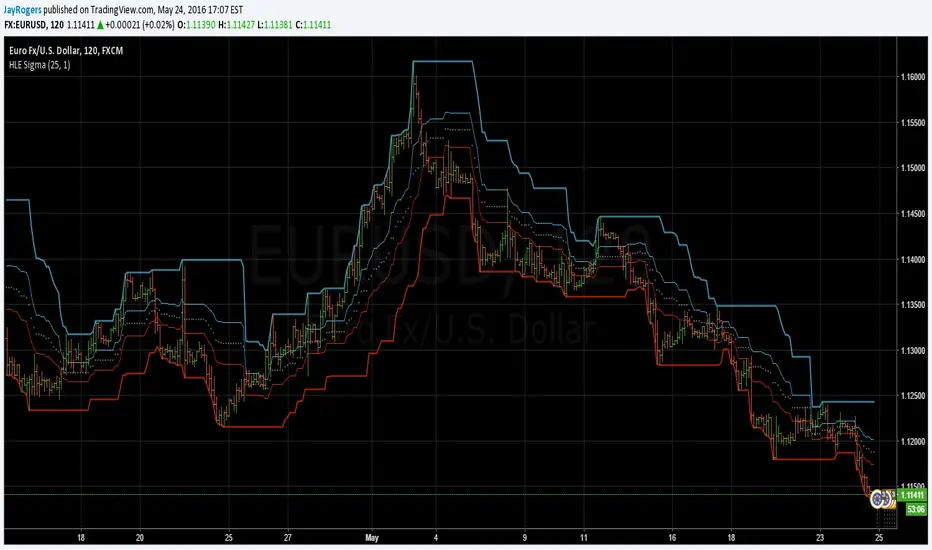
High Low Envelope SigmaDescription:
High and Low Envelope channel with median line and 'sigma' offsets to try and encapsulate price flow and quickly locate likely areas of support and resistance on the fly.
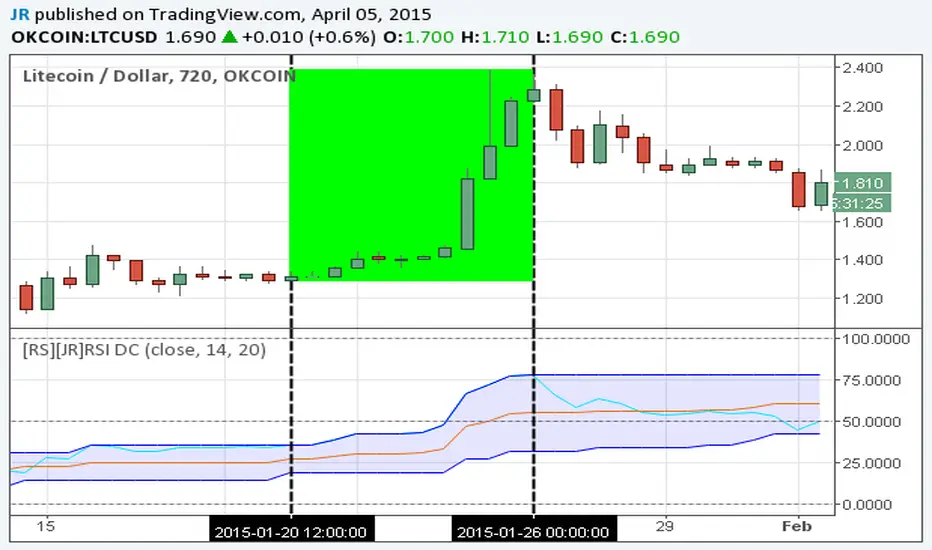
[RS][JR]RSI Donchian ChannelsRSI Donchian Channels
Built by Ricardo and JR
Here is a great indicator to use for strong trends. Donchian Channels react immediately to changes in the highest high and lowest low. For strong trends you want to trade when RSI is set along the upper or lower DC-RSI envelope. When the RSI releases from the DC-RSI envelope, you can take the trade off.
DEnvelope [Better Bollinger Bands]*** ***
Bollinger Bands (BB) usually expand quickly after a volatility increase but contract more slowly as volatility declines. This extended time it takes for BB to contract after a volatility drop can make trading some instruments using BB alone difficult or less profitable.
In the October 1998 issue of "Futures" there is an article written by Dennis McNicholl called "Better Bollinger Bands", in which the author recommends improving BB by modifying:
- the center line formula &
- different equations for calculating the bands.
These bands, called "DEnvelope", follow price more closely and respond faster to changes in volatility with these modifications.
Fore more indicators, check out my "Master Index of indicators" (Also check my published charts page for new ones I haven't added to that list):
More scripts related to DEnvelope:
------------------------------------------------
- DEnvelope Bandwidth: pastebin.com
- DEnvelope %B : pastebin.com
Sample chart with above indicators: www.tradingview.com
