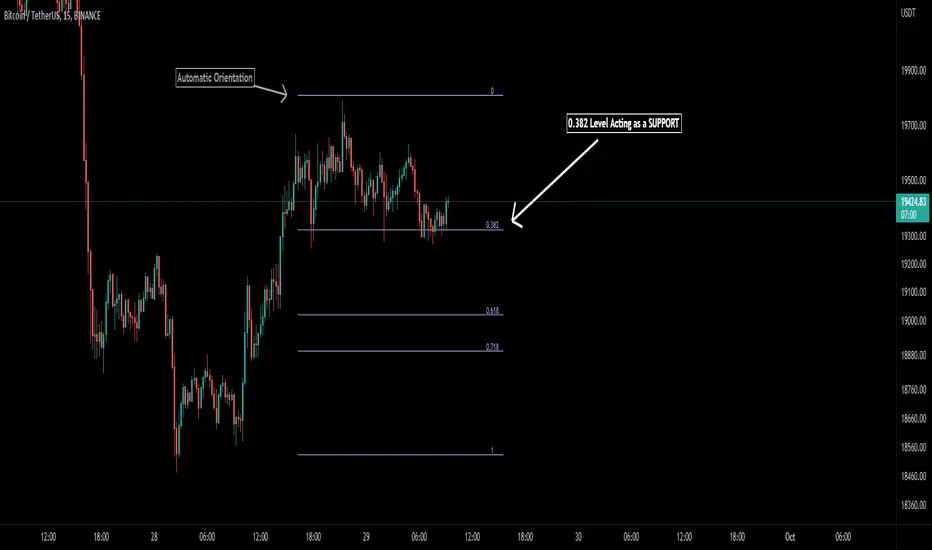
Order Blocks W/ Realtime Fibs [QuantVue]The "Order Blocks W/ Realtime Fibs" indicator is a comprehensive tool combining the concepts of order blocks with Fibonacci retracement. The combination can be a powerful tool for identifying entry and exit points, and potential target areas.
Order blocks indicate where major players have likely placed their orders, while Fibonacci levels provide a mathematical basis for potential support and resistance areas.
What is an Order Block?
An order block in trading refers to an area on the chart in which it is believed a substantial number of orders (buy or sell) collected over a short period. Typically, these are identified as a range of consecutive aggressive bullish or bearish bars (candles). They represent areas where significant market players have entered the market, creating a footprint of their activity.
The indicator is highly customizable allowing user to select the number of consecutive bars and minimum price movement required for an order block, along with other settings like requiring a new order block in the opposite direction before finding a new order block.
Fibonacci Retracements
Fibonacci retracements are popular among technical traders, based on the idea that markets often retrace a predictable portion of a move, after which they continue to move in the original direction.
Once an Order Block is detected the indicator will automatically draw Fibonacci levels and continue to update those levels in real time until the user selected retracement level has been hit or a new more relevant order block has been found.
The combination of order blocks and Fibonacci retracements in this indicator can be used as a method for spotting potential reversal zones.
Indicator features:
🔹Custom Order Block Parameters
🔹Mitigation Type
🔹Custom Colors
🔹Select Retracement Levels
🔹Alerts for Order Blocks & Retracements
Give this indicator a BOOST and COMMENT your thoughts!
We hope you enjoy.
Cheers!
Fibonaccianalysis

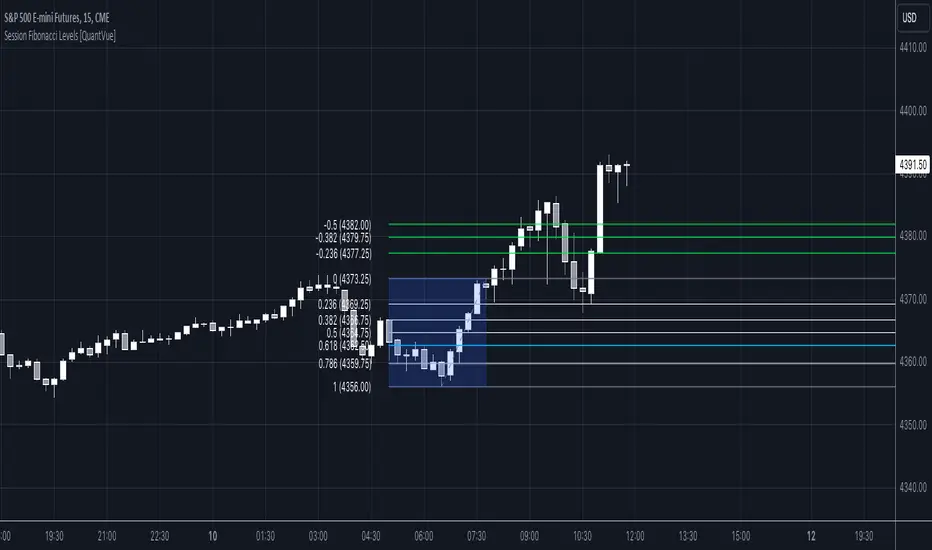
Session Fibonacci Levels [QuantVue]The "Session Fibonacci Levels" indicator is a powerful tool designed for traders who aim to use Fibonacci retracement and extension levels in their trading strategy.
The indicator combines Fibonacci levels with customized trading sessions, allowing traders to observe and utilize Fibonacci levels that are automatically calculated for each defined session.
This approach offers a dynamic and session-relevant perspective on potential support and resistance levels, which can be crucial for intraday trading strategies.
🔹The indicator calculates Fibonacci retracement and extension levels based on the high and low prices of a specified trading session, dynamically adjusting to the location of the high and low bar.
If the low of the session occurs before the high, the fib levels are measured from low to high.
If the low of the session occurs after the high, the fib levels are measured from high to low.
🔹Users can set their time zone and define trading sessions, allowing for flexibility and applicability across global markets. This is particularly beneficial for traders who focus on specific market hours like the London or New York sessions.
Important sessions:
New York (8:00am - 5:00pm EST)
London (3:00am - 12:00pm EST)
Asia (7:00pm - 4:00am EST)
Custom session (user defined session in indicator settings)
🔹The indicator dynamically updates Fibonacci levels as new highs and lows are made within the session, keeping the analysis current. Additionally, it provides alerts when prices hit key Fibonacci levels, aiding in timely decision-making.
How to Use:
Configure the time zone and session time
Once the session begins, the indicator will begin highlighting the session range
When the session ends, Fibonacci levels based on the high and low of the session will be drawn
Use these levels to identify potential support and resistance areas
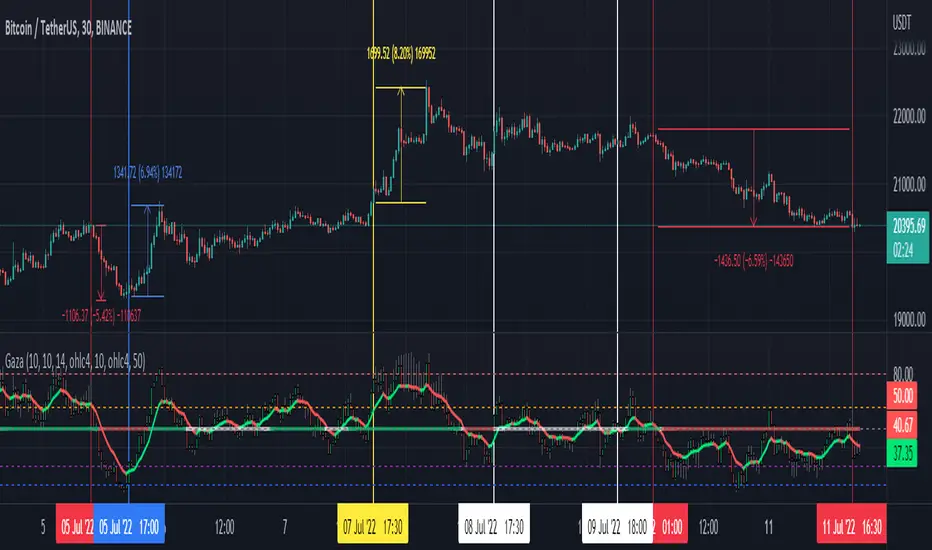
Fibonacci Oscillator (Expo)█ Overview
The Fibonacci Oscillator is a multi-faceted oscillator designed to provide traders with a comprehensive understanding of market trends and retracement points. Built on the Fibonacci ratios, it combines the functionalities of popular oscillators like RSI and MACD with unique insights into the market structure. This oscillator not only helps identify trend direction but also pinpoints overbought and oversold levels, making it an essential tool for various trading strategies.
█ How to Use
Identify Trends
Use the oscillator to identify the direction of the market trend.
Identify Retracements
Use the oscillator to identify the retracements.
█ Settings
Fibonacci Settings
These settings let you customize the Fibonacci level to focus on, thereby allowing you to tailor the oscillator according to your trading preferences.
Oscillator Settings
You can also choose between different oscillator types (RSI, MACD, Histogram) and adjust their respective settings like lengths, signals, and colors.
-----------------
Disclaimer
The information contained in my Scripts/Indicators/Ideas/Algos/Systems does not constitute financial advice or a solicitation to buy or sell any securities of any type. I will not accept liability for any loss or damage, including without limitation any loss of profit, which may arise directly or indirectly from the use of or reliance on such information.
All investments involve risk, and the past performance of a security, industry, sector, market, financial product, trading strategy, backtest, or individual's trading does not guarantee future results or returns. Investors are fully responsible for any investment decisions they make. Such decisions should be based solely on an evaluation of their financial circumstances, investment objectives, risk tolerance, and liquidity needs.
My Scripts/Indicators/Ideas/Algos/Systems are only for educational purposes!

CC Trend strategy 2- Downtrend ShortTrend Strategy #2
Indicators:
1. EMA(s)
2. Fibonacci retracement with a mutable lookback period
Strategy:
1. Short Only
2. No preset Stop Loss/Take Profit
3. 0.01% commission
4. When in a profit and a closure above the 200ema, the position takes a profit.
5. The position is stopped When a closure over the (0.764) Fibonacci ratio occurs.
* NO IMMEDIATE RE-ENTRIES EVER!*
How to use it and what makes it unique:
This strategy will enter often and stop quickly. The goal with this strategy is to take losses often but catch the big move to the downside when it occurs through the Silvercross/Fibonacci combination. This is a unique strategy because it uses a programmed Fibonacci ratio that can be used within the strategy and on any program. You can manipulate the stats by changing the lookback period of the Fibonacci retracement and looking at different assets/timeframes.
This description tells the indicators combined to create a new strategy, with commissions and take profit/stop loss conditions included, and the process of strategy execution with a description of how to use it. If you have any questions feel free to PM me and boost if you found it helpful. Thank you, pineUSERS!
CHEATCODE1

Higher Fibonacci EMAOverall image:
If the closing price is higher than the three Fibonacci EMAs (uptrend):
Thanks to @ZenAndTheArtOfTrading and his indicator "Higher Timeframe EMA", URL =
This is a trend-discriminating indicator that uses 3 EMAs.
The Williams Alligator is the underlying philosophy, and we have applied it to capture the larger trend.
It is set up for the current time frame + 2 higher time frames.
One of the upper time legs has a daily EMA length of 13 Fibonacci numbers.
The top-level time leg has a weekly EMA with a length of 5 Fibonacci.
If the current closing price of the ticker leg is higher than these three EMAs, the bar color will be green. If it is lower, it will be red. If it is neither, it will be gray.
If the bar color is green, it suggests that the trend is upward. If it is red, you can consider entering short. If it is gray, it is best not to enter anything.

*ATR Levels*This script is an enhanced version of "Saty's ATR Levels". With the help of SimpleCryptoLife, he reimagined the script to include these differences:
-view the ATR levels easily with labels and know where the price action is in relation to a specific level
-the included "price follow line" extends across the screen and through the ATR levels label to allow you to easily identify which level you're in or about to enter either on an upswing or downswing
- a +/- 4 and 5 ATR level created that can be turned on for those crazy runners, occasionally a stock will run >5 ATR if you're lucky
Select levels are standard when firing up the indicator but you can click on the appropriate levels to suit your needs and save it from there.
There are several modes to choose from >> Day, Multiday, Swing, Position and Long-Term - Try them out and see what works best for your trading style. For instance:
-Day mode is great for, you guessed it, day trades whether long or shot and ideally paired with 1h or less timeframes
-Multiday is similar to Swing mode and is great for trades less than a week and generally paired with 30m to 1 day timeframe
-Swing mode is great for 1-3 week trades and can be used on higher timeframe such as 30m to 1 day
-Position & long term are of course for longer term trades and ideally paired with 4 hour to 1 month timeframes
ATR length of 14 is standard (look up "Wilder's 14")
Trend indicator based off of the 9-21-34 EMAs // - Range against ATR for each period // - Put and call trigger levels table was created by Saty, located in upper right
Generally, once a candle hits the 23.6% level, look to "go long" but be sure to wait for confluences that support your strategy. Maybe you can wait till the 38.2 level or even higher, dependent on your risk tolerance (stop loss recommended). A candle could come back and retest a certain level that you're eyeing and then continue upwards. As each level is hit, the greater the chance to hit 1 ATR (or higher!). You can start to scale out of a trade at any level but any of the main ATR levels like +1, +2 and so on would be ideal places to take some profit. Keep in mind that a stock can make a run in the pre-market and once the opening bell hits the stock might already be above the +1 ATR level or higher. Conversely the aforementioned is true for stocks to short. The -23.6% level would a "trigger" level but you can use -38.2 etc
Regarding the "use current close" check box: if you're in after or pre-market hours, the ATR levels will remain from the previous day so you'll want to check this box to see what the new levels will be for the current day. But you'll want to uncheck it and leave it unchecked throughout the trading day.
If you find this indicator invaluable and it helps you become a more consistent and profitable trader, feel free to give it a boost and leave a comment if you so desire. As always, trade at your own risk and never use more money than you afford to lose.

3 Zigzag for MTF Fib Alert [MsF]Japanese below / 日本語説明は英文の後にあります。
-------------------------
This indicator that automatically displays Fibonacci from each High & Low based on 3 Zigzags. It's useful for multi-timeframe analysis.
For example, Fibonacci calculated from the high and low prices (Zigzag 3 Period=100) of the upper timeframe can be displayed on the lower timeframe.
Also, you can set alerts for each Fibonacci point. It is useful when you are waiting for the price to return to the discount (50% or less) or the premium (50% or more) of the upper timeframe.
"Fib 1 - Crossing 0.00" … Trigger an alert when crossing the 0% line in Fibonacci of Zigzag1
"Fib 1 - Crossing 100.0" … Trigger an alert when crossing the 100% line in Fibonacci of Zigzag1
"Fib 1 - Crossing 23.6" … Trigger an alert when crossing the 23.6% line in Fibonacci of Zigzag1
"Fib 1 - Crossing 38.2" … Trigger an alert when crossing the 38.2% line in Fibonacci of Zigzag1
"Fib 1 - Crossing 50.0" … Trigger an alert when crossing the 50.0% line in Fibonacci of Zigzag1
"Fib 1 - Crossing 61.8" … Trigger an alert when crossing the 61.8% line in Fibonacci of Zigzag1
"Fib 1 - Crossing 76.4" … Trigger an alert when crossing the 76.4% line in Fibonacci of Zigzag1
*Same as Zigzag 1 and Zigzag 2 too.
"Choose Zig Zag Leg for fib" parameter means...
Latest : Calculate Fibonacci based on "the most recent Zigzag line".
Previous : Calculate Fibonacci based on "the previous Zigzag line".
-------------------------
3つのZigzagを元に各High&Lowからフィボナッチを自動で表示するインジケーターです。
Zigzagの期間を工夫することで、マルチタイムフレーム分析に役立ちます。
例えば、以下の設定とした場合:
Zigzag 1 Period … 8
Zigzag 2 Period … 25
Zigzag 3 Period … 100
上位時間足Zigzag(Period=100)の高値安値から形成されるフィボナッチを下位時間足に表示することができるのです。
また、このインジケーターではフィボナッチのポイント毎にアラートの設定が可能です。
上位時間足の割安価格(50%以下)や割高価格(50%以上)に価格が戻ってくるのを待っている時などに力を発揮してくれます。
"Fib 1 - Crossing 0.00" … Zigzag1のフィボナッチにおいて、0%ラインとクロスした場合にアラートを発報します
"Fib 1 - Crossing 100.0" … Zigzag1のフィボナッチにおいて、100%ラインとクロスした場合にアラートを発報します
"Fib 1 - Crossing 23.6" … Zigzag1のフィボナッチにおいて、23.6%ラインとクロスした場合にアラートを発報します
"Fib 1 - Crossing 38.2" … Zigzag1のフィボナッチにおいて、38.2%ラインとクロスした場合にアラートを発報します
"Fib 1 - Crossing 50.0" … Zigzag1のフィボナッチにおいて、50.0%ラインとクロスした場合にアラートを発報します
"Fib 1 - Crossing 61.8" … Zigzag1のフィボナッチにおいて、61.8%ラインとクロスした場合にアラートを発報します
"Fib 1 - Crossing 76.4" … Zigzag1のフィボナッチにおいて、76.4%ラインとクロスした場合にアラートを発報します
※Zigzag1およびZigzag2のフィボナッチも同様
"Choose Zig Zag Leg for fib"パラメータについて:
Latest … 一番新しいZigzagのライン(UpまたはDown)を元にフィボナッチを計算します。
Previous … ひとつ前のZigzagのライン(UpまたはDown)を元にフィボナッチを計算します。

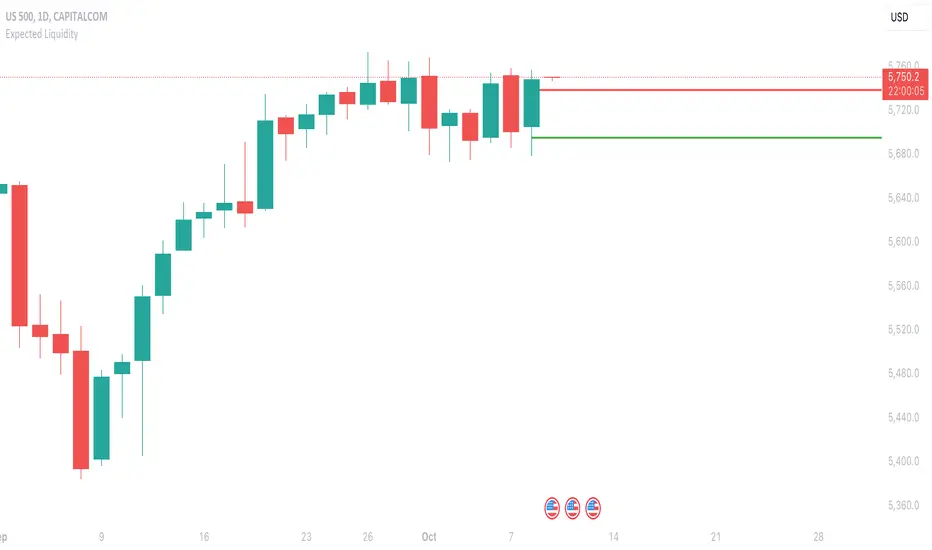
Expected LiquiditySimple but effective script that displays Liquidity Premium/Discount areas in an adaptive way based on key Fibonacci levels.
You can increase or decrease the 'Period' value in the Settings to adjust the gap between the lines as you see fit.
By default the value is '46' which should suit most markets.
- The script contains Alerts which are triggered when a liquidity line is crossed by the price.
Good trading to all and don't forget, risk management remains the most important!
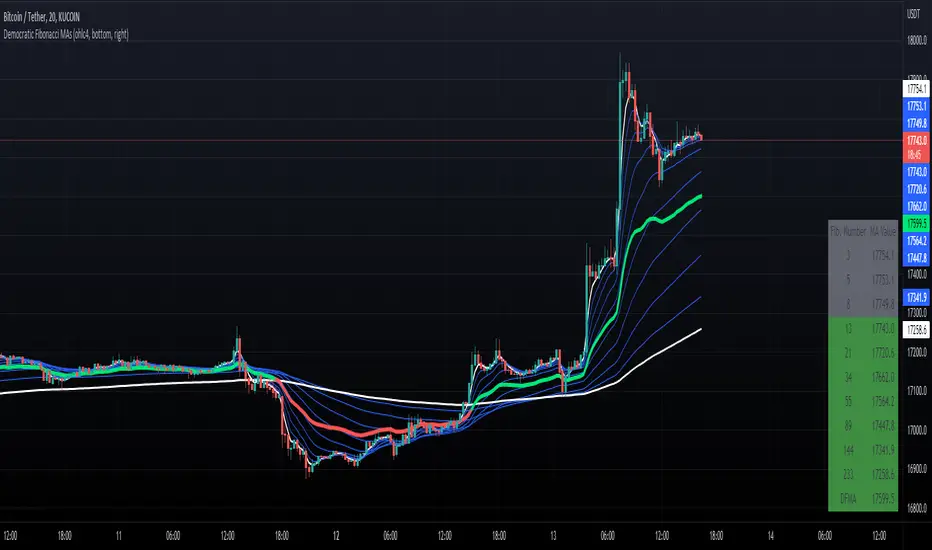
Democratic Fibonacci Moving AveragesWith this indicator, we have taken moving averages at Fibonacci lengths (3 to 233) as well as the average of these values, labeled the DFMA. Additionally, these values have been inputted into a table overlay. The cross of the FibMA(233) and the DFMA can be used as a signal for long or short.
The FibMA lengths of 3 and 233 are plotted in white by default, the FibMAs with lengths between 3 and 233 are plotted in blue by default, and the democratic line (DFMA) that averages these lines is plotted in green or red (depending on if the value is above or below the 233-length FibMA).
PriceCatch Ultimate Auto Fibonacci LevelsHello and Warm Greetings to TradingView community.
PriceCatch Ultimate Auto Fibonacci Levels
The only Fibonacci Levels script you'll ever need.
The Problem
One of the problems faced by traders who use Fibonacci levels is that they have to draw the levels manually on their charts. It's tedious and sometimes leads to inaccuracies in identifying correct levels.
Secondly, while there are so many Auto Fibonacci scripts available in the Public Scripts Library, most of them are not really useful as they are very limited in their capability for the following reasons:
either they are based on historical bars or historical pivots - user has to enter the number of historical bars or pivots for the starting point of the Fibonacci Levels.
they are time-frame dependent and re-plot levels when chart's time-frame changes. This is a very serious limitation with most scripts.
they do not offer real and practical user settings.
many of them are not actually pure Fibonacci Levels scripts.
Limitations with other Auto Fibonacci scripts
Other Fibonacci scripts ask user to specify a number of historical bars or pivots to draw the Fibonacci levels. This is a major problem with such scripts - because 50 historical bars on the daily time frame changes to 50 historical bars on the 4H if you change the chart's time-frame to 4H, thereby altering the position of the Fibonacci levels. So, the desired view that the user seeks about price action is not what he/she gets whenever the time-frame changes. Similarly with specifying Pivots. For example, for a swing trader who specifies Pivots, the number of pivots that occur in one month varies depending on the chart's time-frame. So after trying these scripts, users quickly realize that these scripts do not serve purpose.
PriceCatch Ultimate Auto Fibonacci Levels - Unparalleled advantage
The PriceCatch Ultimate Auto Fibonacci Levels script that I am publishing is completely different from other Fibonacci scripts on the TradingView Public Library. My script offers users unparalleled flexibility and options to use it effectively and to suit their trading style. With PriceCatch Ultimate Auto Fibonacci Levels script, user has the ability to choose a variety of options to draw the Fibonacci levels from Current Day, Previous Day all the way up to 52 weeks. Not only that, users can also set their own levels via input options and that makes it even more adaptive to a user's specific needs. So, if you do not want 0.382 level and want the level to be at 0.312, yes, you can do that with this script.
Time-frame independence
This script works independent of the chart time frame and this is it's USP. So, while your chart may be set to 15 minutes time-frame, you can set the script to draw Fibonacci levels of Previous Week, last 3 days or any other available interval of your choice and it will draw it accurately. What's more, you can change your chart's time-frame to any interval of your choice and the Fibonnacci levels stay fixed and true to the chosen option. This ability is very helpful to the user because while the Fibonacci levels are drawn based on the chosen interval's high and low, user can then choose any chart time frame to trade on the drawn Fibonacci levels. This is the crucial difference and big advantage of PriceCatch Ultimate Auto Fibonacci Levels script from other scripts.
Chart type independence
PriceCatch Ultimate Auto Fibonacci Levels script is also independent of chart type. You can set your chart to Bars, Japanese, Hollow, Heikin-Ashi or even line style and this script accurately draws the Fibonacci levels as the logic is independent of chart type.
Time series
For traders who combine Time-Series also in their trading set-up with Fibonacci levels, this script includes Time-Series as well to aid those traders.
Highly configurable
With a number of configuration options, PriceCatch Ultimate Auto Fibonacci Levels script offers utmost flexibility and ease of use to every user.
Practical and really useful
I have written the script after careful study of all the other available scripts and only then took on this project. Once you look at other scripts and what they lack, you will realize my script is all-rounded, very flexible with a wide variety of options to choose from. All of these features make PriceCatch Auto Fibonacci Levels script unique, very powerful and highly useful to traders.
Use Cases
Intraday
If you trade intraday, setting the interval to 3D (3 days) will give you Fibonacci levels of last three days. This may be useful in taking intraday trades by knowing probable support and resistance levels in that period. Then, you can trade on 1 minute, 3 minutes, 5 or any other intraday time frame of your choice.
Swing / Long term trading
For swing or long term traders, setting the interval to PM (previous month) or CQ (current quarter) will help you find probable support / resistance levels in that period that you can use to plan your trades. Then, of course, with the 52W setting, you can take a really long term view of the asset.
Multiple Advantage
Since you can add the script more than once to your chart, you can set one script to a longer time frame and another to a shorter one to form a combination of Fibonacci levels to give you even more precise and desired information about price action and to help you plan/manage your trades.
A Sample
GBPUSD with CQ (Current Quarter) setting
NOTE - PRIOR TO USING THIS SCRIPT
Please remember that the script is shared with absolutely no assurances about usability and any warranties whatsoever and as a responsible trader, please satisfy yourselves thoroughly and use it only if you are satisfied it works for you. Remember, you are 100% responsible for your actions. If you understand and accept that, you may use the script.
QUERIES/FEEDBACK
Please PM me.
I have to thank @BJORGUM for helping me out with this script.
Hope you find this script useful. Wish everyone all the best with trading.

Fibonacci Plot [ABA Invest]]ABOUT
This Fibonacci tool is easier than the usual Fibonacci drawing. with this, we can use Fibonacci drawing by choosing 2 different candles as starting point and ending point
INPUT SETTING
Fibonacci type: we can choose the type
option 1--> Fibonacci standard: display multiple levels constructed using the starting price point, ending price point, and multiple Fibonacci ratios. These levels can be used as support and resistance
option 2--> Fibonacci musang displays multiple levels constructed using the starting price point, ending price point, and multiple Fibonacci ratios. these levels can be used as taking profit level and also to know the ending of trendline
Drawing point: we can choose the type how we want the tools to draw our starting and ending point at candlestick
- wick to wick
- wick to body
- body to body

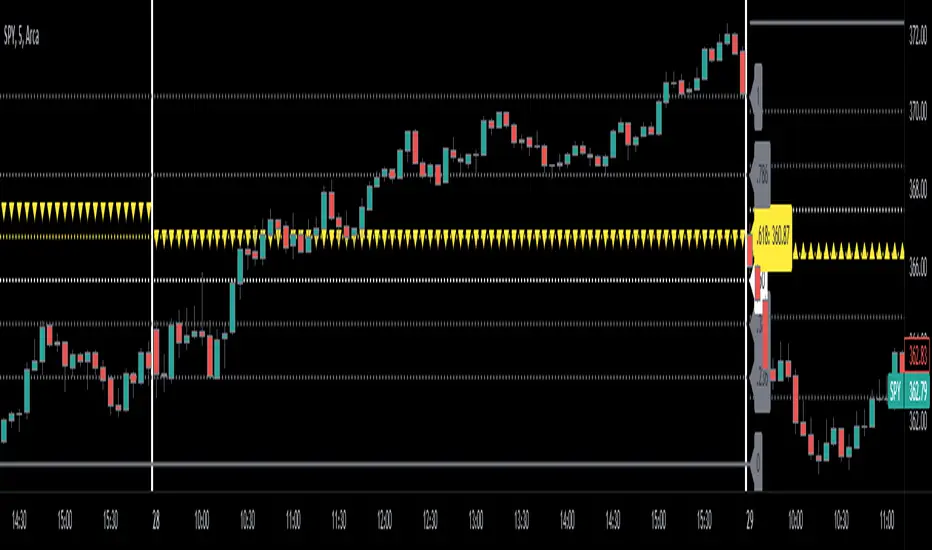
Automatic Fibonacci Retracement + Golden Ratio | by Octopu$👑 Automatic Fibonacci Retracement on Specific Timeframes + Golden Ratio | by Octopu$
Fibonacci Retracement is a method of technical analysis for determining support and resistance levels.
It is named after the famous Fibonacci sequence of numbers: 23.6%, 38.2%, 61.8%, and 78.6%
These ratios provide price levels to which markets tend to retrace a portion of a move.
Also used as a potential spot before a trend continues (or reverses) original direction.
While not officially a Fibonacci ratio, 50% is also used.
Fibonacci Levels can be drawn between any two significant price points or time frames.
(Such as a High and a Low or also on Daily and Weekly charts)
The indicator will then Automatically create the levels between those selected points.
Golden ratio, also known as the divine proportion, in mathematics, is the irrational number:
(1 + Square root of√5)/2, often denoted by the Greek letter ϕ or τ
Which is approximately equal to 1.618.
(Two quantities are in the golden ratio if their ratio is the same as the ratio of their sum to the larger of the two quantities.)
That's The Magic of the Fibonaccis, as well the Golden Ratio itself.
And this is exactly where this Indicator by Octopu$ kicks in:
This indicator Automatically sets all the Fibonacci Levels within the Retracement selected.
On top of that, it Highlights the Golden Ratio for the Fibonacci Levels drawn.
Additionally, it sets the Golden Ratio as possible Support or Resistance level,
Doing so by having visual identification to the Up or Down side.
This changes the game! Along with Price Action, Trend Direction, Chart Analysis and other Indicators as well.
(The combination relies on your own knowledge about Confluence Factors along with your Due Diligence)
www.tradingview.com
SPY
ANY Ticker. ANY Timeframe.
(SPY 5m as an example only)
Features:
• Multiple Timeframes
• Automatic Lines
• Fibonacci Setup
• Golden Ratio
• S/R Highlight
Options:
• Timeframe Selection
• Fibonacci Rates
• Line Customization
• Color Pickers
• Toggle On/Off
Notes:
v1.0
Indicator release.
Changes and updates can come in the future for additional functionalities or per requests. Follow and Stay Tuned!
Did you like it? Please Support and Shoot me a message! I'd appreciate if you dropped by to say thanks! Thank you.
- Octopu$
🐙
Auto Fibonacci [Misu]█ This indicator shows an automatic Fibonacci retracement levels.
This indicator is designed based on highs, lows, and trend interpretation to orientate the fibonacci retracement in the good direction.
Fibonacci analysis uses a logical sequence of numbers to predict trends and price action.
█ Usages:
The Fibonacci retracement is used to identify hidden support and resistance levels that an investor can use for entry, exit, and stop placement.
Depending on your usage, you can track breakouts above and below retracement levels to provide early entry points for major breakouts and breakdowns.
█ Features:
> Choose Fib levels
> Color Fib Levels all in one
> Color Fib Levels Individually
█ Parameters:
Deviation: A parameter used to calculate pivots.
Depth: A parameter used to calculate pivots.
UI Settings: Select Fibs levels and colors.
God Number Channel v2(GNC v2)GNC got a little update:
1) Logic changed a bit.
I tried to calculate MAs based on the power(high - low of previous bars).You can see it the M-variables, as new statements were added in calculation section of MAs. I don't really know if I did right, because I didn't go too much in Pine Script. I just wanted to make a Bollinger-bands-like bands, which could predict the levels at which might reverse, using legendary fibonacci and Tesla's harmonic number 432. It's might sound as a joke, but as you can see, it works pretty good.
2) Customization :
No need to change Fibonacci ratios in code. Now you can do it in the GNC settings. Also MAs' names were made obvious, just check it out. Time of million similar "MA n1" has passed :)
3) Trade-entry advices :
I didn't tell you exactly the trade-entry advices, as I haven't explored this script fully yet :) But you probably understood something intuitively, when added GNC on the chart. Now I made things way more obvious:
1. Zones between Fib ratios show you how aware you should be of price movements. Basically, here are the rules, but you probably understand them already:
1.1 Red zone(RZ) : high awareness, very likly for price to be reversed, but if there is a clear trend and you know, than it might be a time for price to shoot up/down.
1.2 Orange zone(OZ) : medium awareness, not so obvious, as price might go between boundaries of OZ and continue the trend movement if such followed before entering the OZ. If price go below lower boundary of OZ and the next bar opens below this boundary, it might be a signal for SHORY, BUT(!) please consider confirmation of any sort to be more sure. Think of going beyond the upper boundary by analogy.
1.3 Green Zone(GZ) : if the price hits any boundary of green zone, it is usually a good oppurtunity to open a position against the movement(hit lower boundary -> open LONG, hit upper boundary -> open SHORT).
1.4 Middle Zone(Harmonic Zone)(MZ) : same rules from Green Zone.
IMPORTANT RECCOMENDATION : Use trend indicator to trend all signals from zones to follow the trend, 'cause counter-trending with this thing without stop loss might very quickly wipe you out , might if you will counter-trend strategy with GNC, I will be glad if you share it with the community :)
Reccomendation for better entries :
1) if the price hits the lower(or high) boundaries(LB or HB) zone after zone(hit LB or HB of RZ, then of OZ, then of GZ), it is a very good signal to either LONG, if price was hitting LBs , or SHORT, if hitting HBs .
2) Consider NOT to place trades when in MZ, as price in this zone gets tricky often enough. By the way, if you dont the see the harmonic MAs(which go with plot(ma1+(0.432*avg1)) ), then set the transparency of zone to 20% or a bit more and then it will be ok.
I will continue to develop the GNC and any help or feedback from you, guys, will be very helpful for me, so you welcome for any of those, but please be precise in your critics.
Thank you for using my stuff, hope you found it usefull. Good luck :)

Ultimate RSI With Some Spices★彡 𝓤𝓵𝓽𝓲𝓶𝓪𝓽𝓮 𝓡𝓢𝓘 𝓦𝓲𝓽𝓱 𝓢𝓸𝓶𝓮 𝓢𝓹𝓲𝓬𝓮𝓼 彡★
* Hi everybody here's the ★彡 𝓤𝓵𝓽𝓲𝓶𝓪𝓽𝓮 𝓡𝓢𝓘 𝓦𝓲𝓽𝓱 𝓢𝓸𝓶𝓮 𝓢𝓹𝓲𝓬𝓮𝓼 彡★ indicator and how to use it :
彡彡彡彡彡彡彡彡彡彡彡彡彡彡彡彡彡彡彡彡彡彡彡彡彡彡彡彡彡
First we have that red : green {RSI EMA Line}line in the indicator which show the current symbol situation \
𝐒𝐢𝐦𝐩𝐥𝐲 : 𝐢𝐟 𝐭𝐡𝐞 𝐥𝐢𝐧𝐞 𝐜𝐥𝐨𝐬𝐞 𝐰𝐢𝐭𝐡 𝐠𝐫𝐞𝐞𝐧 𝐜𝐨𝐥𝐨𝐫 𝐲𝐨𝐮 𝐜𝐚𝐧 𝐨𝐩𝐞𝐧 𝐚 𝐥𝐨𝐧𝐠 𝐭𝐫𝐚𝐝𝐞 𝐚𝐧𝐝 𝐞𝐱𝐢𝐭 𝐰𝐡𝐞𝐧 𝐭𝐡𝐞 𝐫𝐞𝐝 𝐜𝐨𝐥𝐨𝐫 𝐚𝐩𝐩𝐞𝐚𝐫𝐬
I𝐧 𝐭𝐡𝐞 𝐬𝐚𝐦𝐞 𝐭𝐢𝐦𝐞 𝐰𝐞 𝐡𝐚𝐯𝐞 𝐨𝐭𝐡𝐞𝐫 𝐭𝐡𝐢𝐧𝐠𝐬 𝐭𝐨 𝐮𝐬𝐞 𝐰𝐢𝐭𝐡 𝐭𝐡𝐚𝐭 𝐰𝐨𝐮𝐥𝐝 𝐡𝐞𝐥𝐩 𝐮𝐬 𝐭𝐨 𝐦𝐚𝐤𝐞 𝐚 𝐠𝐨𝐨𝐝 𝐨𝐫𝐝𝐞𝐫
Like The 𝐂𝐲𝐜𝐥𝐞𝐫 𝐬𝐢𝐭𝐮𝐚𝐭𝐢𝐨𝐧 𝐚𝐧𝐝 𝐟𝐢𝐛𝐨𝐧𝐚𝐜𝐜𝐢 𝐥𝐞𝐯𝐞𝐥𝐬
We have the 𝐧𝐞𝐱𝐭 𝐟𝐢𝐛𝐨𝐧𝐚𝐜𝐜𝐢 𝐥𝐞𝐯𝐞𝐥𝐬 𝟐𝟎 ,𝟑𝟎 ,𝟓𝟎 ,𝟔𝟏.𝟖 ,𝟖𝟎 { 61.8 𝐢𝐬 𝐭𝐡𝐞 𝐭𝐡𝐞 𝐟𝐢𝐛𝐨𝐧𝐚𝐜𝐜𝐢 𝐠𝐨𝐥𝐝𝐞𝐧 𝐫𝐚𝐭𝐢𝐨 }
About The 𝐂𝐲𝐜𝐥𝐞𝐫 you can use it to know where is the current symbol go { UP : Green ,| Down : Red ,| White : Where the symbol movement is in a slight fluctuation without any significant up or down }
░▒▓█ 𝐍𝐨𝐭𝐞 : 𝐓𝐡𝐞 𝐂𝐲𝐜𝐥𝐞𝐫 𝐥𝐢𝐧𝐞 𝐢𝐬 𝐭𝐡𝐞 𝐬𝐚𝐦𝐞 𝐟𝐢𝐛𝐨𝐧𝐚𝐜𝐜𝐢 𝐥𝐞𝐯𝐞𝐥 ' 𝐫𝐚𝐭𝐢𝐨 𝟓𝟎 ' █▓▒░
𝐡𝐞𝐫𝐞'𝐬 𝐚 𝐟𝐚𝐬𝐭 𝐩𝐡𝐨𝐭𝐨 𝐭𝐡𝐚𝐭 𝐬𝐡𝐨𝐰 𝐞𝐯𝐞𝐫𝐲𝐭𝐡𝐢𝐧𝐠
When the RSI EMA Line reach the purple 𝐟𝐢𝐛𝐨𝐧𝐚𝐜𝐜𝐢 level its a very good entry point where the RSI is over sold and ready to g oup again
When the RSI EMA Line reach the Golden 𝐟𝐢𝐛𝐨𝐧𝐚𝐜𝐜𝐢 level its a very important area in the line crossover it then it's a very amazing entry time but if the RSI EMA line crossunder this line then the price w'll drop down
❤❤❤❤ 𝐟𝐢𝐧𝐚𝐥𝐥𝐲 𝐇𝐚𝐯𝐞 𝐚 𝐠𝐨𝐨𝐝 𝐭𝐢𝐦𝐞 ❤❤❤❤
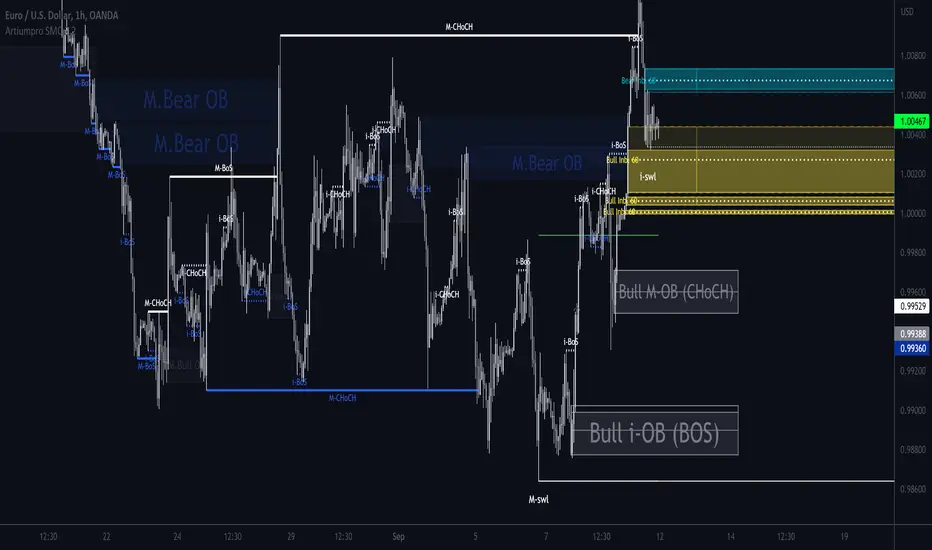
ArtiumPro Smart Money ConceptsSmart money concepts refer to the use of institutional trading strategies which align with the perspectives of Smart Money in the market. i.e. the composite man. Market Structure is the foundation of price action trading, understanding price action is fundamental to SMC.
ArtiumPro SMC 2.1 is an SMC (Smart Money Concepts) indicator full of features to aid SMC traders. Our aim is to save you time with automatic chart mark-up and help you spot areas of interest you may miss with the naked eye.
Fvg (Fair Value Gap) - is also known as an imbalance. An FVG is an imbalance of orders, for instance, for sellers to complete their trades, there must be buyers and vice versa so when a market receives too many of one kind of order buys or sells, and not enough of the order's counterpart. When the amount is not balanced and too many orders are put in for one direction, it creates an imbalance.
Multi timeframe FVG - this will show the same as above but on the higher timeframe you choose. It’ll show as 2 lines that show the higher timeframe fvg with a filled box that mitigates on entry.
Order Blocks - These are supply and demand zones, displayed typically as the last down/up candle before a move in the opposite direction. Great POI’s for entry and take profits.
Outside candle - this is a candle that sweeps the highs and lows of the previous candle, best used for the 1 hour or above these can indicate a change of price direction.
Previous day high & low
Not only does it show your previous day's low and high but it also shows your opening and close of the day. You have settings where you can turn off the open and close and just have daily highs and lows. It’s your choice within your settings.
Market Structure - We have packed this feature with options that are customizable for you,
Break of Structure (BOS) indicates a trend continuation.
Change of Character (CHoCH) indicates the first sign of a possible trend change.
Equal Highs/lows - this will mark your double/triple tops and bottoms.
Retracement - set this to your preferred retracement amount to customize your market structure to what you qualify as a valid pullback.
Elliott Wave ZigZag
Many people ask for the Elliott Waves. Well, here it is, inside this SMC. Just like your pivot highs and lows, the Elliott Wave is showing in real-time so you can see where your previous highs and lows are with the Elliott Wave break of structures that you can use in conjunction with the Smart Money Concepts Indicator of ArtiumPro.
Fib levels - for Premium & Discount areas - in this Instance the fib is used to determine if the price has pulled back into a premium or discount zone for optimal trade entry.
Trading Sessions
One of the most advanced trading session indicators out there and it’s included inside the most advanced SMC indicator on the market today. It has open breakout and settings to filter the opening range along with your pip daily range. You can select what timezone you are in and it automatically adjusts on the chart. Cool right? Hope you enjoy it, happy trading!
FibDay by CLKEN: It determines the fibonacci levels based on the high and low price of the previous day. You can track daily.
TR: Bir önceki günün en yüksek ve en düşük fiyatına göre fibonacci seviyelerini belirler. Gün içi takibi yapabilirsiniz.

v2.3 Weekly Fibo Candle Middle LineThis is a real time tools assisting traders in monitoring the Fibonacci Retracement Levels while the range is extending in real time run. I have simply marked the three most important Fibonacci retracement level, namely 38.2%, 50%, 61.8% which are colored and marked as blue Fibo_up, red Fibo_mid and blue Fibo_low. Should you have any idea in trading with other Fibonacci levels, please send me your feedback for improvement and sharing.

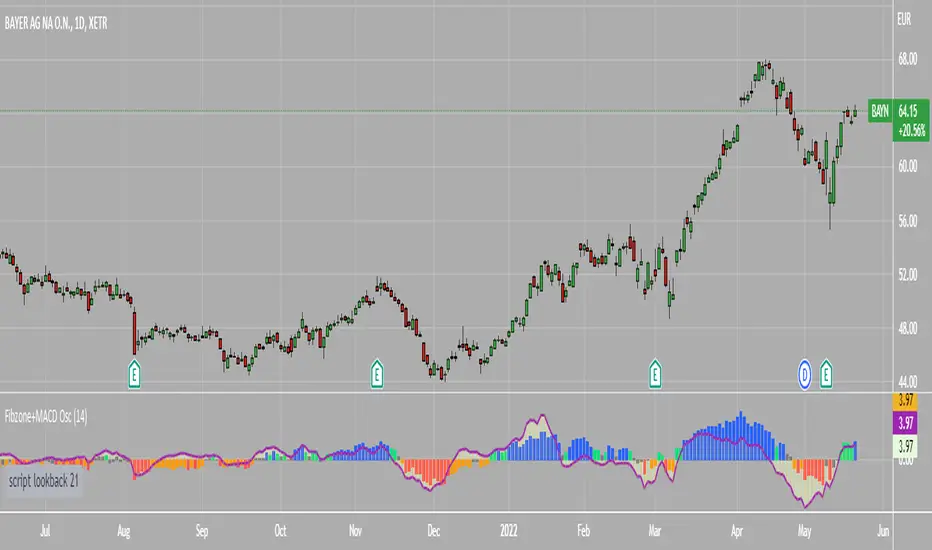
Fibonacci Zone Oscillator With MACD HistogramThe columns
After I found a way to calculate a price as a percent of the middle line of the KeltCOG Channel in the KCGmut indicator (published), I got the idea to use the same trick in the Fbonacci Zone Channel (also published), thus creating an oscillator.
I plot the percent’s as columns with the color of the KeltCOG Channel. Because the channels I created and published (i.e. Fibonacci Zone, Donchian Fibonacci Trading Tool, Keltner Fibzones, and KeltCOG) all use Fibonacci zones, this indicator also reports the position of the close in their zones.
Strategy and Use:
Blue column: Close in uptrend area, 4 supports, 0 resistance, ready to rally up.
Green column: Close in buyers area, 3 supports, 1 resistance, looking up.
Gray column: Close in center area 2 supports, 2 resistances, undecided.
Yellow column: Close in sellers area 1 support, 3 resistances, looking down.
Red column: Close in downtrend area, 0 support, 4 resistances, ready to rally down.
I use this indicator in a layout with three timeframes which I use for stock picking, I pick all stocks with a blue column in every timeframe, the indicator is so clear that I can flip through the 50 charts of my universe of high liquid European blue chips in 15 minutes to make a list of these stocks.
Because I use it in conjunction with KeltCOG I also gave it a ‘script sets lookback’ option which can be checked with a feedback label and switched off in the inputs.
The MACD histogram
I admire the MACD because it is spot on when predicting tops and bottoms. It is also the most sexy indictor in TA. Actually just the histogram is needed, so I don’t show the macd-line and the signal line. I use the same lookback for the slow-ma as for the columns, set the fast-ma to half and the signal-line to a third of the general lookback. Therefore I gave the lookback a minimum value of 6, so the signal gets at least a lookback of 2.
The histogram is plotted three times, first as a whitish area to provide a background, then the colums of the Fibzone Oscillator are plotted, then the histogram as a purple line, which contrasts nicely and then as a hardly visible brown histogram.
The input settings give the option to show columns and histogram separate or together.
Strategy and use:
I think about the columns as showing a ‘longer term chosen momentum’ and about the histogram as a ‘short term power momentum’. I use it as additional information.
Enjoy, Eykpunter.
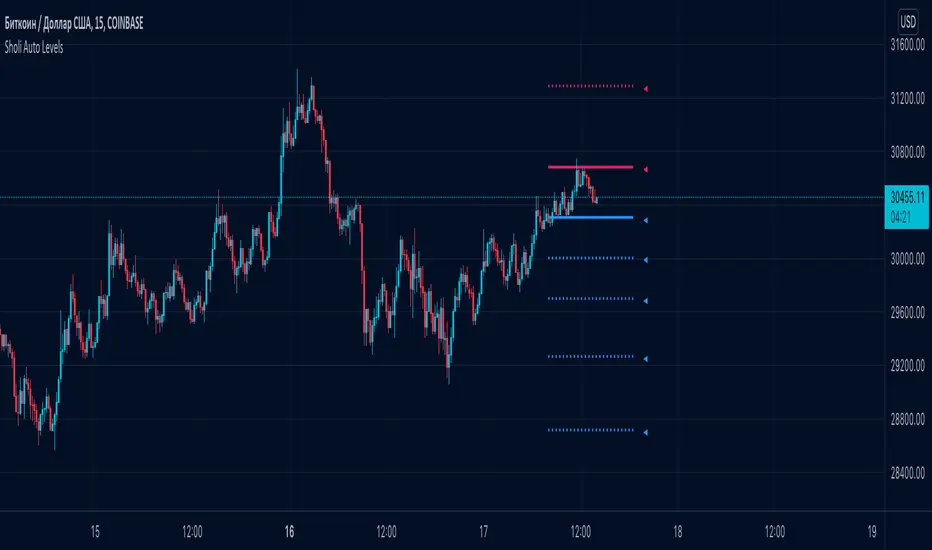
Sholi Auto Levels◾️ Auto levels are calculated for each timeframe separately. The script builds fibonacci levels once in a certain period for each of the timeframes. With the help of previously found support and resistance levels, high and low values, the indicator determines the most accurate distribution of fibonacci levels.
Extremely convenient for use in Technical Analysis. You can define rise or fall correction levels by the specified levels.
◾️ How to use?
Blue levels - support. Red - resistance. If you hover over the pointer near the level, you can see detailed information.
As a rule, the price moves at the indicated levels. It lingers on them and tries to break through or find support.
◾️ What is useful for you?
You will be able to build your own analytics based on clear levels that ideally determine the potential for movement in the market.
LA_Periodic_Fibonacci LevelsThis indicator is used to plot the previous high and low of the chosen timeframe along with the Fibonacci levels of 0.50, +/- 0.618 and +/- 0.786.
Provision is given to plot levels for three different time frames at a time.
Options are given to select/unselect the levels as per the user requirement. For plotting the Fibonacci levels of a specific period, user has to select the option "TF1_Fib" or "TF2_Fib" or "TF3_Fib" along with the respective levels (50, +/- 0.618, +/- 0.786).
User has to add different time frames in their layout which can then be used in the drop down menu. By default, daily, weekly and monthly time frames are given.
Indicator is plotted as the candle progresses and not plotted for future time frames in advance.
Below are few examples on larger timeframes.
BTCUSD on 1 min TF (timeframe)
BTCUSD on Daily TF
DJI on Daily TF
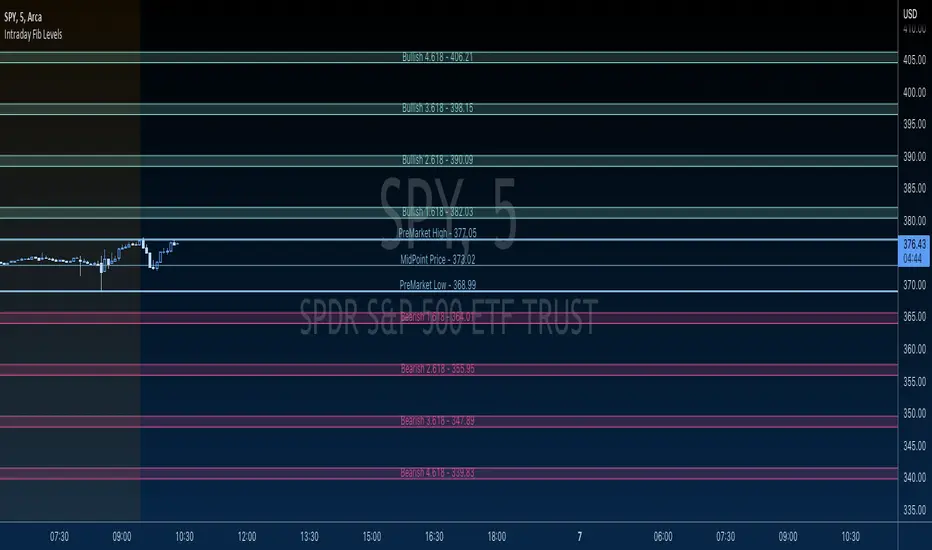
GBTT Premarket Fib ZonesOverview:
This is a daily pre market fib tool. Basically, it looks at your premarket price action and generates a set of fibs. From there, it cross references bearish vs bullish fibs, creates a bear and bull zone to watch for during the day. Finally it draws associated fib levels in each direction are plotted/shaded to represent possible price levels for the day.
The lines will redraw/update every day at open, 930 est and then be there on the chart all day until the following open. These zones are meant to be a reference point for the current trading day only.
Intended use:
To provide educational content about the short term movement of an asset. Can be used on any time frame. But remember, it updates at 930 at open for each day and is only applicable to the current trading day.
Disclaimer:
NOT intended to be a sole source of Technical Analysis or anything more than an educational tool!
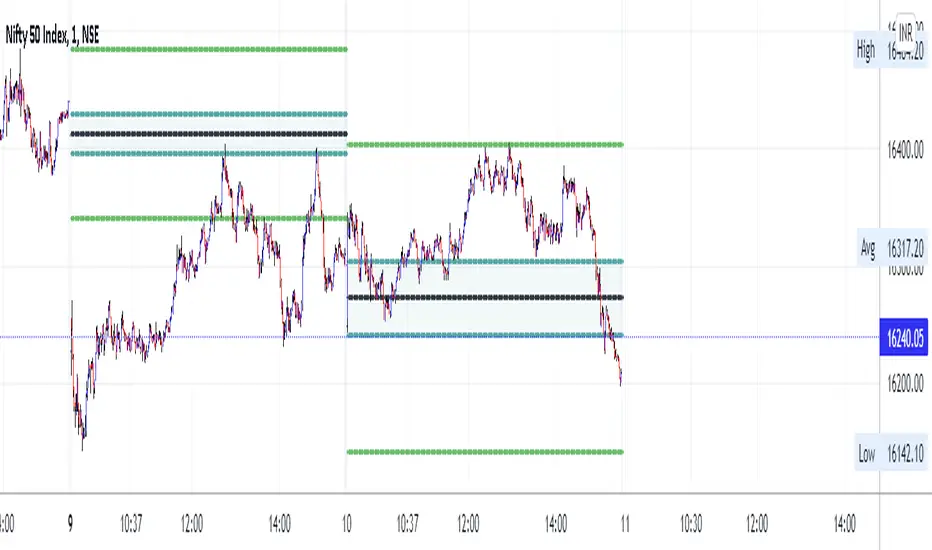
MTF previous high and low quarter levelsDescription
An experimental script that prints quarter levels of the previous timeframe's high and low to the current timeframe. The idea is quite simple and is basically the Fibonacci pivoted on the previous high and low with quarter level settings (0,0.25,0.5,0.75,1 etc). The default setting is the previous daily high and low but can be customized on user discretion.
New quarter levels are printed after the close of the previous timeframe and open of the new timeframe (user's timeframe setting)
How To Use
Levels should not be used blindly. Levels can be used as confluence when aligned with high probability supply and demand zones, support, resistance, order blocks, and so on.
Credit to @HeWhoMustNotBeNamed for the Previous High/Low MTF indicator code and @mrbirman for the idea to put this together.
