Zero Phase Filtering [Repaint] - ExperimentalImportant !
The indicator is for experimental purpose only, it must not be used as a decisional tool but only as a visual one (like Zig-Zag, Fractal etc). The information this indicator display is uncertain and subject to drastic changes over time. If you have further question feel free to pm me.
Introduction
Most of the filters you will find are causal, this mean that they depend on present and past input values, this explain the lag they produce. Non causal filters however will use future input values. A well know way to get a zero-phase filter is by using the forward backward method, but this is not possible in pinescript as i recall. So we have to use some kind of function that will display future values, this is possible using the security function in version 2 or the one in version 3 using barmerge.lookahead_on .
The Use Of A Repainting Indicator
Its always better to filter data in order to have a clearer view of what is happening, this can be useful when doing some forecasting or doing less formal kind of analysis. However since it repaint you cant use it as a signal provider or use signals of other indicators using this filter as source.
For example if you want to forecast a smooth indicator, the forecast of this indicator under normal circumstances could still have lag associated with it, so you would have to react before your forecast, this wont happen if you apply this filter as your indicator source.
The Filter
We smooth with a simple moving average the price provided by the security function twice, length control the smoothing level. Since security depend on the time frame you are in you must select your time frame in the indicator parameter selection window.
Filtering using 45 minutes time frame close price in a 5 minutes chart, we fix this by selecting our time frame.
Consider the fact that the input of the indicator is just periodic price, so sometimes the lag can sometimes be less or more than 0 and the estimation not centered.
The indicator can work on time frames up to 1h, after that the filter have some lag, i tried fixing this and i ended up having data errors.
Applying our filter as source for the rsi oscillator.
Conclusion
It is possible to have a kind of zero-phase filters, but it would be better if pinescript could support backward indexing thus making us able to do forward backward filtering.
Since noise can affect our analysis, applying smoothing without having to use offset in plot can be considered useful.
Filter

Simple LinesIntroduction
Making lines is great in technical analysis since it can highlights principal movements and make the analysis of the price easier when using certain methodologies (Elliott Waves, patterns).
However most of the indicators making lines (Zig-Zag, simple linear regression) are non causal (repaint), this is the challenge i tried to overcome, making an indicator capable of making lines in a smart way (able to follow price without loosing a linear approach) and with the least lag possible, i inspired myself from the behaviour of the renko when using a small brick size. This indicator does not repaint .
The code is short and i hope, understandable for all of you, making lines is not a difficult task and its important to know that when a problem appear complex it does not mean that the code used to solve this problem must be complex. Lets see the indicator in details.
The indicator
The indicator have 4 parameters, the length parameter who control the length of lines, the emphasis parameter who control the stability and also the ability to make lines closer to the price (thus minimizing the sum of squares) , the mult parameter which is similar to emphasis and a point option that we will discuss later.
When emphasis and mult are both equal to 1 the indicator will sometimes draw a perfect line, however this line will try to follow the price and thus can create a noisy result.
This is where emphasis and mult will correct this behaviour. The emphasis parameter give a more periodic look as well as some control to the lines but can also destroy them.
This should not happen with mult , this parameter also give more predictability to the lines. Overall it correct the drawbacks of the parameters combinations mentioned earlier.
Its also possible to mix both the emphasis and mult parameter, but take into account that when both are equals the result consist of less reactive lengthy lines with low accuracy. Its better to only use one of them and let the other stay to 1.
Point Option
The indicator can sometimes have a weird look, appearing almost flat or just dont appearing at all. When such thing happen use the point option.
XPDUSD without point option.
with point option :
Time Frame Problem and Its Fix
When using higher time-frames the result of the indicator can appear different, in general the higher the time frame the lengthier are the lines. In order to fix this you can use decimals in the length parameter
length and mult both equal to 5.5, emphasis cant use decimals.
Conclusion
I have highlighted a simple way to make use of the small renko box size method in order to return reactive lines without making the indicator repaint. However Its ability to be close to the price as well as being always super reactive is not a guarantee.
For any suggestion/help feel free to pm me, i would be happy to help you :)

TrendFilter by Trendline365This is our first indicator here.
The TrendFilter works like a filter to find main trends.
The TrendFilter does not provider entry points.
Just use for see main trends.
Setup:
Uptrend = Green.
Downtred = Red.
side trend = Yellow.
Any features? Comment bellow.

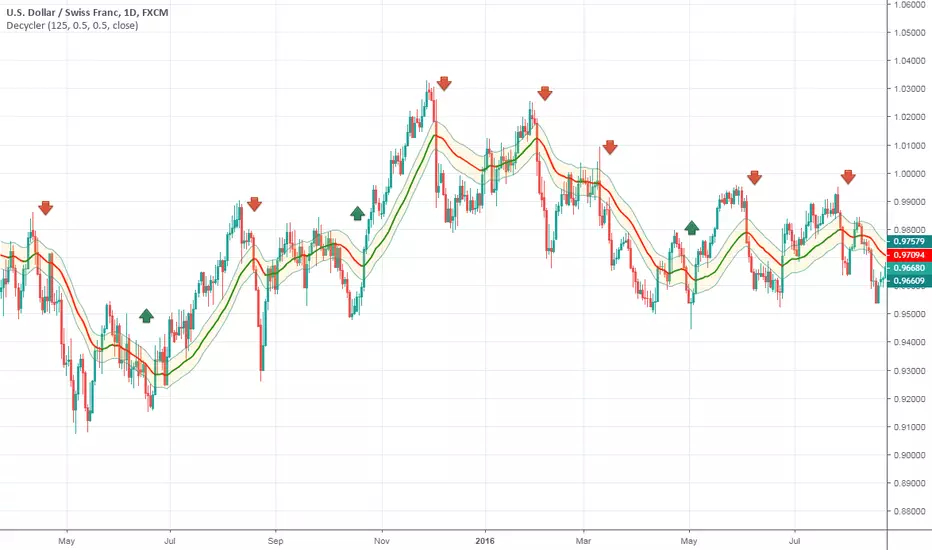
Ehlers Decycler OscillatorThis indicator was originally developed by John F. Ehlers (Stocks & Commodities , V.33:10 (September, 2015): "Decyclers").
The idea is still the same as for the Simple Decycler.
Mr. Ehlers suggested to virtually eliminate lag by getting rid of the very low-frequency components. So, he applied the high-pass filter to the simple decycler.
Mr. Ehlers recommended to use two instances of the Decycler Oscillator with different parameters (high-pass filter period and multiplier). As a result, he got the Decycler Oscillator pair.
The first oscillator (red line) has a period of 125 bars, the second one (yellow line) has a period of 100 bars.
The interpretation is straightforward:
When the yellow line crosses over the red line, a trend reversal to the upside is indicated.
When the yellow line crosses under the red line, a trend reversal to the downside is indicated.

Ehlers Simple DecyclerThis indicator was originally developed by John F. Ehlers (Stocks & Commodities, V.33:10 (September, 2015): "Decyclers").
Mr. Ehlers suggested a way to improve trend identification using high-pass filters. The basic smoothers like SMA, low-pass filters, have considerable lag in their display. Mr. Ehlers applied the high-pass filter and subtracted the high-pass filter output from the time series input. Doing these steps he removed high-frequency short-wavelength components (the ones causing the wiggles) from the time series.
As a result he got a special series of the low-frequency components with virtually no lag - the Decycler.
The Decycler is plotted with two additional lines (the percent-shifts of Decycler) and together they form a hysteresis band.
If the prices are above the upper hysteresis line, then the market is in an uptrend . If the prices are below the low hysteresis line, then the market is in a downtrend . Prices within the hysteresis band are trend-neutral .
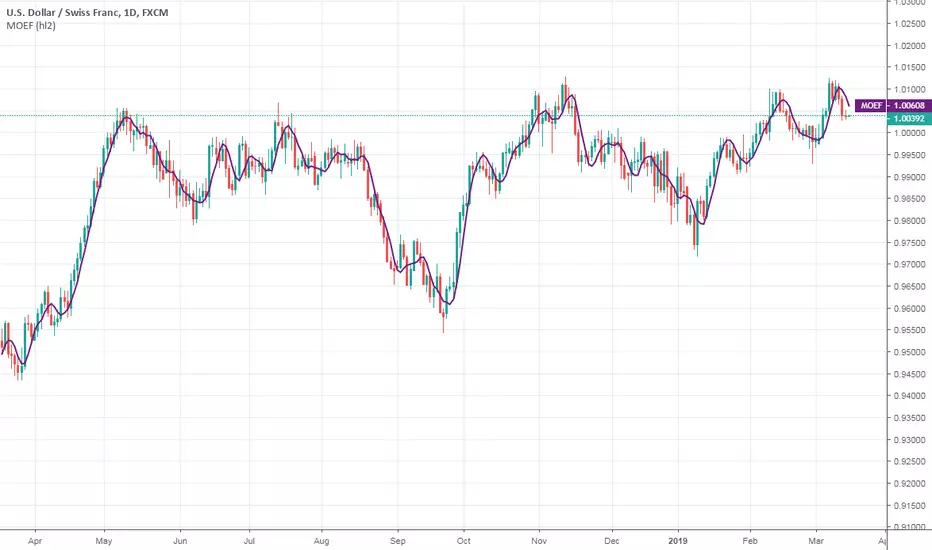
Ehlers Modified Optimum Elliptic FilterThis indicator was originally developed by John F. Ehlers (Stocks & Commodities, V.18:7 (July, 2000): "Optimal Detrending").
Mr. Ehlers didn't stop and improved his Optimum Elliptic Filter. To reduce the effects of lag he added the one day momentum of the price to the price value.
This modification produce a better response.
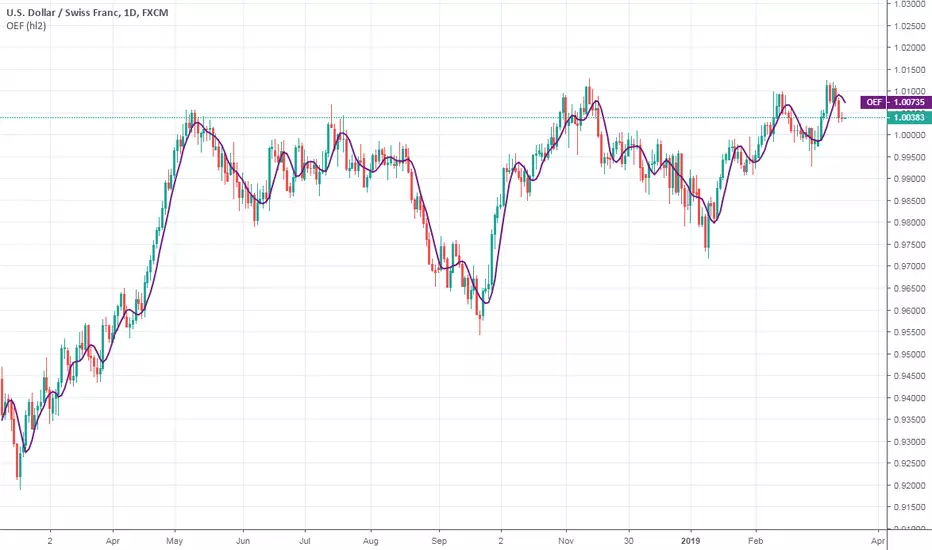
Ehlers Optimum Elliptic FilterThis indicator was originally developed by John F. Ehlers (Stocks & Commodities, V.18:7 (July, 2000): "Optimal Detrending").
Mr. Ehlers worked on the smoother that could have no more than a one-bar lag. An elliptic filter provides the maximum amount of smoothing under the constraint of a given lag.
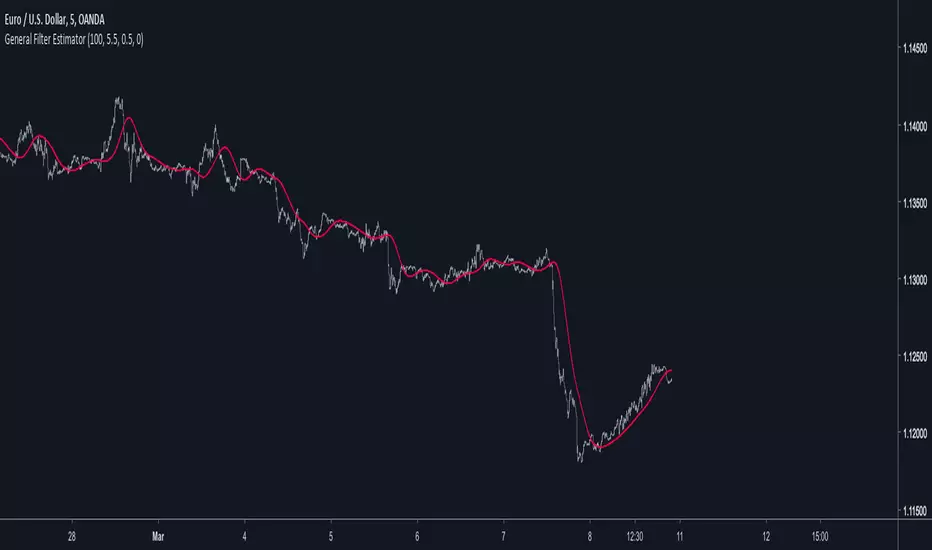
General Filter Estimator-An Experiment on Estimating EverythingIntroduction
The last indicators i posted where about estimating the least squares moving average, the task of estimating a filter is a funny one because its always a challenge and it require to be really creative. After the last publication of the 1LC-LSMA , who estimate the lsma with 1 line of code and only 3 functions i felt like i could maybe make something more flexible and less complex with the ability to approximate any filter output. Its possible, but the methods to do so are not something that pinescript can do, we have to use another base for our estimation using coefficients, so i inspired myself from the alpha-beta filter and i started writing the code.
Calculation and The Estimation Coefficients
Simplicity is the key word, its also my signature style, if i want something good it should be simple enough, so my code look like that :
p = length/beta
a = close - nz(b ,close)
b = nz(b ,close) + a/p*gamma
3 line, 2 function, its a good start, we could put everything in one line of code but its easier to see it this way. length control the smoothing amount of the filter, for any filter f(Period) Period should be equal to length and f(Period) = p , it would be inconvenient to have to use a different length period than the one used in the filter we want to estimate (imagine our estimation with length = 50 estimating an ema with period = 100) , this is where the first coefficients beta will be useful, it will allow us to leave length as it is. In general beta will be greater than 1, the greater it will be the less lag the filter will have, this coefficient will be useful to estimate low lagging filters, gamma however is the coefficient who will estimate lagging filters, in general it will range around .
We can get loose easily with those coefficients estimation but i will leave a coefficients table in the code for estimating popular filters, and some comparison below.
Estimating a Simple Moving Average
Of course, the boxcar filter, the running mean, the simple moving average, its an easy filter to use and calculate.
For an SMA use the following coefficients :
beta = 2
gamma = 0.5
Our filter is in red and the moving average in white with both length at 50 (This goes for every comparison we will do)
Its a bit imprecise but its a simple moving average, not the most interesting thing to estimate.
Estimating an Exponential Moving Average
The ema is a great filter because its length times more computing efficient than a simple moving average. For the EMA use the following coefficients :
beta = 3
gamma = 0.4
N.B : The EMA is rougher than the SMA, so it filter less, this is why its faster and closer to the price
Estimating The Hull Moving Average
Its a good filter for technical analysis with tons of use, lets try to estimate it ! For the HMA use the following coefficients :
beta = 4
gamma = 0.85
Looks ok, of course if you find better coefficients i will test them and actualize the coefficient table, i will also put a thank message.
Estimating a LSMA
Of course i was gonna estimate it, but this time this estimation does not have anything a lsma have, no moving average, no standard deviation, no correlation coefficient, lets do it.
For the LSMA use the following coefficients :
beta = 3.5
gamma = 0.9
Its far from being the best estimation, but its more efficient than any other i previously made.
Estimating the Quadratic Least Square Moving Average
I doubted about this one but it can be approximated as well. For the QLSMA use the following coefficients :
beta = 5.25
gamma = 1
Another ok estimate, the estimate filter a bit more than needed but its ok.
Jurik Moving Average
Its far from being a filter that i like and its a bit old. For the comparison i will use the JMA provided by @everget described in this article : c.mql5.com
For the JMA use the following coefficients :
for phase = 0
beta = pow*2 (pow is a parameter in the Jma)
gamma = 0.5
Here length = 50, phase = 0, pow = 5 so beta = 10
Looks pretty good considering the fact that the Jma use an adaptive architecture.
Discussion
I let you the task to judge if the estimation is good or not, my motivation was to estimate such filters using the less amount of calculations as possible, in itself i think that the code is quite elegant like all the codes of IIR filters (IIR Filters = Infinite Impulse Response : Filters using recursion) .
It could be possible to have a better estimate of the coefficients using optimization methods like the gradient descent. This is not feasible in pinescript but i could think about it using python or R.
Coefficients should be dependant of length but this would lead to a massive work, the variation of the estimation using fixed coefficients when using different length periods is just ok if we can allow some errors of precision.
I dont think it should be possible to estimate adaptive filter relying a lot on their adaptive parameter/smoothing constant except by making our coefficients adaptive (gamma could be)
So at the end ? What make a filter truly unique ? From my point of sight the architecture of a filter and the problem he is trying to solve is what make him unique rather than its output result. If you become a signal, hide yourself into noise, then look at the filters trying to find you, what a challenging game, this is why we need filters.
Conclusion
I wanted to give a simple filter estimator relying on two coefficients in order to estimate both lagging and low-lagging filters. I will try to give more precise estimate and update the indicator with new coefficients.
Thanks for reading !
1LC-LSMA (1 line code lsma with 3 functions)Even Shorter Estimation
I know that i'am insistent with the lsma but i really like it and i'm happy to deconstruct it like a mad pinescript user. But if you have an idea about some kind of indicator then dont hesitate to contact me, i would be happy to help you if its feasible.
My motivation for such indicator was to use back the correlation function (that i had putted aside in the ligh-lsma code) and provide a shorter code than the estimation using the line rescaling method (see : Approximating A Least Square Moving Average In Pine) .
The Method
Fairly simple, lets name y our estimation, we calculate it as follow:
y = x̄ + r*o*1.7
where x̄ is the price moving average, r the correlation between the price and a line (or n) and o the standard deviation. If plotted against a classic lsma the difference would be meaningless at first glance so lets plot the absolute value between the difference of the lsma and our estimation of both period 100.
The difference is under 0.0000 on eurusd, its really low.
In general the longer the period of the estimation, the lower the difference between a normal lsma, but when using shorter period they can differ a little bit.
Why 1.7 ?
We need to multiply the standard deviation by a constant in order to match the overshoot and the rise-time of the original lsma. The constant 1.7 is one that work well but actually this constant should be dependant of the length period of the filter to make the estimation more accurate.
More About Step-Response
Most of the time when a filter have less lag, it mean that he induce overshoot in order to decrease the rise-time . Rise-time is the time the output take to match the target input, its related to the lag. Overshoot mean that the output exceed the target input, you can clearly see those concept in the image above.
Conclusion
I've showed that its possible to be even more concise about the code it take to estimate an lsma. I've also briefly explained the concept of rise-time and overshoot, concepts really important to signal processing and particularly in filter design. I'm sure that it can be even more simplified and i have some ideas for such estimate.
Thanks for reading !

Bandpass Filter v2Attempts to detect trends based on detrended cycles, instead of momentum or price action!
If you enable bar painting, then uptrends will be painted in lime green, then dark green to signify the cycle is ending.
Downtrends will be painted in bright red, then maroon to signify the cycle is ending.
Reducing fast limit will allow the indicator to respond much faster to cycle changes, but may cause more weak signals.
Increasing slow limit will "hold on to" cycles for a longer time & allow trends to extend through small periods of consolidation.
Tweak these settings to your style of trading!
Good settings for scalping:
14, 35
Good settings for intraday:
30, 60
40, 80
Good settings for swing trades:
20, 200 (gets into trade earlier)
50, 120
Ultimately, you'll have to decide the best limits for each security.
Cheers,
DasanC

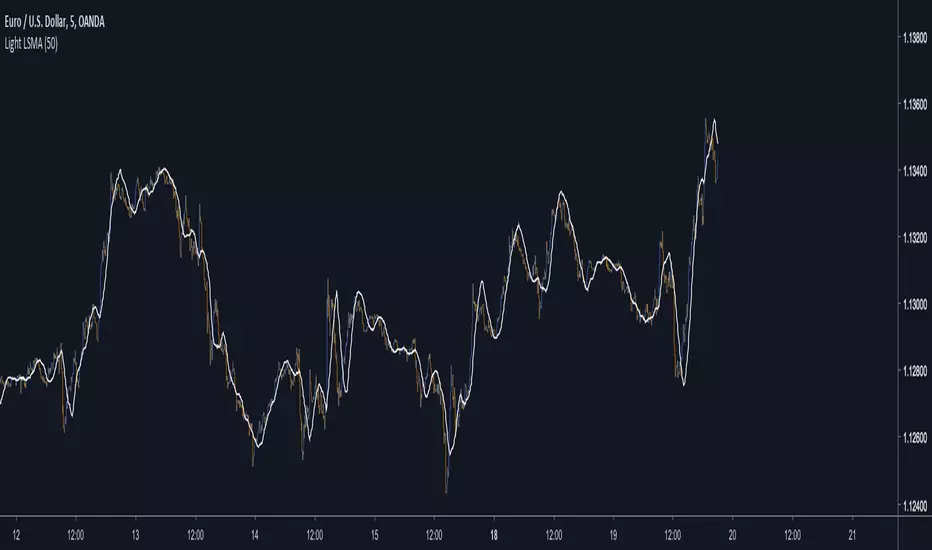
Light LSMAEstimating the LSMA Without Classics Parameters
I already mentioned various methods in order to estimate the LSMA in the idea i published. The parameter who still appeared on both the previous estimation and the classic LSMA was the sample correlation coefficient. This indicator will use an estimate of the correlation coefficient using the standard score thus providing a totally different approach in the estimation of the LSMA. My motivation for such indicator was to provide a different way to estimate a LSMA.
Standardization
The standard score is a statistical tool used to measure at how many standard deviations o a data point is bellow or above its mean. It can also be used to rescale variables, this conversion process is called standardizing or normalizing and it will be the basis of our estimation.
Calculation : (x - x̄)/o where x̄ is the moving average of x and o the standard deviation.
Estimating the Correlation Coefficient
We will use standardization to estimate the correlation coefficient r . 1 > r > -1 so in (y - x̄)/o we want to find y such that y is always above or below 1 standard deviation of x̄ , i had for first idea to pass the price through a band-stop filter but i found it was better to just use a moving average of period/2 .
Estimating the LSMA
We finally rescale a line through the price like mentioned in my previous idea, for that we standardize a line and we multiply the result by our correlation estimation, next we multiply the previous calculation by the price standard deviation, then we sum this calculation to the price moving average.
Comparison of our estimate in white with a LSMA in red with both period 50 :
Working With Different Independents Variables
Here the independent variable is a line n (which represent the number of data point and thus create a straight line) but a classic LSMA can work with other independent variables, for exemple if a LSMA use the volume as independent variable we need to change our correlation estimate with (ȳ - x̄)/ô where ȳ is the moving average of period length/2 of y, y is equal to : change(close,length)*change(volume,length) , x̄ is the moving average of y of period length , and ô is the standard deviation of y. This is quite rudimentary and if our goal is to provide a easier way to calculate correlation then the product-moment correlation coefficient would be more adapted (but less reactive than the sample correlation) .
Conclusion
I showed a way to estimate the correlation coefficient, of course some tweaking could provide a better estimate but i find the result still quite close to the LSMA.
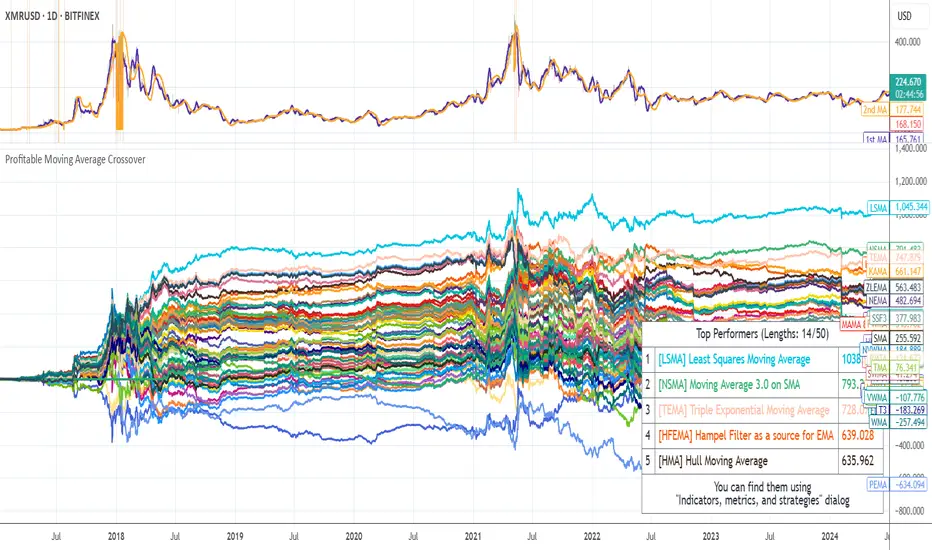
Profitable Moving Average CrossoverHello friends,
I'm glad to introduce a powerful research and optimization tool that takes the classic moving average crossover concept to a new level. Instead of relying on guesswork or fixed MA types, it lets you objectively discover the most profitable moving average pair for any instrument and timeframe.
🛠 How It Works
Moving average crossovers are among the most popular trading systems. A buy signal occurs when a shorter (faster) moving average crosses above a longer (slower) one, and a sell signal when it crosses below. The system's responsiveness — and the number of generated signals — depend on the chosen MA lengths and types.
This script evaluates 61 moving average types (including Jurik, Kaufman, Ehlers, Apirine, and others) and backtests all possible crossover combinations either across the entire chart history or within a custom backtest window . It then plots continuous profit metric lines for each crossover type and displays the top 5 performers in a results table. Each MA type is color-coded, allowing quick visual identification of which systems have historically delivered the strongest results.
🔥 Key Features
Pine Script V6 — optimized for performance and stability
Tests 61 moving average types , from classic to adaptive designs
Custom Backtest Window — analyze the entire history or a specific date range
Continuous profit curves for every crossover type plotted on chart
Top 5 crossover systems displayed in a compact summary table
Color-coded MA identifiers for fast visual comparison
Supports custom parameters for advanced MAs (JMA, ALMA, McGinley Dynamic, Adaptive Laguerre Filter, etc.)
Works seamlessly across all assets and timeframes
NOTE: Results will vary across different tickers and timeframes. Seeing strong performance in one preview does not imply similar profitability elsewhere — this variability is normal due to differing market structures.
NOTE 2: You can experiment with the tool independently or request a full study, in which case I'll share a spreadsheet of all backtest results with you.
👋 Good luck and happy trading!
Script a pagamento
Jurik Moving AverageThis is my best attempt to reproduce the original Jurik Moving Average. It differs from Jurik's a little bit, but in most cases it behaves like the original.
Jurik Moving Average is known as a superior noise elimination (causal, nonlinear and adaptive) filter and a world class moving average that tracks and smoothes price charts or any market-related time series with surprising agility.
Settings
Length (default: 7 )
Phase (default: 50 )
Price Source (default: close )
I attached some screenshots to show you how it works with other instruments
USDJPY, D
USDJPY, 60
USDCAD, D
USDCHF, D
EURUSD, D
GBPJPY, D
AUDUSD, D
XAUUSD, D
XAUUSD, 60
AAPL, D
AAPL, 60
MSFT, D
AMZN, D
BTCUSD, D
BTCUSD, 60
ETHUSD, D
Good luck and happy trading!

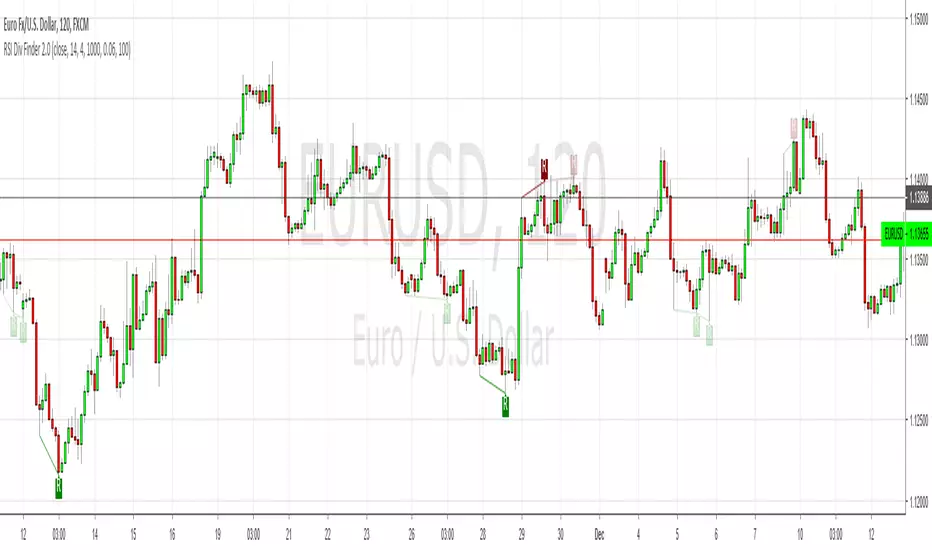
Filtered RSI Divergence Finder Check the settings to see how the filters work. I added alerts and a feature that shows the divergences that have been filtered, but as faded "ghost" divergences. Spooooky. This is useful for tuning the script to a particular market. All credit to RicardoSantos for the original.
Repulsion Moving Average - Least Crosses MAA Moving Average With Less Whipsaws Signals
The cross of the price with a moving average is one of the easiest strategy in technical analysis and could have worked if market price wasn't so noisy (In general periods of 1 to 20 produces the most whipsaws) . So it is possible to create a moving average who can manage to escape those noisy periods and produce 0 whipsaws ?
This question was asked by one of my work colleagues and i responded : "well... almost 0".
The Motion Of A Moving Average
Moving Average estimate the Trend and will always have phase shift, they will still follow the price and cross it during high volatility or low volatility periods, and when a moving average cross the price during a low volatility period you can expect lot of crosses.
In order to fix this behaviour a simple calculation exist :
FixMa = LongPeriodMA + MediumPeriodMA - ShortPeriodMA
We can see things in that way, the medium term MA is high pass filtered (subtracted) with a short term MA and the result is summed to a long term MA. We give more reactivity to our long term MA and thus creating some kind of repulsion motion with the price. Of course this can sometimes make the filter kinda zero-lag to some price periods (when the long term MA is near the price) .
Comparison
In red a simple moving average of period 100 and in blue our repulsion moving average :
In the image the short term moving average period is 100, since the long term period of the moving average is equal to short term x 3 you could be interested to look at the comparison of our moving average with the actual long term moving average :
Less crosses, i think you can see it.
Something to notice is that its always a tradeoff between Signal Speed and Signal Numbers , a classic moving average create faster signals but also a high numbers of them, a classic trailing stop create less signals but slowest ones, our moving average is some kind of average between those indicators.
Improvement Methods - Choice of The Filter/More Terms
A bad behaviour of our filter can be fixed by using filters who tend to create less crosses with the price or by developing the formula of our filter by adding more terms as follow :
fixma = ma(Price,a) + ma(Price,b) + ma(Price,c) - ma(Price,d) - ma(Price,e)
where a > b > c > d > e . The number of subtractive terms is equal to the number of summing terms - 1.
Way To Use
This indicator can be used like any moving average with cross strategy. Can also be used as a trailing stop.
No tests have been made proving that this indicator provide support and resistance levels, such signals come from more centered indicators.
Hope you enjoy
For any questions/demands feel free to pm me, i would be happy to help you :)

Adaptive StochasticAdapt To The Right Situation
There are already some Adaptive Stochastic scripts out there, but i didn't see the concept of using different periods highest/lowest for their calculations. What we want
for such oscillator is to be active when price is trending and silent during range periods. Like that the information we will see will be clear and easy to use.
Switching between a long term highest/lowest during range periods and a short term highest/lowest during trending periods is what will create the adaptive stochastic.
The switching is made thanks to the Efficiency Ratio , the period of the efficiency ratio is determined by the length parameter.
The period of the highest and lowest will depend on the slow and fast parameters, if our efficiency ratio is close to one (trending market) then the indicator will use highest and lowest of period fast , making the indicator more reactive, if our efficiency ratio is low (ranging market) then the indicator will use highest and lowest of period slow , making the indicator less reactive.
The source of the indicator is a running line ( lsma ) of period slow-fast .
it is also possible to switch the parameters values, making the indicator reactive during ranging market and less reactive during trending ones.
Hope you enjoy
For any questions/demands feel free to pm me, i would be happy to help you

Retention-Acceleration FilterAnother Adaptive Filter
This indicator share the same structure as a classic adaptive filter using an exponential window with a smoothing constant.
However the smoothing constant used is different than any previously made (Kalman Gain, Efficiency ratio, Scaled Fractal Dimension Index) ,
here the smoothing constant is inspired by the different formulations for parameters resolution used in HPLC S. Said (J. High Resolution Chromatograpy &Chromatography Communciations, (1979) 193).
Different assumptions can be made which lead to different expressions for resolution in chromatographic parameters, therefore we will use highest's and lowest's in order to estimate an optimal smoothing constant based on if the market is trending or not. It can be complicated at first but the goal is to provide both smoothness at the right time and a fast estimation of the market center.
Handling Noise
In Red a Pure Sinewave. In White Sinewave + Noise. In Blue our filter of Period 3
Handling stationary signals is not the best thing to do since we need highest's and lowest's and for that non stationary signals with trend + cycle + noise are more suitable.
It is also possible to make it act faster by quiting the pow() function of AltK with sqrt(length) and smoothing the remaining constant.

[Long/Short] Range Filter-ADXIt's a useful script for pairs where you can operate long and short.
It's a combination algorithm of the Range filter and the ADX.
The ADX helps to make the decision to enter to open long or short position.
LG --> Long
xL --> Close Long position
ST --> Short
xS --> close Short Position
Enjoy!!!

🚀Ehler's RocketRSI by Cryptorhythms🚀Ehler's RocketRSI by Cryptorhythms
This indicator does require some tinkering in cases to line up the waveforms. Here on the 4Hr I have used an RSI LB of 14 and SSF LB of 10.
Personally I find its better at picking short entries when the indicator is topping out. For bottoms it a bit less effective.
I do not use this indicator by itself, but rather as another tool when looking for short entries.
Description
The RocketRSI is an indicator that combines the approach used in the calculation of the Relative Strength Index (RSI) with some principles of signal processing and was developed by John Ehler. By smoothing out noisy price data and singling out a cyclic component within it, the indicator can be used for analysis of cyclic reversals, which could potentially signal trading
opportunities.
The calculation of the RocketRSI is as follows:
A close price change (momentum) from a past value is found for each bar. The offset between the current and the past price is constant.
The values found are run through Ehler
s 3-Pole SuperSmootherFilter to eliminate the noise.
The algebraic sum of one-bar changes in the filtered values is divided by the sum of absolute values of the same changes. The output of this step is limited to be in the range from -0.999 to +0.999.
The result is run through the Fisher transform to provide a easily interpreted wave-like output.
If there is a dominant cycle in the input data and the lengths are set correctly, the analysis of peaks and troughs of the output wave may provide valuable sell and buy signals.
👍Enjoying this indicator or find it useful? Please give me a like and follow! I post crypto analysis, price action strategies and free indicators regularly.
💬Questions? Comments? Want to get access to an entire suite of proven trading indicators? Come visit us on telegram and chat, or just soak up some knowledge. We make timely posts about the market, news, and strategy everyday. Our community isnt open only to subscribers - everyone is welcome to join.

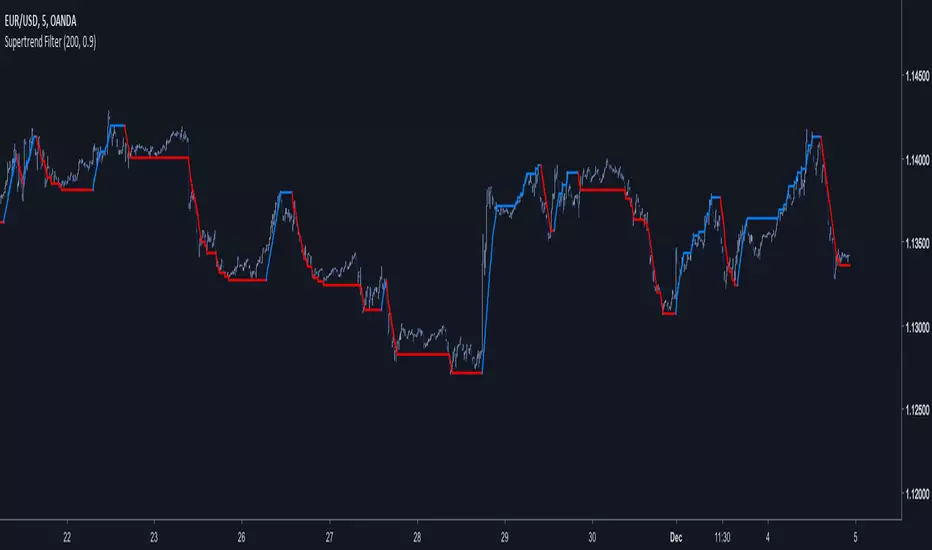
Supertrend FilterA derivation of the famous SuperTrend indicator.
My motivation for such indicator was to use more recursion in the original SuperTrend code, this work was made quite fast but feel free to modify it, as always my work is more for inspirational use than anything else so i hope it will inspire you to get more involved with the SuperTrend code or to start coding with Pine.
The indicator no longer act as a trailing-stop but more like a filter, this is due to the fact that the indicator conditions are swapped and that the output is reused many times in the calculation.
Parameters change as well and involve particular gestion. The Factor Parameter is no longer an integer but decimals such that 0 < Factor < 1 .
When the Period is high the indicator tend to become less linear/static and look more like a classic moving average.So it is important to have higher Factor values when the Period is high and reciprocally.Here a table to help you with parameters settings :
for Period = 1 to 50 Factor = 0.5
for Period = 50 to 100 Factor = 0.6
for Period = 100 to 150 Factor = 0.7
for Period = 150 to 200 Factor = 0.8
for Period = 200 to 300 Factor = 0.9
There could be a formula to scale the Factor depending on the Period but there would be no proof that the scaling method used is optimal.
Hope you enjoy
For any questions/demands feel free to pm me, i would be happy to help you
[ALERTS] Range Filter"This is an experimental study designed to filter out minor price action for a clearer view of trends.
Inspired by the QQE's volatility filter, this filter applies the process directly to price rather than to a smoothed RSI .
First, a smooth average price range is calculated for the basis of the filter and multiplied by a specified amount.
Next, the filter is calculated by gating price movements that do not exceed the specified range.
Lastly the target ranges are plotted to display the prices that will trigger filter movement.
Custom bar colors are included. The color scheme is based on the filtered price trend."
Thanks to Donovan Wall...
Enjoy!

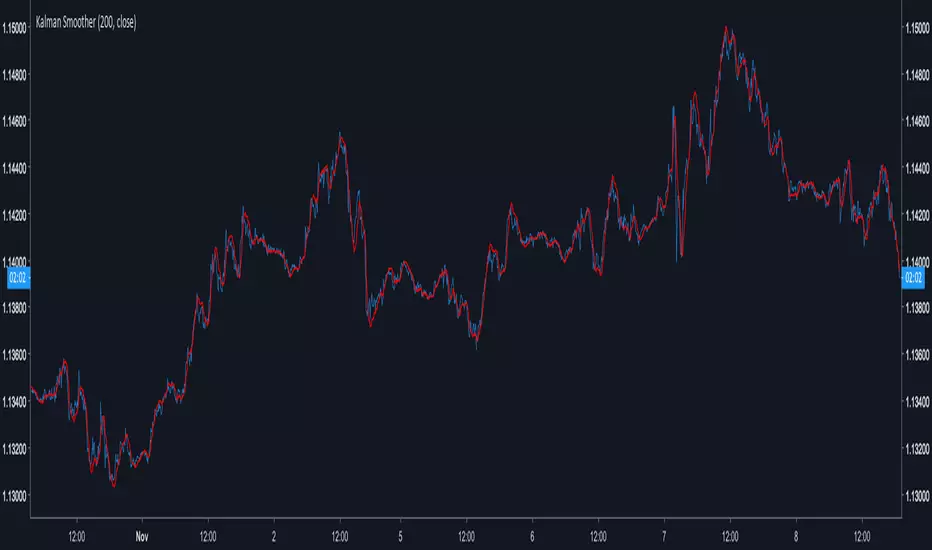
Kalman SmootherA derivation of the Kalman Filter.
Lower Gain values create smoother results.The ratio Smoothing/Lag is similar to any Low Lagging Filters.
The Gain parameter can be decimal numbers.
Kalman Smoothing With Gain = 20
For any questions/suggestions feel free to contact me
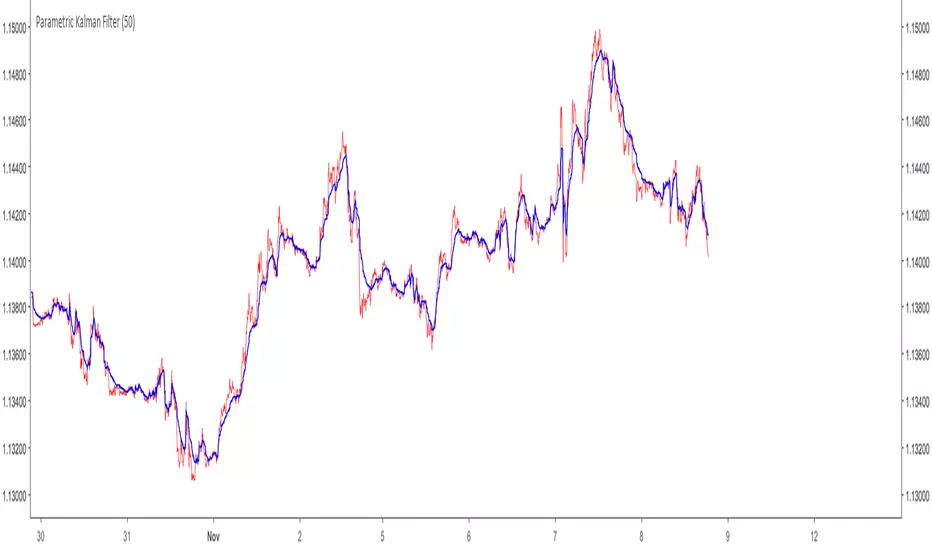
One Dimensional Parametric Kalman FilterA One Dimensional Kalman Filter, the particularity of Kalman Filtering is the constant recalculation of the Error between the measurements and the estimate.This version is modified to allow more/less filtering using an alternative calculation of the error measurement.
Camparison of the Kalman filter Red with a moving average Black of both period 50
Can be used as source for others indicators such as stochastic/rsi/moving averages...etc
For any questions/suggestions feel free to contact me