Intraday SeasonalityDay trading trend filter indicator designed to hep get better entries or exits based on historical opens and closes each hour.
This indicator is NOT designed as an entry or exit signal. The purpose behind it is to give you statistical information about how likely certain times of day are either bullish, bearish or neutral and use that to confirm or reject other trading signals.
For example you might be anticipating a breakout based on your strategy or another indicator but see that the next few hours are usually bearish and re-evaluate entering the trade.
The Intraday Seasonality indicator calculates the percentage of candles per hour that had a higher close than open.
Default settings are:
- a look-back of 90 days.
- extreme bullish (bright green) above 74%
-extreme bearish (bright red) below 25%
- bullish (green) above 55%
- bearish (red) below 45%
- neutral (white) exactly 50%
- no trend (gray) 46% - 54%
All of these are updatable via the settings.
This indicator is designed to work only on the 1 hour timeframe.
To use the indicator set your local timezone offset in the indicator settings.
*Due to daylight savings and certain timezones changing throughout the year there is a timezone override in the indicator settings if the indicator doesn't pick up the correct local time.
Filter

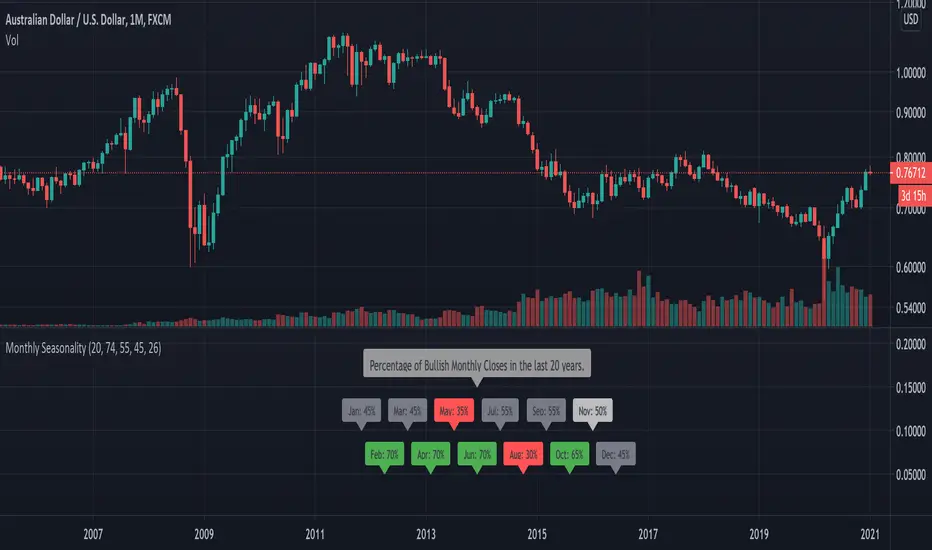
Monthly SeasonalitySimple indicator designed as filter so you can easily see how the currency or asset performed during each month historically.
Can used to identify a possible month to enter or exit a trade in. For best results use in combination with another indicator or candle pattern to signal an entry in a historically bullish month
*This indicator is designed to be used only on the monthly chart.
Bandpass Filters v.02
This is an alternative way to do bandpass filtering. I Still need to update it to support moveable frequency bands. The lowBandpass() is just a 'trick,' as it simply subtracts the highBandpass() from the close data, so it is not really accurate in that it removes the low frequencies, just in a rather less-than-ideal manner.
The "spectrum" of the dataset to filter will always be from 0 to 100, so think of filter boundary as %. So, a boundary of 40% means: 40% of the low-frequencies have been removed from the original data to make the red graph, and 40% of the high-frequencies have been removed from the original data to make the green graph.
This came about after reading the excellent tutorial on signal processing in Pine Script (www.pinecoders.com), as the techniques listed there did not do exactly what I was looking for.
Here is a low-pass graph
Here is a hi-pass graph

[FTA] Double Responsive Price FilterThis is a very special indicator which uses a series of double filtering methods to filter out bad price data.
Each filter uses a very complex mathematical formula to obtain the data, based on the Wave Function, then applies initial signal filtering on the output.
The output of each filter is then compared to each other, and the output of this stage goes through another signal filtering process which is used in aviation industry (NASA) to track objects and keep them under radar!
The final output is then squeezed through a truncated bandpass filter and plotted as two colors.
This is to ensure a very quick and responsive entry and exit signal without any lagging, and also to ensure that the trader stays in the trade as long as profitable!
Buy when color is aqua.
Sell when color is fuchsia.

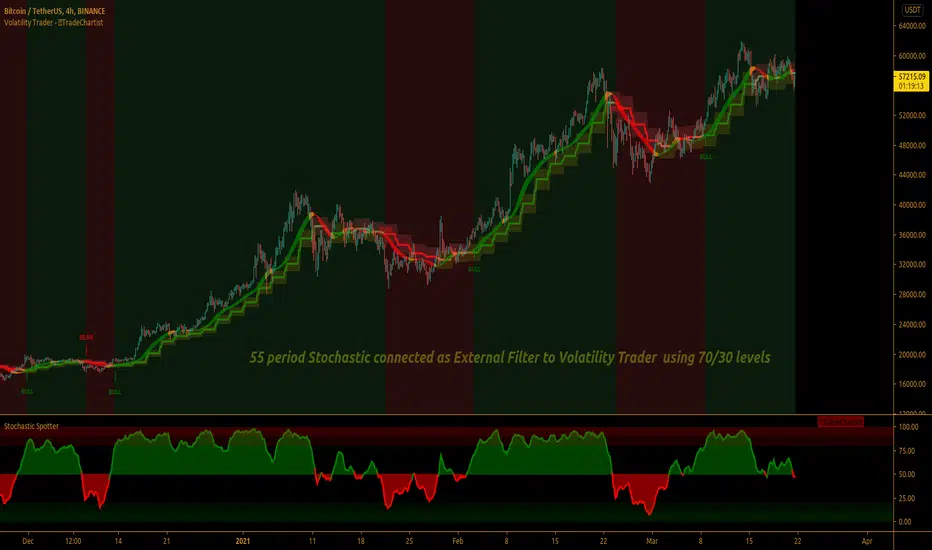
TradeChartist Volatility Trader ™TradeChartist Volatility Trader is a Price Volatility based Trend indicator that uses simple to visualize Volatility steps and a Volatility Ribbon to trade volatility breakouts and price action based on lookback length.
===================================================================================================================
Features of ™TradeChartist Volatility Trader
======================================
The Volatility steps consists of an Upper band, a Lower band and a Mean price line that are used for detecting the breakouts and also used in plotting the Volatility Ribbon based on the price action. The Mean Line is colour coded based on Bull/Bear Volatility and exhaustion based on Price action trend.
In addition to the system of Volatility Steps and Volatility Ribbon, ™TradeChartist Volatility Trader also plots Bull and Bear zones based on high probability volatility breakouts and divides the chart into Bull and Bear trade zones.
Use of External Filter is also possible by connecting an Oscillatory (like RSI, MACD, Stoch or any Oscillator) or a non-Oscillatory (Moving Average, Supertrend, any price scale based plots) Signal to confirm the Bull and Bear Trade zones. When the indicator detects the Volatility breakouts, it also checks if the connected external signal agrees with the trend before generating the Bull/Bear entries and plotting the trade zones.
Alerts can be created for Long and Short entries using Once per bar close .
===================================================================================================================
Note:
Higher the lookback length, higher the Risk/Reward from the trade zones.
This indicator does not repaint , but on the alert creation, a potential repaint warning would appear as the script uses security function. Users need not worry as this is normal on scripts that employs security functions. For trust and confidence using the indicator, users can do bar replay to check the plots/trade entries time stamps to make sure the plots and entries stay in the same place.
™TradeChartist Volatility Trader can be connected to ™TradeChartist Plug and Trade to generate Trade Entries, Targets etc by connecting Volatility Trader's Trend Identifier as Oscillatory Signal to Plug and Trade.
===================================================================================================================
Best Practice: Test with different settings first using Paper Trades before trading with real money
===================================================================================================================
This is not a free to use indicator. Get in touch with me (PM me directly if you would like trial access to test the indicator)
Premium Scripts - Trial access and Information
Trial access offered on all Premium scripts.
PM me directly to request trial access to the scripts or for more information.
===================================================================================================================
TradeChartist Donchian Channels Breakout Strategy™TradeChartist Donchian Channels Breakout Strategy is the strategy backtester version of ™TradeChartist Donchian Channels Breakout Filter .
===================================================================================================================
Features of ™TradeChartist Donchian Channels Breakout Strategy
========================================================
Option to plot Donchian Channels of user preferred length, based on the Source price in addition to High/Low Donchian Channels.
Generates trade entries based on user preferred Breakout Price. For example, if the user prefers HL2 as breakout price, irrespective of the Donchian Channels type, trade entries are generated only when hl2 price (average of high/low) breaks out of the upper or lower band.
Option to plot background colour based on Breakout trend. The bull zones are filled with green background, the Bear zones are filled with red background and the bar that broke out is filled with orange background.
Option to colour price bars using Donchian Channels price trend. The Donchian Channels basis line is plotted using the same colours as coloured bars as default.
Note: This script does not repaint. To use the script for trade entries, wait for the bar close without Backtester or Strategy entries (with Backtester) and use a second confirmator (includes fundamentals) based on asset type as some markets require users to have good pulse on the fundamentals as trading by Technicals/price action dynamic alone may not be safe.
Note: Trend Based Stochastic of the same DC Length can be used from ™TradeChartist Risk Meter for Trade Confirmations too.
===================================================================================================================
Best Practice: Test with different settings first using Paper Trades before trading with real money
===================================================================================================================
This is not a free to use strategy. Get in touch with me (PM me directly if you would like trial access to test the strategy)
Premium Scripts - Trial access and Information
Trial access offered on all Premium scripts.
PM me directly to request trial access to the scripts or for more information.
===================================================================================================================

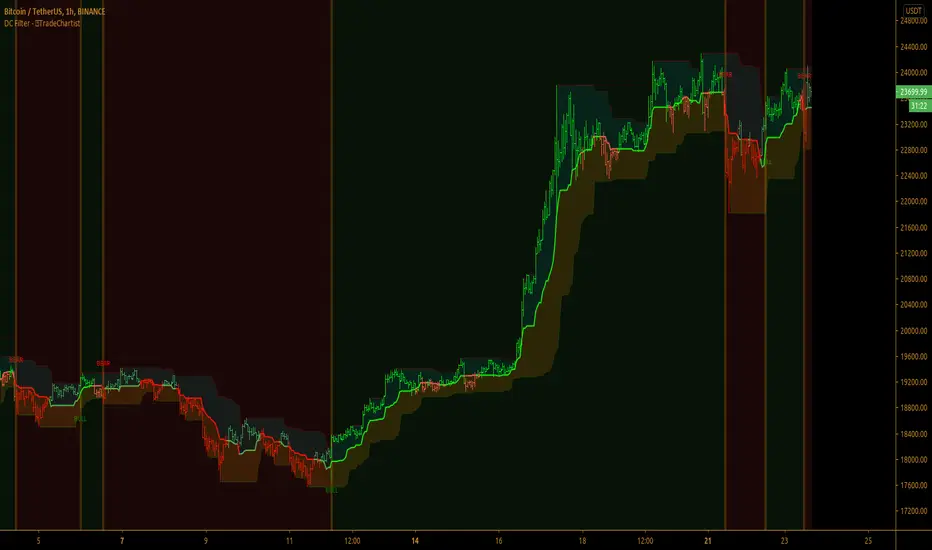
TradeChartist Donchian Channels Breakout Filter™TradeChartist Donchian Channels Breakout Filter is an elegant version of the classic Donchian Channels with few extra variations and option to filter breakouts based on user preferred Breakout price selection to generate Trade Entries.
===================================================================================================================
Features of ™TradeChartist Donchian Channels Breakout Filter
======================================================
Option to plot Donchian Channels of user preferred length, based on the Source price in addition to High/Low Donchian Channels.
Generates trade entries based on user preferred Breakout Price. For example, if the user prefers HL2 as breakout price, irrespective of the Donchian Channels type, trade entries are generated only when hl2 price (average of high/low) breaks out of the upper or lower band.
Option to plot background colour based on Breakout trend. The bull zones are filled with green background, the Bear zones are filled with red background and the bar that broke out is filled with orange background.
Option to colour price bars using Donchian Channels price trend. The Donchian Channels basis line is plotted using the same colours as coloured bars as default.
Alerts can be created for long and short entries using Once per Bar Close .
Note: This script does not repaint . To use the script for trade entries, wait for the bar close and use a second confirmator (includes fundamentals) based on asset type as some markets require users to have good pulse on the fundamentals as trading by Technicals/price action dynamic alone may not be safe.
===================================================================================================================
Best Practice: Test with different settings first using Paper Trades before trading with real money
===================================================================================================================
This is not a free to use indicator. Get in touch with me (PM me directly if you would like trial access to test the indicator)
Premium Scripts - Trial access and Information
Trial access offered on all Premium scripts.
PM me directly to request trial access to the scripts or for more information.
===================================================================================================================
Simple Bollinger Bands Toolkit™TradeChartist Simple Bollinger Bands Toolkit is a useful set of Bollinger Bands based utilities, which includes 0 mean %B Oscillator , price volatility based BB Width , actual Bollinger Bands and BB Breakout Signals .
===================================================================================================================
™TradeChartist Simple Bollinger Bands Toolkit Features
================================================
Modified %B Oscillator with 0 as its mean
%B Oscillator Over-Bought (typically values > 80/90/100) and Over-Sold zones (typically values < - 80/-90/-100) can be displayed by enabling Show Over-Sold/Over-Bought Zones .
Highs and Lows of the %B Oscillator are displayed to help visualize Divergences.
BB Width as Price Volatility (BB Upper Band - BB Lower Band) can be displayed to visualize BB Squeeze zones.
Actual Bollinger Bands can be plotted by enabling Display Bollinger Bands . To display on main price chart, just move the BB Toolkit to price chart and merge the scales.
Breakout Signals can be displayed by enabling Display Bollinger Bands and Show BB Breakout Signals . This also displays background fill to help visualize the zones since the breakouts of upper/lower bands happened.
The BB Basis/Mean line is colour coded based on the %B Oscillator (%B>0 - Green, %B<0 - Red).
The Toolkit uses Simple Moving Average (SMA) for the basis line.
The default length is 55 and default Standard Deviation is 1. %B Oscillator can be smoothed (default - 5) using EMA to minimize noise. (Use 20 length and 2 standard deviation for classic Bollinger Bands).
Price Bars on the Main Price chart can be coloured by enabling BB Colour Bars .
===================================================================================================================

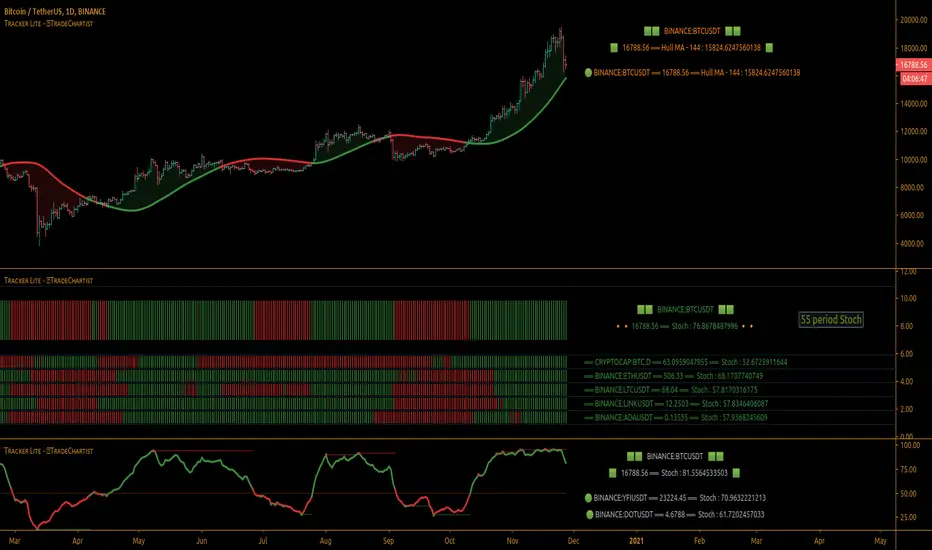
TradeChartist Tracker Lite™TradeChartist Tracker Lite is the lite version of ™TradeChartist Tracker and it is an essential real-time multi Indicator tracking toolkit that can be plotted as a standalone Indicator plot and/or a multi symbol tracker/screener for upto 5 different symbols . The indicators included in the tracker are Stochastic Oscillator, RSI , CCI , 10 different Moving Averages, MACD , Bollinger Bands %B, Net Volume and Heikin Ashi Trend.
===================================================================================================================
™𝗧𝗿𝗮𝗱𝗲𝗖𝗵𝗮𝗿𝘁𝗶𝘀𝘁 𝗧𝗿𝗮𝗰𝗸𝗲𝗿 𝗟𝗶𝘁𝗲 𝗨𝘀𝗲𝗿 𝗠𝗮𝗻𝘂𝗮𝗹
========================================
™TradeChartist Tracker Lite Plot Types
==================================
™TradeChartist Tracker Lite can be used to plot the following.
1. Indicator plot of Chart Symbol on its own, chosen from the 𝗜𝗻𝗱𝗶𝗰𝗮𝘁𝗼𝗿 𝗧𝘆𝗽𝗲 dropdown, enabling 𝐃𝐢𝐬𝐩𝐥𝐚𝐲 𝐈𝐧𝐝𝐢𝐜𝐚𝐭𝐨𝐫 𝐏𝐥𝐨𝐭 (𝐝𝐢𝐬𝐚𝐛𝐥𝐞𝐬 𝐓𝐫𝐚𝐜𝐤𝐞𝐫).
In this example Daily chart of XRP-USDT, 55 period Stochastic is tracked for the chart symbol XRP-USDT.
2. Indicator plot of a Symbol different from the Chart Symbol on its own, chosen from the 𝗜𝗻𝗱𝗶𝗰𝗮𝘁𝗼𝗿 𝗧𝘆𝗽𝗲 dropdown by enabling Tʀᴀᴄᴋ ᴀɴᴏᴛʜᴇʀ Sʏᴍʙᴏʟ's Iɴᴅɪᴄᴀᴛᴏʀ and entering the symbol name in the Sʏᴍʙᴏʟ ᴛᴏ Tʀᴀᴄᴋ input box, whilst keeping 𝐃𝐢𝐬𝐩𝐥𝐚𝐲 𝐈𝐧𝐝𝐢𝐜𝐚𝐭𝐨𝐫 𝐏𝐥𝐨𝐭 (𝐝𝐢𝐬𝐚𝐛𝐥𝐞𝐬 𝐓𝐫𝐚𝐜𝐤𝐞𝐫) enabled.
In this example Daily chart of XRP-USDT, 55 period Stochastic is tracked for the chart symbol BTC-USD.
3. Upto 5 Multiple Symbol Trackers for the Indicator chosen from the 𝗜𝗻𝗱𝗶𝗰𝗮𝘁𝗼𝗿 𝗧𝘆𝗽𝗲 dropdown, by disabling 𝐃𝐢𝐬𝐩𝐥𝐚𝐲 𝐈𝐧𝐝𝐢𝐜𝐚𝐭𝐨𝐫 𝐏𝐥𝐨𝐭 (𝐝𝐢𝐬𝐚𝐛𝐥𝐞𝐬 𝐓𝐫𝐚𝐜𝐤𝐞𝐫) and by entering the number of trackers required in the 𝐍𝐮𝐦𝐛𝐞𝐫 𝐨𝐟 𝐓𝐫𝐚𝐜𝐤𝐞𝐫𝐬 input box under 𝗧𝗿𝗮𝗰𝗸𝗲𝗿 𝗣𝗹𝗼𝘁𝘀 section. Upto 5 Symbols can be tracked and can be input by the user in the input boxes from Sʏᴍʙᴏʟ 1,...Sʏᴍʙᴏʟ 5 . 𝐃𝐢𝐬𝐩𝐥𝐚𝐲 𝐈𝐧𝐝𝐢𝐜𝐚𝐭𝐨𝐫 𝐏𝐥𝐨𝐭 (𝐝𝐢𝐬𝐚𝐛𝐥𝐞𝐬 𝐓𝐫𝐚𝐜𝐤𝐞𝐫) must be disabled for this plot type.
In this example Daily chart of Crypto Total Market Cap, Bollinger Bands %B is tracked for the chart symbol + 5 other Crypto symbols using Multi Symbol Trackers
4. Indicator Tracker labels can be plotted on Price chart by overlaying the Tracker on main chart and by switching from Separate Tracker Pane - Default to Tracker Labels only on Price Scale in the Lᴀʙᴇʟs Dɪsᴘʟᴀʏ Tʏᴘᴇ dropdown box.
In this example chart of 1hr XLM-USDT, Tracker labels of 55 EMA are plotted for 5 different symbols along with the 55 EMA plot of XLM-USDT.
===================================================================================================================
𝗜𝗻𝗱𝗶𝗰𝗮𝘁𝗼𝗿𝘀 𝗜𝗻𝗰𝗹𝘂𝗱𝗲𝗱 𝗶𝗻 ™𝗧𝗿𝗮𝗱𝗲𝗖𝗵𝗮𝗿𝘁𝗶𝘀𝘁 𝗧𝗿𝗮𝗰𝗸𝗲𝗿 𝗟𝗶𝘁𝗲
==================================================
1. Stochastic Oscillator
2. RSI
3. CCI
4. MA - (10 types included)
5. MACD
6. Bollinger Bands %B
7. Net Volume
8. Heikin Ashi Trend
All of the above indicators can be plotted as independent plots of the Chart Symbol or of a different symbol by enabling 𝐃𝐢𝐬𝐩𝐥𝐚𝐲 𝐈𝐧𝐝𝐢𝐜𝐚𝐭𝐨𝐫 𝐏𝐥𝐨𝐭 (𝐝𝐢𝐬𝐚𝐛𝐥𝐞𝐬 𝐓𝐫𝐚𝐜𝐤𝐞𝐫). Some Oscillators have the option of Pʟᴏᴛ Sᴛʏʟᴇ under their relevant sections, and can be plotted as line, area or a histogram.
Oscillators 1-6 require source price, lookback length and smoothing (where available) for the indicator plot. The colour of the tracker blocks is based on the Upper/Lower bands (where available), specified by the user in the respective sections. For example, if the RSI indicator is chosen to be plotted with Upper band at 60 and Lower band at 40 , the tracker blocks and the Indicator plot paint the values between 40 and 60 in neutral colour which can be changed from the settings.
Multi Window US30 example chart below with various indicators from ™TradeChartist Tracker Lite.
Moving Averages (MA) and MACD
------------------------------------------------------
Tracker Lite plots and tracks one of 10 Moving Averages that can be chosen from the MA ᴛʏᴘᴇ and by specifying the MA Lᴇɴɢᴛʜ .
MACD uses EMA as default for calculating the MACD plots and Tracker data using Fᴀsᴛ Lᴇɴɢᴛʜ , Sʟᴏᴡ Lᴇɴɢᴛʜ and Sᴍᴏᴏᴛʜɪɴɢ . To experiment or use a different Moving Average to calculate MACD , disable 𝐔𝐬𝐞 𝐄𝐌𝐀 (Uɴᴄʜᴇᴄᴋ ᴛᴏ ᴜsᴇ MA ғʀᴏᴍ ᴀʙᴏᴠᴇ) and select the required Moving Average from MA ᴛʏᴘᴇ drop down of the 𝟰. 𝗠𝗼𝘃𝗶𝗻𝗴 𝗔𝘃𝗲𝗿𝗮𝗴𝗲 section.
Net Volume and Heikin Ashi Trend
-------------------------------------------------------
Net Volume and Heikin Ashi Trend can be tracked and plotted for up to 5 symbols in addition to the chart symbol, but both Net Volume and Heikin Ashi Trend. Since the colour of the Net Volume depends on candle being bullish or bearish , it can help the user visualize if the current candle close of the symbol tracked is above or below the symbols's candle open.
Note: Bar Replay doesn't update the bar by bar indicator plot for historic bars for symbols other than the chart symbol. However, the Indicator Plot is perfectly usable for the realtime bar as data updates for both the Trackers and the indicator plot in realtime.
===================================================================================================================
𝗠𝘂𝗹𝘁𝗶 𝗦𝘆𝗺𝗯𝗼𝗹 𝗧𝗿𝗮𝗰𝗸𝗲𝗿𝘀/𝗟𝗮𝗯𝗲𝗹𝘀
=============================
Multi Symbol Tracker blocks continuously track the real-time indicator data of up to 5 symbols (in addition to the chart symbol) based on the number of Symbol Trackers preferred in the 𝐍𝐮𝐦𝐛𝐞𝐫 𝐨𝐟 𝐒𝐲𝐦𝐛𝐨𝐥 𝐓𝐫𝐚𝐜𝐤𝐞𝐫𝐬 (𝟎-𝟓) input box under the 𝗧𝗿𝗮𝗰𝗸𝗲𝗿 𝗣𝗹𝗼𝘁𝘀 section, and plots Bull, Bear and Neutral colour coded blocks based on both the indicator selected and settings preferred by the user under the relevant indicator section.
Multi Symbol Tracker Labels also continuously track the real-time indicator data in addition to the last close price (if 𝐒𝐡𝐨𝐰 𝐏𝐫𝐢𝐜𝐞 is enabled under 𝗧𝗿𝗮𝗰𝗸𝗲𝗿 𝗣𝗹𝗼𝘁𝘀 section), which helps user see the real-time changes in the indicator values and price changes of the symbols tracked.
The Tracker Label colours are exactly the same as the Tracker Block colours and are filtered based on the user preferred bands on the Oscillator values. For example, if the user prefers RSI upper band of 60 and lower band of 40 , the range between the values of 40 and 60 will be colour coded in neutral colour which can be changed from the 𝗨𝘀𝗲𝗳𝘂𝗹 𝗘𝘅𝘁𝗿𝗮𝘀 section of the indicator settings.
Note 1: Default settings are based on the Oscillator mid values. Using Upper and Lower bands for oscillators help spot the oversold and overbought zones and also helps spot breakout threshold based on Indicator values specified by the user. Example chart with visual depiction below using RSI .
===================================================================================================================
Frequently Asked Questions
========================
Q: When I load the ™TradeChartist Tracker Lite, why are the values in the labels blurred sometimes?
A: This happens occasionally as shown in the chart below, when the script is loaded for the first time or when a different setting is used.
To resolve this, just hide and unhide the script using the 👁 next to the Indicator title. If it is not visible, just hover the mouse/crosshair over the Indicator Title and it will be visible.
Q: Why does the indicator plot, tracker blocks and labels of Symbols being tracked, not update when I use Bar Replay?
A: As explained in the relevant sections above, historic data for bars and indicators other than chart symbol doesn't update on bar replay. But the chart symbol data does update for every bar on bar replay. This doesn't affect the real-time values and block colours for the symbols tracked.
Q: Can I track real-time values of a currently trading symbol when I'm on a symbol chart that is inactive? For example, can I see labels with real-time BTC values on a Sunday when I'm on a SPX chart when its not in session?
A: Simple answer is no. This is because, the plots are based on bar times of the chart and the symbols are tracked based on the bar time. So if the SPX session ended on Friday, the last known value of the BTC labels will be from Friday and hence it is always recommended to track symbols from a symbol chart that is in session.
Q: Does ™TradeChartist Tracker Lite repaint?
A: This indicator doesn't repaint but it is not recommended to trade a different symbol from the chart based on the real-time data alone without checking if the current symbol chart is in session as inactive price chart will not have updated data on symbols tracked. Also, bar replay doesn't work on data pulled from external symbol data than the chart symbol, but signals confirmed at candle close and confirmed by Tracker blocks with appropriate colour code will be in agreement with the respective indicator and can be double checked for building trust and confidence on the indicator. Also, the indicator is a good companion tool to track various indicators and prices, especially of symbols other than the chart symbol, but, to trade the symbol other than the chart symbol, user must refer to the respective chart.
Q: Can ™TradeChartist Tracker Lite be connected to other indicators as external source?
A: Yes. ™TradeChartist Tracker Lite can be connected to another script and there are several use cases in doing so. A couple of examples are shown below.
1. ™TradeChartist Tracker Lite Bollinger Bands %B 𝗜𝗻𝗱𝗶𝗰𝗮𝘁𝗼𝗿 𝗣𝗹𝗼𝘁 connected to ™TradeChartist Plotter to plot Divergences on the 4hr XAU-USD main price chart.
2. ™TradeChartist Tracker Lite 55 period Stochastic 𝗜𝗻𝗱𝗶𝗰𝗮𝘁𝗼𝗿 𝗣𝗹𝗼𝘁 connected to ™TradeChartist Plug and Trade as Oscillatory Signal with 0/0 to generate trade signals with Targets and performance information on trades.
More Example Charts
==================
===================================================================================================================
Best Practice: Test with different settings first using Paper Trades before trading with real money
The indicator is a good companion tool to track various indicators and prices, especially of symbols other than the chart symbol, but, to trade the symbol other than the chart symbol, user must refer to the respective chart.
===================================================================================================================
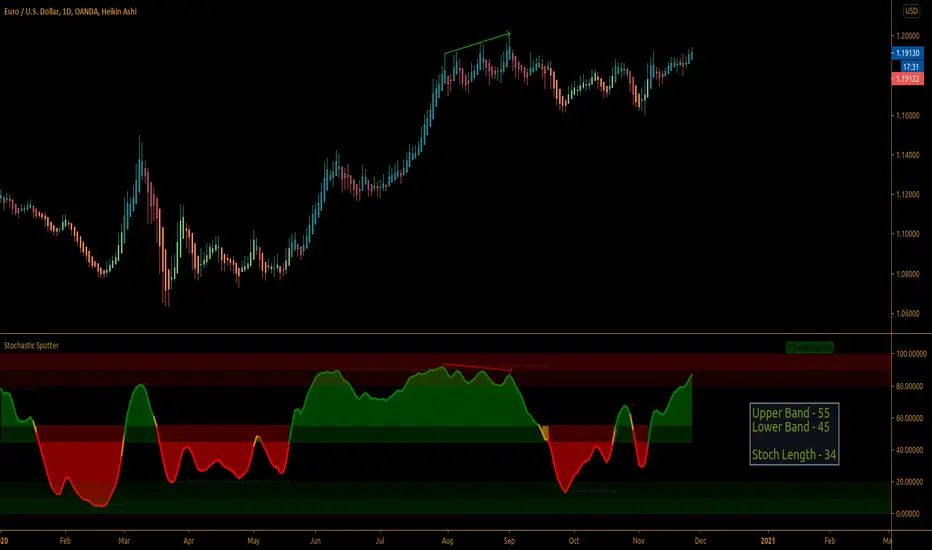
Simple Stochastic Spotter™TradeChartist Simple Stochastic Spotter is an elegant version of the classic Stochastic indicator and helps spot price trends using visually engaging and appealing Stochastic plot and background. The Bull and the Bear background fills are highly useful for traders who like to visually understand areas of entry and exit based on Stochastic .
===================================================================================================================
What does Simple Stochastic Spotter do?
Plots Stochastic with visually engaging colours for Bull and Bear zones (Green and Red) with optional background fill.
Plots Stochastic coloured bars on main chart based on user preferred Upper and Lower Stochastic bands (Default - 0/0).
Plots Stochastic based on EMA smoothing (1 for Regular Stochastic without smoothing).
Plots Heikin Ashi Stochastic if enabled from indicator settings.
Plots Stochastic highs of Bull Zone and Stochastic lows of Bear Zone. Helps visually spot divergences.
===================================================================================================================
Note:
Default Settings:
5 period EMA Smoothed Stochastic .
For Heikin Ashi Stochastic on normal bars, enable ᴜsᴇ ʜᴇɪᴋɪɴ ᴀsʜɪ sᴛᴏᴄʜ and change EMA Sᴛᴏᴄʜ sᴍᴏᴏᴛʜɪɴɢ to 1.
===================================================================================================================
Mean Reversion Strategy (Double EMA) w Stop LossOne of the strategy inspired by John F. Carter in his book - Mastering the trade. The idea is simple, once the price cross the fast MA (open trade), it will most likely approach the slow MA (close trade). I added an optional filter, which you can turn on to only open position when the distance between the 2 MA is higher or equal than a minimum % that you indicate. Suitable for volatile stocks/markets. Best use when the market is ranging, like any other mean reversion strategy.
Stop Loss feature is also added, with the option to choose from Percentage Stop Loss, Percentage Trailing Stop Loss, ATR Stop Loss or ATR Trailing Stop Loss.

Combined MA Trend FilterToday I propose a simple but an effective tool to use as a trend identifier.
It is simple because it doesn't require user to tinker with it and it works on all scripts and all time frames.
It is effective because it's based on what I believe to be the most used ma's by the traders who are successful and usually trade with large qty.
So, what's under the hood?
-It's a combination of MA's and its alpha multiplier to replicate effect of higher TF MA without producing the weird square shapes.
-We are utilizing the range between the two as a way to identify "noise areas" or "ranging areas" for the price action, where taking a trade might not be the best decision.
-As soon as bar starts closing above the both MA and its alpha multiplier, it is in strong bullish zone
-And as soon as bar start closing below the same we have a strong bearish zone.
-Bar Colour coding
Lime - Strong Bullish sentiment
Yellow - Weak Sentiment (Ranged area)
Red - Strong bearish sentiment
-This indicator works in two modes, one is noise mode and one is noiseless mode.
When we select noiseless mode, we are utilizing here a filter to reduce noise, which can be also plotted on chart and option for doing so is given in settings.
Some examples?
I've used alpha of 5 in above examples (You can change it to anything you want, depending on your script and TF)
As you can see, it produces far better filtering and keeps you out from possible "noise areas" when trading, it is also good at working as scaling in and out tool for purpose of maximizing the profits when you do catch the trend.
Please note that higher the alpha you use, you will be shifting to higher TF MA, while its difficult to have a set number of set TimeFrame effect replication, its best to keep the alpha multiplier value around 5.
Authors note:
This indicator is free to use for all, I'm only protecting the code to avoid people selling it to unsuspecting new users. It happens a lot on TV.
Past performance does not mean future profit and trader is responsible for his own losses or profits, author does not take any responsibility to wrong application of the tool provided here.
Have a profitable trading journey and enjoy~

TradeChartist Plotter™TradeChartist Plotter is an extremely useful and adaptive indicator that connects to any oscillator to plot highs and lows, Divergences and also Bull and Bear Zones based on the Oscillator and user input to filter zones. When plotted as normal or Heikin Ashi price bars/candles, the divergences can be plotted on price bars and in addition ™TradeChartist MA Visualizer can be plotted and used to filter trade zones derived from the Oscillator connected.
===================================================================================================================
™𝗧𝗿𝗮𝗱𝗲𝗖𝗵𝗮𝗿𝘁𝗶𝘀𝘁 𝗣𝗹𝗼𝘁𝘁𝗲𝗿 𝗨𝘀𝗲𝗿 𝗠𝗮𝗻𝘂𝗮𝗹
===================================
To connect an oscillator to ™TradeChartist Plotter, follow the steps below.
From the ╔═══ 𝗣𝗹𝘂𝗴 𝗢𝘀𝗰𝗶𝗹𝗹𝗮𝘁𝗼𝗿 ═══ 🔌 dropdown, choose the Oscillator plot which is active on the chart.
Choose the Oscillator Smoothing factor if smoothing is not available on the original oscillator plot by using the Osᴄɪʟʟᴀᴛᴏʀ Sᴍᴏᴏᴛʜɪɴɢ input box.
Enter Upper and Lower Bands for the Oscillator plot that helps detect Highs/Lows, Divergences, Trade Zones etc. by using the Uᴘᴘᴇʀ Bᴀɴᴅ and Lᴏᴡᴇʀ Bᴀɴᴅ input boxes. For example, for oscillators like RSI, bands can be 60/40 or 70/30 or even 50/50 to help filter highs/lows on Oscillator and the main price chart based on Oscillator values above Upper Band and Oscillator values below Lower Band.
Osᴄɪʟʟᴀᴛᴏʀ Bᴀsᴇ Lɪɴᴇ is required especially for Oscillators that don't have 0 as its base line. For example, RSI, Stochastic etc. oscillate between 0 and 100. For Oscillators like these, a base line value is really useful on ™TradeChartist Plotter especially to detect Divergences, Highs/Lows, Trade Zones and even to plot the Oscillator as a Histogram or Area plot.
Pʟᴏᴛ Bᴀsᴇ Lɪɴᴇ ᴀɴᴅ Bᴀɴᴅs plots base line and the bands if Oscillator plot is chosen.
There are three plot types under Pʟᴏᴛ Tʏᴘᴇ and they are
══ Plot Oscillator - This option plots the connected Oscillator
══ Plot Price Candles - This option plots price candles and if overlaid on main chart, Highs/Lows, Divergences etc can be visualized along with ™TradeChartist MA Visualizer if enabled.
══ Plot Price Bars - This option plots price bars and if overlaid on main chart, Highs/Lows, Divergences etc can be visualized along with ™TradeChartist MA Visualizer if enabled.
Pʟᴏᴛ HA Cᴀɴᴅʟᴇs/Bᴀʀs plots Heikin Ashi candles/bars. It doesn't affect the Oscillator plot or in anyway alter the Oscillator plot.
Pʟᴏᴛ Sᴛʏʟᴇ dropdown has three types of styles - Line, Histogram and Area plot styles for the Oscillator plot.
Pʟᴏᴛ Pʀɪᴄᴇ Hɪɢʜs ᴀɴᴅ Lᴏᴡs plots the price highs and price lows corresponding to the Bull and Bear zones of the Oscillator connected.
===================================================================================================================
╔═════════ 𝗠𝗔 𝗩𝗶𝘀𝘂𝗮𝗹𝗶𝘇𝗲𝗿 ═════════╗
MA Visualizer is a powerful and very useful original ™TradeChartist visual method to plot Moving Averages of the close price of the security for user specified look back period in a visually appealing style in the form of colour coded bands. MA Visualizer not only helps the trader spot the price action of the security relative to the moving average, but also paints a visual picture of the trend strength, which must be seen and used on chart to appreciate its elegance. One of 15 different types of Moving Averages can be used to visualize the price action.
Activate 𝗠𝗔 𝗩𝗶𝘀𝘂𝗮𝗹𝗶𝘇𝗲𝗿 and choose the MA type from MA Vɪsᴜᴀʟɪᴢᴇʀ Tʏᴘᴇ dropdown and entering the lookback period in MA Vɪsᴜᴀʟɪᴢᴇʀ ᴘᴇʀɪᴏᴅ input box.
MA Visualizer colour theme can be be changed from MA Vɪsᴜᴀʟɪᴢᴇʀ Cᴏʟᴏʀ Sᴄʜᴇᴍᴇ dropdown.
The faster of the two set of bands that form the MA Visualizer reacts to price action faster and can be clearly seen from its change of colour from Bull Colour to Bear Colour or vice-versa earlier than the slower set of bands. The fill colour between the bands also helps the user stay in a trade or exit a trade based on other confirmators.
Enabling Dᴀᴢᴢʟɪɴɢ Vɪsᴜᴀʟɪᴢᴇʀ makes the Visualizer dazzle. Uncheck this option for normal view of MA Visualizer.
𝐔𝐬𝐞 𝐌𝐀 𝐕𝐢𝐬𝐮𝐚𝐥𝐢𝐳𝐞𝐫 𝐚𝐬 𝐓𝐫𝐚𝐝𝐞 𝐅𝐢𝐥𝐭𝐞𝐫 filters the trade zones based on MA Visualizer's trend agreeing with the Oscillator trend. Fɪʟᴛᴇʀ Eᴀʀʟʏ Vɪsᴜᴀʟɪᴢᴇʀ Bʀᴇᴀᴋᴏᴜᴛs filters the trades based on faster MA Visualizer plot's trend.
Also, enabling Pʟᴏᴛᴛᴇʀ Bᴀᴄᴋɢʀᴏᴜɴᴅ Fɪʟʟ under 𝗨𝘀𝗲𝗳𝘂𝗹 𝗘𝘅𝘁𝗿𝗮𝘀 helps detect the trade zones with or without the MA Visualizer filter enabled.
===================================================================================================================
╔═══════ 𝗗𝗶𝘃𝗲𝗿𝗴𝗲𝗻𝗰𝗲𝘀 ═══════╗
Plotter detects both Regular and Hidden Bullish (in a Bear Zone) and Bearish Divergences (in a Bull Zone) at every occurence based on the Oscillator connected. This can be filtered by the use of filtering by Upper and Lower Band values in the Oscillator section. Divergences can also be plotted on price bars based on Pʟᴏᴛ Tʏᴘᴇ .
To plot divergences, enable 𝗗𝗶𝘃𝗲𝗿𝗴𝗲𝗻𝗰𝗲𝘀, Sʜᴏᴡ Rᴇɢᴜʟᴀʀ Dɪᴠᴇʀɢᴇɴᴄᴇs and Sʜᴏᴡ Hɪᴅᴅᴇɴ Dɪᴠᴇʀɢᴇɴᴄᴇs .
Users can further filter Divergences by entering the number of bars to the right in Rɪɢʜᴛ ʙᴀʀs ғᴏʀ Pɪᴠᴏᴛ Cᴏɴғɪʀᴍᴀᴛɪᴏɴ input box to confirm the Price Pivot (for Regular divergences) and Oscillator Pivot (for Hidden Divergences).
Note: Divergences can not be traded at every instance or as a standalone indicator. It just indicates a possibility of strength exhaustion and should not be trusted during a trending market. Higher smoothing (done sensibly) also filters divergences. Divergence can be a strong confirmator once a reversal is detected. For example, using MA Visualizer can help confirm a divergence and vice-versa to identify the trend changes. This means that the confirmations may happen after a few bars since the divergence in agreement with the MA Visualizers trend change.
The example chart of 4hr BTC-USDT chart shows the Divergences filtered by use of RSI 60/40 bands, MA Visualizer and Regression channel trends. It is important to note that the trend intensity colour on the plot and bars (if bar colour option is enabled) will help detect if the Divergence would hold.
===================================================================================================================
╔═══════ 𝗨𝘀𝗲𝗳𝘂𝗹 𝗘𝘅𝘁𝗿𝗮𝘀 ═══════╗
Pʟᴏᴛᴛᴇʀ Bᴀᴄᴋɢʀᴏᴜɴᴅ Fɪʟʟ - Plots background fill based on Bull and Bear Zones based on the Oscillator connected and the filters used.
Plotter offers two vibrant Colour Themes, namely Chilli and Flame , which can be opted from Pʟᴏᴛᴛᴇʀ Tʜᴇᴍᴇ dropdown. These themes also offer the option to plot the trend intensity on the price bars as bar colours by enabling Cᴏʟᴏᴜʀ Bᴀʀs . Bar colors can also be inverted using Iɴᴠᴇʀᴛ Bᴀʀ Cᴏʟᴏᴜʀ option.
Users can also choose to use the Simple theme and choose preferred colours from Sɪᴍᴘʟᴇ Tʜᴇᴍᴇ ʙᴜʟʟ Cᴏʟᴏᴜʀ and Sɪᴍᴘʟᴇ Tʜᴇᴍᴇ ʙᴇᴀʀ Cᴏʟᴏᴜʀ colour input.
Note : The indicator does not repaint and can be confidently used for alerts and trade entries without worrying about plots disappearing after bar close.
===================================================================================================================
Example Charts
1. EUR-USD 15m chart with 3 Plotters on chart, 1 with ™TradeChartist MDO , 1 on main chart and 1 HA Bar chart showing various ways of plotting highs/lows, divergences and Trade zones using 55 period LSMA MA Visualizer.
2. XAU-USD 15m chart with Chande Momentum Oscillator connector to Plotter with 200 period SMA Visualizer used as Trade Filter.
3. LINK-USDT 1hr chart with ™TradeChartist Risk Meter connected to Plotter with 144 period Hull MA Visualizer as Trade filter on Main chart with Divergences plotted based on Risk Meter Volatility Risk Oscillator.
4. Example 3 above with Plotter's Trend Identifier connected to ™TradeChartist Plug and Trade as Oscillatory Signal with Past performance and trades plotted.
===================================================================================================================
Best Practice: Test with different settings first using Paper Trades before trading with real money
===================================================================================================================
This is not a free to use indicator. Get in touch with me (PM me directly if you would like trial access to test the indicator)
Premium Scripts - Trial access and Information
Trial access offered on all Premium scripts.
PM me directly to request trial access to the scripts or for more information.
===================================================================================================================

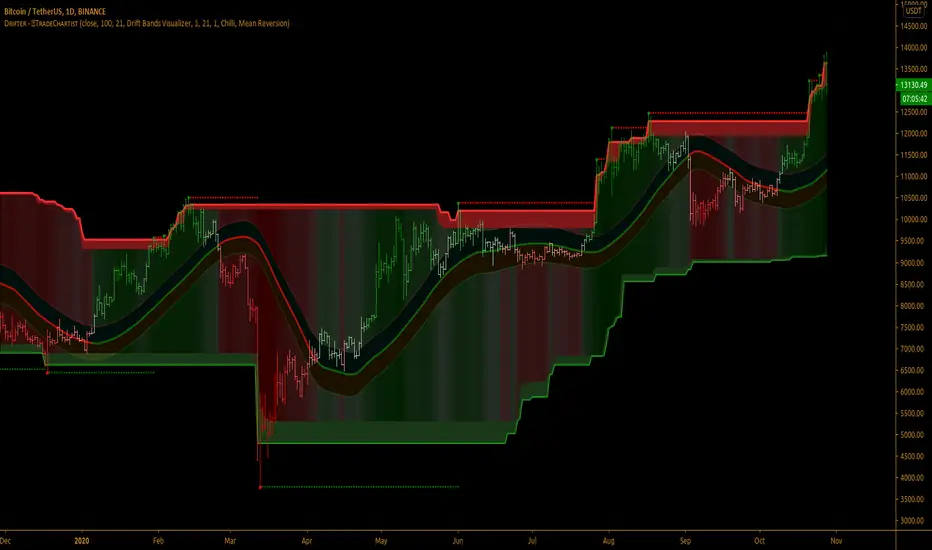
TradeChartist Drifter™𝗧𝗿𝗮𝗱𝗲𝗖𝗵𝗮𝗿𝘁𝗶𝘀𝘁 𝗗𝗿𝗶𝗳𝘁𝗲𝗿 is an adeptly designed, functional and a visual indicator that plots trend-following Support and Resistance walls by employing the concepts of Trend-based Support and Resistance, Momentum and Volatility, based on user defined lookback length, and includes three extremely useful Visualizers - Drift Bands Visualizer , Drift Strength Visualizer and Drifter AutoFibs Visualizer to help visualize the Price action in relation to the Support and Resistance Walls.
===================================================================================================================
™𝗧𝗿𝗮𝗱𝗲𝗖𝗵𝗮𝗿𝘁𝗶𝘀𝘁 𝗗𝗿𝗶𝗳𝘁𝗲𝗿 𝗨𝘀𝗲𝗿 𝗠𝗮𝗻𝘂𝗮𝗹
===================================
Concept of Drift
™TradeChartist Drifter combines concepts of Trend-based Support and Resistance, Momentum and Volatility to plot continuous Drifter Support and Resistance Walls that encloses the price action ( Drift ) within it (If the source price is price candle/bar based price like open,close,high,low,hl2,hl3 or ohlc4). In fact, these walls are generated by the price action ( Drift ) itself and helps the user see the price trend clearly as price makes higher highs/lows and lower highs/lows.
The Drifter walls are based on the user defined lookback length which can be changed in the Lᴇɴɢᴛʜ ғᴏʀ Dʀɪғᴛᴇʀ Wᴀʟʟs input box.
Drifter walls can be viewed or hidden by enabling or disabling 𝐒𝐡𝐨𝐰 𝐃𝐫𝐢𝐟𝐭𝐞𝐫 𝐖𝐚𝐥𝐥𝐬 .
Price Highs and Lows breaching the Drifter Walls can be viewed or hidden by enabling or disabling Sʜᴏᴡ Dʀɪғᴛᴇʀ Hɪɢʜs ᴀɴᴅ Lᴏᴡs .
Understanding and Visualizing ( Drift ) is important as it helps traders see the price action clearly. Price Volatility, Trend and Momentum are dependent on the period they are analysed. In order to visualize the drift, the user must enter the number of bars lookback in the Dʀɪғᴛ Lᴏᴏᴋʙᴀᴄᴋ input box.
===================================================================================================================
Three Types of Visualizers
One of the three types of Visualizers can be selected from Vɪsᴜᴀʟɪᴢᴇʀ Tʏᴘᴇ dropdown.
Drifter AutoFibs Visualizer is dependent on the Lᴇɴɢᴛʜ ғᴏʀ Dʀɪғᴛᴇʀ Wᴀʟʟs only as it fills the Drifter with Automatic Fibonacci Levels based on the distance between the Drifter Walls.
Drift Strength Visualizer is dependent on the Dʀɪғᴛ Lᴏᴏᴋʙᴀᴄᴋ only as it detects the Drift Strength based on Drift length. This Visualizer detects the Bull and the Bear zones based on the lookback. This helps visualize the Trend and Momentum clearly as the zones are filled with user selected theme based Bull and Bear colours.
Drift Bands Visualizer plots Drift Bands based on either Average True Range (ATR) or Standard Deviation along with the Bull or Bear Trend clearly shown using the color of the Mean or Basis line of the Drift Bands.
===================================================================================================================
╔═════════ 𝗗𝗿𝗶𝗳𝘁 𝗕𝗮𝗻𝗱𝘀 ══════════╗
Drift Bands are based on either ATR or Standard Deviation and consists of an Upper Band, a Lower Bands and a Mean or Basis Line. Drift Bands are extremely effective and highly useful in spotting the trend as the breakout from the upper or the lower band signals a change in the Drift based on the Dʀɪғᴛ Lᴏᴏᴋʙᴀᴄᴋ .
Note: The Mean or the Basis line of the Drift Bands depends only on the Dʀɪғᴛ Lᴏᴏᴋʙᴀᴄᴋ and Sᴏᴜʀᴄᴇ price. To plot Drift Bands based on external source, enable Usᴇ Sᴏᴜʀᴄᴇ Pʀɪᴄᴇ . The Width of the Bands is affected by ATR or Standard Deviation, based on the user preference.
ATR based Drift Bands
To plot ATR based Drift bands, enable 𝐀𝐓𝐑 𝐁𝐚𝐧𝐝𝐬 - Uɴᴄʜᴇᴄᴋ ғᴏʀ Sᴛᴀɴᴅᴀʀᴅ Dᴇᴠɪᴀᴛɪᴏɴ . ATR period is automatic. The ATR factor or the ATR multiplier can be changed in ATR Mᴜʟᴛɪᴘʟɪᴇʀ (ғᴏʀ ᴀᴛʀ ʙᴀsᴇᴅ ʙᴀɴᴅs (Default - 1, Min - 0.5, Max - 3). Higher ATR multiplier increases the width of the Drift Bands.
Note: In most cases, higher ATR multiplier of 2 or 3 increases Risk, but also results in increased Gains.
Standard Deviation based Drift Bands
To plot Standard Deviation bases Drift Bands, disable 𝐀𝐓𝐑 𝐁𝐚𝐧𝐝𝐬 - Uɴᴄʜᴇᴄᴋ ғᴏʀ Sᴛᴀɴᴅᴀʀᴅ Dᴇᴠɪᴀᴛɪᴏɴ . Both Sᴛᴀɴᴅᴀʀᴅ Dᴇᴠɪᴀᴛɪᴏɴ Lᴇɴɢᴛʜ (Default - 55, Min - 13) and Sᴛᴀɴᴅᴀʀᴅ Dᴇᴠɪᴀᴛɪᴏɴ Mᴜʟᴛɪᴘʟɪᴇʀ (Default - 1, Min - 0.236, Max - 2) affect the width of the Bands. Higher Standard Deviation Multiplier increases the Volatility of the Drift Bands.
Note: In most cases, higher Standard Deviation multiplier increases Risk, but also results in increased Gains.
Tip : To plot Bull and Bear Drift Zones, enable 𝐃𝐫𝐢𝐟𝐭 𝐙𝐨𝐧𝐞𝐬 𝐁𝐚𝐜𝐤𝐠𝐫𝐨𝐮𝐧𝐝 𝐅𝐢𝐥𝐥 and this can be used as Trade zones as this will be in sync with the trend colour of Mean line of the Drift Bands.
===================================================================================================================
╔═══════ 𝗗𝗿𝗶𝗳𝘁𝗲𝗿 𝗔𝗲𝘀𝘁𝗵𝗲𝘁𝗶𝗰𝘀 ═══════╗
There are two themes (Chilli and Flame) to choose from for the colour schemes of Drifter under 𝗗𝗿𝗶𝗳𝘁𝗲𝗿 𝗧𝗵𝗲𝗺𝗲 dropdown.
Dʀɪғᴛᴇʀ Bᴀᴄᴋɢʀᴏᴜɴᴅ Fɪʟʟ plots Bull and Bear strength based background fill between the Drifter walls. This is disabled for Drifter AutoFibs Visualizer .
There are two types of background fills namely, Mean Reversion and Trend Following and can be selected from Bᴀᴄᴋɢʀᴏᴜɴᴅ Fɪʟʟ Tʏᴘᴇ dropdown.
Enabling Dʀɪғᴛᴇʀ Cᴏʟᴏᴜʀ Bᴀʀs paints the price bars with the Drifter background fill.
Note: Trend Following fill is dependent on Dʀɪғᴛ Lᴏᴏᴋʙᴀᴄᴋ .
===================================================================================================================
Alerts
Alerts can be created for Long and Short entries by using Once Per Bar Close as Alert Frequency. Entries are generated on Real time bars based on Drift Bands Breakout conditions. It is recommended to wait for bar close before taking a position based on Drift Bands Trade Entries.
The indicator does not repaint and can be confidently used for alerts and trade entries without worrying about signals disappearing.
™TradeChartist Drifter can also be connected to ™TradeChartist Plug and Trade using 𝗗𝗿𝗶𝗳𝘁𝗲𝗿 𝗧𝗿𝗲𝗻𝗱 𝗜𝗱𝗲𝗻𝘁𝗶𝗳𝗶𝗲𝗿 as Oscillatory Signal to generate entries along with Targets, Stop Loss plots etc. Target and Stop Loss alerts can be created using Plug and Trade's Alerts system.
===================================================================================================================
There are several combinations of settings that can be tested on the security traded based on timeframe and risk/reward expectations. The indicator can be used for trade entries with various Drift Bands settings. Following are a few examples using the Drifter.
===================================================================================================================
Example Charts
1. SPX 1hr chart using Drifter AutoFibs Visualizer based on 100 period lookback for Drifter Walls.
2. SPX 1hr chart using Drift Strength Visualizer based on 100 period Drift Lookback.
3. SPX 1hr chart using 100 period ATR (Multiplier - 1) based Drift Bands Visualizer with Drift Zones Background Fill.
4. SPX 1hr chart using 50 period ATR (Multiplier - 1) based Drift Bands Visualizer with Drift Zones Background Fill.
5. SPX 1hr chart using 50 period Standard Deviation (Length - 21, Multiplier - 2) based Drift Bands Visualizer with Drift Zones Background Fill.
6. EUR-USD 1hr chart using 34 period ATR (Multiplier - 3) based Drift Bands Visualizer with Drift Zones Background Fill.
7. BTC-USD 5m chart using 34 period ATR (Multiplier - 3) based Drift Bands Visualizer connected to ™TradeChartist Intensity Equilibrium Line.
8. BTC-USD 5m chart using 34 period ATR (Multiplier - 3) based Drift Bands Visualizer connected to ™TradeChartist Intensity Equilibrium Line + Connected to ™TradeChartist Plug and Trade
===================================================================================================================
Best Practice: Test with different settings first using Paper Trades before trading with real money
===================================================================================================================
This is not a free to use indicator. Get in touch with me (PM me directly if you would like trial access to test the indicator)
Premium Scripts - Trial access and Information
Trial access offered on all Premium scripts.
PM me directly to request trial access to the scripts or for more information.
===================================================================================================================
TradeChartist Risk Meter™𝗧𝗿𝗮𝗱𝗲𝗖𝗵𝗮𝗿𝘁𝗶𝘀𝘁 𝗥𝗶𝘀𝗸 𝗠𝗲𝘁𝗲𝗿 is a very useful and a well designed indicator, that packs a range of Risk utility tools including Trend Based Stochastic Oscillator, Bollinger Bands %B , Volatility Risk Oscillator, RSI Oscillator and RSI Risk Oscillator, along with further visual risk assessment tools like Divergence Spotter, Trend based Strength detector among other useful extras.
===================================================================================================================
™𝗧𝗿𝗮𝗱𝗲𝗖𝗵𝗮𝗿𝘁𝗶𝘀𝘁 𝗥𝗶𝘀𝗸 𝗠𝗲𝘁𝗲𝗿 𝗨𝘀𝗲𝗿 𝗠𝗮𝗻𝘂𝗮𝗹
The user can choose from one of the following four option from the 𝗥𝗶𝘀𝗸 𝗠𝗲𝘁𝗲𝗿 𝗧𝘆𝗽𝗲 dropdown from the settings.
1. Trend Based Stochastic
2. Bollinger Bands %B
3. Volatility Risk Oscillator
4. RSI + RSI Risk Oscillator
The source price for the Risk Meter can be chosen from Sᴏᴜʀᴄᴇ dropdown. Both Trend Based Stochastic and Volatility Risk Oscillator use High/Low prices as default. Enable Usᴇ Sᴏᴜʀᴄᴇ Pʀɪᴄᴇ under respective section to use a different source price.
Users can choose to plot Risk Meter background fill by enabling or disabling Rɪsᴋ Mᴇᴛᴇʀ Bᴀᴄᴋɢʀᴏᴜɴᴅ . The background fill is based on the trend intensity and uses 2 different colour schemes based on user preference. When the Dᴇᴄɪᴅᴇʀ Tʜʀᴇsʜᴏʟᴅ is used, it uses the background fill to mask the zone. If background fill is disabled, orange colour is used to mask the zone.
All of the Risk Meter plots can be plotted as Line , Histogram or Area plots and each of the sections include the Pʟᴏᴛ Sᴛʏʟᴇ option, so the user can choose a specific type of plot style for each of the Risk Meter Oscillators, based on user preference.
===================================================================================================================
═══ 𝟭. 𝗧𝗿𝗲𝗻𝗱 𝗕𝗮𝘀𝗲𝗱 𝗦𝘁𝗼𝗰𝗵𝗮𝘀𝘁𝗶𝗰 ═══
Trend Based Stochastic Oscillator is a modified version of the classic Stochastic Oscillator with the difference being the limits and also the plot itself to an extent.
--> Trend based Stochastic is a single plot oscillates between -100 to +100 and occasionally breaches these limits and can signal extremely overbought or oversold conditions unlike classic Stochastic indicator, which has two plots and strictly oscillates between 0-100.
--> Trend based Stochastic is extremely sensitive to price action, making it possible to detect every single divergence, both regular and hidden, even with the default smoothing factor of 5
--> Risk Meter employs Dᴇᴄɪᴅᴇʀ Tʜʀᴇsʜᴏʟᴅ to let user choose the threshold limit and only from this point onwards, Risk Meter detects the divergences. This helps filter a lot of noise in addition to Price and Oscillator Pivot detection under 𝗗𝗶𝘃𝗲𝗿𝗴𝗲𝗻𝗰𝗲𝘀 section.
The user has to choose the length for the Trend based Stochastic plot by entering number of bars in Lᴏᴏᴋʙᴀᴄᴋ Lᴇɴɢᴛʜ input box (Default value is 55). The user can also change the smoothing factor from default value of 5 by entering the value in Sᴍᴏᴏᴛʜɪɴɢ input box. Smoothing is particularly useful to detect the strength, based on the trend if 𝐂𝐨𝐥𝐨𝐫 𝐙𝐨𝐧𝐞𝐬 𝐛𝐚𝐬𝐞𝐝 𝐨𝐧 𝐒𝐭𝐫𝐞𝐧𝐠𝐭𝐡 is enabled and the required trend length is entered in Tʀᴇɴᴅ Sᴛʀᴇɴɢᴛʜ Dᴇᴛᴇᴄᴛɪᴏɴ Lᴇɴɢᴛʜ . This feature splits the Risk Meter Plot into Bull and Bear zones based on the trend strength. HIgher Smoothing with default trend strength detection of 5 (upto 10) works well for sensitive price hugging scalps/swings. For longer trends, higher detection lengths can be used.
===================================================================================================================
════ 𝟮. 𝗕𝗼𝗹𝗹𝗶𝗻𝗴𝗲𝗿 𝗕𝗮𝗻𝗱𝘀 %𝗕 ═════
Bollinger Bands %B in Risk Meter oscillates between -100 to +100 rather than 0 - 1 in the classic version, with oversold/overbought levels breaching the limits and the plot is exactly the same otherwise.
Risk Meter employs Dᴇᴄɪᴅᴇʀ Tʜʀᴇsʜᴏʟᴅ for Bollinger Bands %B to let the user choose the threshold limit and only from this point onwards, Risk Meter detects the divergences. This helps filter a lot of noise in addition to Price and Oscillator Pivot detection under 𝗗𝗶𝘃𝗲𝗿𝗴𝗲𝗻𝗰𝗲𝘀 section.
The user has to choose the Simple Moving Average (SMA) length for the plot by entering number of bars in BB SMA Lᴇɴɢᴛʜ input box (Default value is 20). There is no need for Standard Deviation as the fundamental plot is exactly the same, given that the plot oscillates between -100 to +100. The user can also change the smoothing factor from default value of 5 by entering the value in Sᴍᴏᴏᴛʜɪɴɢ input box. Smoothing is particularly useful to detect the strength, based on the trend if 𝐂𝐨𝐥𝐨𝐫 𝐙𝐨𝐧𝐞𝐬 𝐛𝐚𝐬𝐞𝐝 𝐨𝐧 𝐒𝐭𝐫𝐞𝐧𝐠𝐭𝐡 is enabled and the required trend length is entered in Tʀᴇɴᴅ Sᴛʀᴇɴɢᴛʜ Dᴇᴛᴇᴄᴛɪᴏɴ Lᴇɴɢᴛʜ . This feature splits the Risk Meter Plot into Bull and Bear zones based on the trend strength. HIgher Smoothing with default trend strength detection of 5 (upto 10) works well for sensitive price hugging scalps/swings. For longer trends, higher detection lengths can be used.
===================================================================================================================
══════ 𝟯. 𝗩𝗼𝗹𝗮𝘁𝗶𝗹𝗶𝘁𝘆 𝗥𝗶𝘀𝗸 ═══════
Volatility Risk Oscillator is an original ™TradeChartist model designed to visually see the Volatility risk for the security on any time frame.
To plot Volatility Risk for the security, the user has to enter the number of bars to detect volatility risk in Lᴏᴏᴋʙᴀᴄᴋ Lᴇɴɢᴛʜ input box (Default Value is 55). The user can also change the smoothing factor from default value of 5 by entering the value in Sᴍᴏᴏᴛʜɪɴɢ input box. Smoothing is particularly useful to detect the strength based on trend if 𝐂𝐨𝐥𝐨𝐫 𝐙𝐨𝐧𝐞𝐬 𝐛𝐚𝐬𝐞𝐝 𝐨𝐧 𝐒𝐭𝐫𝐞𝐧𝐠𝐭𝐡 is enabled and required trend length is entered in Tʀᴇɴᴅ Sᴛʀᴇɴɢᴛʜ Dᴇᴛᴇᴄᴛɪᴏɴ Lᴇɴɢᴛʜ . This feature splits the Risk Meter Plot into Bull and Bear zones based on the trend strength. HIgher Smoothing with default trend strength detection of 5 (upto 10) works well for sensitive price hugging scalps/swings. For longer trends, higher detection lengths can be used.
Even though Divergences work on Volatility Risk Oscillator, it is not employed as it produces far too many and there is no set Threshold limit that can be set to filter the divergences.
===================================================================================================================
══════ 𝟰. 𝗥𝗦𝗜 𝗢𝘀𝗰𝗶𝗹𝗹𝗮𝘁𝗼𝗿 ═══════
There are two different types of RSI Oscillators in this section that can be plotted.
RSI Oscillator - Classic RSI modified to fit -100 to +100 scale rather than 0 - 100 scale. Risk Meter employs Dᴇᴄɪᴅᴇʀ Tʜʀᴇsʜᴏʟᴅ for RSI Oscillator also, to let the user choose the threshold limit and only from this point onwards, Risk Meter detects the divergences. This helps filter a lot of noise in addition to Price and Oscillator Pivot detection under 𝗗𝗶𝘃𝗲𝗿𝗴𝗲𝗻𝗰𝗲𝘀 section.
RSI Risk Oscillator - This oscillator plots the potential RSI risk based on RSI length (which can be changed in RSI Lᴇɴɢᴛʜ input box and main source price ( Sᴏᴜʀᴄᴇ ). The user can also change the smoothing factor from default value of 5 by entering the value in Sᴍᴏᴏᴛʜɪɴɢ input box. Smoothing is particularly useful to detect the strength, based on the trend if 𝐂𝐨𝐥𝐨𝐫 𝐙𝐨𝐧𝐞𝐬 𝐛𝐚𝐬𝐞𝐝 𝐨𝐧 𝐒𝐭𝐫𝐞𝐧𝐠𝐭𝐡 is enabled and the required trend length is entered in Tʀᴇɴᴅ Sᴛʀᴇɴɢᴛʜ Dᴇᴛᴇᴄᴛɪᴏɴ Lᴇɴɢᴛʜ . This feature splits the Risk Meter Plot into Bull and Bear zones based on the trend strength. Higher Smoothing with default trend strength detection of 5 (upto 10) works well for sensitive price hugging scalps/swings. For longer trends, higher detection lengths can be used.
To plot RSI Risk Oscillator, 𝐒𝐡𝐨𝐰 𝐑𝐒𝐈 𝐑𝐢𝐬𝐤 𝐎𝐬𝐜𝐢𝐥𝐥𝐚𝐭𝐨𝐫 must be enabled. Disabling this option plots normal RSI Oscillator.
The 4hr chart of BTC-USDT below shows use of RSI Risk Oscillator (Top) with RSI Oscillator (bottom).
===================================================================================================================
╔═══════ 𝗗𝗶𝘃𝗲𝗿𝗴𝗲𝗻𝗰𝗲𝘀 ═══════╗
Risk Meter detects both Regular and Hidden Bullish and Bearish Divergences at every occurence. This can be filtered by the use of Dᴇᴄɪᴅᴇʀ Tʜʀᴇsʜᴏʟᴅ in above sections. To plot divergences, enable
𝗗𝗶𝘃𝗲𝗿𝗴𝗲𝗻𝗰𝗲𝘀, Sʜᴏᴡ Rᴇɢᴜʟᴀʀ Dɪᴠᴇʀɢᴇɴᴄᴇs and Sʜᴏᴡ Hɪᴅᴅᴇɴ Dɪᴠᴇʀɢᴇɴᴄᴇs . All divergences are enabled as default.
Users can further filter Divergences by entering the number of bars to the right in Rɪɢʜᴛ ʙᴀʀs ғᴏʀ Pɪᴠᴏᴛ Cᴏɴғɪʀᴍᴀᴛɪᴏɴ input box to confirm the Price Pivot (for Regular divergences) and Oscillator Pivot (for Hidden Divergences).
The example chart of 4hr BTC-USDT chart shows the Divergences filtered by use of RSI Threshold. It is important to note that the trend intensity colour on the plot and bars (if bar colour option is enabled) will help detect if the Divergence would hold.
===================================================================================================================
╔═══════ 𝗨𝘀𝗲𝗳𝘂𝗹 𝗘𝘅𝘁𝗿𝗮𝘀 ═══════╗
Risk Meter offer two vibrant Colour Themes, namely Chilli and Flame , which can be opted from Rɪsᴋ Mᴇᴛᴇʀ Tʜᴇᴍᴇ dropdown. These themes also offer the option to plot the trend intensity on the price bars as bar colours by enabling Rɪsᴋ Mᴇᴛᴇʀ Cᴏʟᴏᴜʀ Bᴀʀs . Bar colors can also be inverted using Iɴᴠᴇʀᴛ Bᴀʀ Cᴏʟᴏᴜʀ option.
Users can also choose to use the Simple theme and choose preferred colours from Sɪᴍᴘʟᴇ Tʜᴇᴍᴇ ʙᴜʟʟ Cᴏʟᴏᴜʀ and Sɪᴍᴘʟᴇ Tʜᴇᴍᴇ ʙᴇᴀʀ Cᴏʟᴏᴜʀ colour input.
Note: The indicator does not repaint and can be confidently used for alerts and trade entries without worrying about plots disappearing after bar close.
===================================================================================================================
Example Charts
1. 89 period Trend Based Stochastic Oscillator as Histogram plot on LINK-USDT 1hr chart with Chilli Theme.
2. 89 period Volatility Risk Oscillator as Histogram plot on SPX 1hr chart with Chilli Theme.
3. 14 period RSI Risk Oscillator as Area plot on AAPL Daily Chart with Flame Theme.
4. 100 period Volatility Risk Oscillator using Trend Strength plotted as Zones on 1hr EUR-USD chart with Chilli Theme.
===================================================================================================================
Best Practice: Test with different settings first using Paper Trades before trading with real money
===================================================================================================================
This is not a free to use indicator. Get in touch with me (PM me directly if you would like trial access to test the indicator)
Premium Scripts - Trial access and Information
Trial access offered on all Premium scripts.
PM me directly to request trial access to the scripts or for more information.
===================================================================================================================

[NLX-L2] Hurst Exponent Signal Filter- Hurst Exponent Signal Filter -
The Hurst Exponent Signal Filter is meant to be used with an external signal source, this can be any indicator with a signal plot output (-1 Sell / 1 Buy)
It filters out a lot of noisy signals and improves the performance of many indicators.
- Example: How to Use -
1. Add a trend Indicator like Trend Index MTF to your chart
2. Add an indicator with a signal plot like Fishers Stochastic Center of Gravity to your Chart and select the Trend Index MTF with Type L1 in the Settings as Signal Source
3. Add this Hurst Signal Filter to your Chart and select the Fishers Stochastic Center of Gravity with Type L2 in the Settings as Signal Source
4. Add the Backtest Module to your Chart and select the Hurst Signal Filter with Type L2 as Source
- Alerts for Automated Trading -
See my signature below. Contact me for the Alert module.

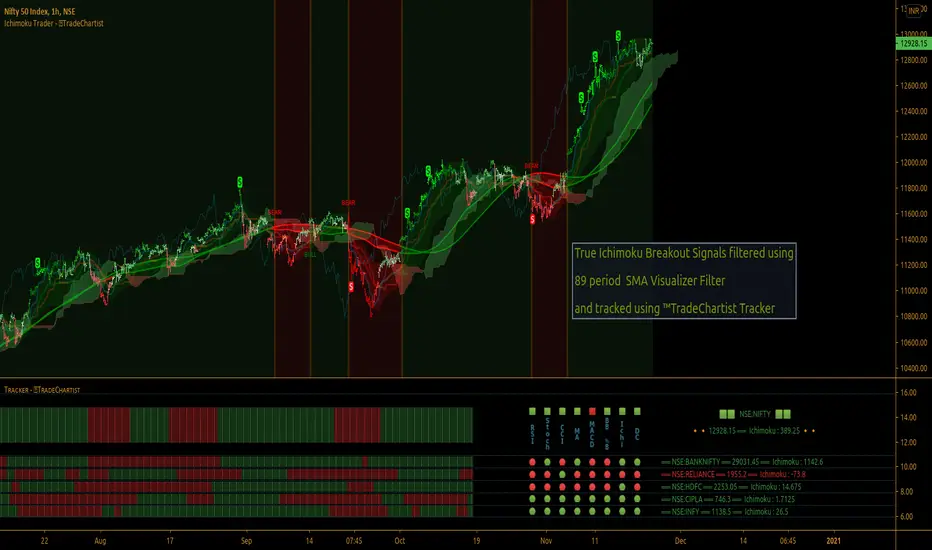
TradeChartist Ichimoku Trader ™TradeChartist Ichimoku Trader is an elegant and functional breakouts trading indicator that generates trade signals based on two types of breakouts - True Ichimoku Kumo Breakouts and Ichimoku Trade Bands Breakouts, which can be further filtered using ™TradeChartist MA Visualizer and/or using an external Filter.
===================================================================================================================
╔════════ 𝗖𝗹𝗼𝘂𝗱 𝗦𝗲𝘁𝘁𝗶𝗻𝗴𝘀 ═════════╗
Cloud Settings form the fundamental factor for this indicator to detect the breakouts. The settings for the Ichimoku Cloud is Automatic by default, but this can be changed based on the user preference from the settings under 𝐂𝐥𝐨𝐮𝐝 𝐓𝐲𝐩𝐞, which also includes a manual input option. Ichimoku traders can experiment different settings combinations under manual settings to suit their trading frequency and timeframe traded.
Ichimoku Cloud with its components can be displayed or hidden by enabling/disabling 𝐃𝐢𝐬𝐩𝐥𝐚𝐲 𝐈𝐜𝐡𝐢𝐦𝐨𝐤𝐮 𝐂𝐥𝐨𝐮𝐝. Also, Sʜᴏᴡ Iᴄʜɪᴍᴏᴋᴜ Cʀᴏssᴇs from the Cloud Settings plots tiny crosses on chart.
===================================================================================================================
╔═════════ 𝗕𝗮𝗻𝗱𝘀 𝗦𝗲𝘁𝘁𝗶𝗻𝗴𝘀 ════════╗
Even though the Ichimoku Trade Bands are derived from the Cloud Parameters, the Bᴀɴᴅ Wɪᴅᴛʜ (0.236 - 1) and Lᴏᴏᴋʙᴀᴄᴋ (5 - 200) influences the sensitivity and the width of the bands, which has an effect on the risk and reward expected from Ichimoku Trade Bands Breakout trade.
Trade Bands can be displayed or hidden by enabling/disabling 𝐃𝐢𝐬𝐩𝐥𝐚𝐲 𝐈𝐜𝐡𝐢𝐦𝐨𝐤𝐮 𝐓𝐫𝐚𝐝𝐞 𝐁𝐚𝐧𝐝𝐬. Also, the Bands mean line can be enabled or disabled using 𝐃𝐢𝐬𝐩𝐥𝐚𝐲 𝐓𝐫𝐚𝐝𝐞 𝐁𝐚𝐧𝐝𝐬 𝐌𝐞𝐚𝐧 𝐋𝐢𝐧𝐞 check box and its line width can be changed using Tʀᴀᴅᴇ Bᴀɴᴅs Mᴇᴀɴ Lɪɴᴇ Wɪᴅᴛʜ dropdown.
===================================================================================================================
╔═════════ 𝗠𝗔 𝗩𝗶𝘀𝘂𝗮𝗹𝗶𝘇𝗲𝗿 ═════════╗
MA Visualizer is a powerful and very useful original ™TradeChartist visual method to plot Moving Averages of the close price of the security for user specified look back period in a visually appealing style in the form of colour coded bands. MA Visualizer not only helps the trader spot the price action of the security relative to the moving average, but also paints a visual picture of the trend strength, which must be seen and used on chart to appreciate its elegance. One of 15 different types of Moving Averages can be used to visualize the price action.
Activate 𝗠𝗔 𝗩𝗶𝘀𝘂𝗮𝗹𝗶𝘇𝗲𝗿 and choose the MA type from MA Vɪsᴜᴀʟɪᴢᴇʀ Tʏᴘᴇ dropdown and entering the lookback period in MA Vɪsᴜᴀʟɪᴢᴇʀ ᴘᴇʀɪᴏᴅ input box. MA Visualizer colour theme can be be changed from MA Vɪsᴜᴀʟɪᴢᴇʀ Cᴏʟᴏʀ Sᴄʜᴇᴍᴇ dropdown.
The faster of the two set of bands that form the MA Visualizer reacts to price action faster and can be clearly seen from its change of colour from Bull Colour to Bear Colour or viceversa earlier than the slower set of bands. The fill colour between the bands also helps the user stay in a trade or exit a trade based on other confirmators.
===================================================================================================================
╔═══════ 𝗦𝗶𝗴𝗻𝗮𝗹𝘀 𝗮𝗻𝗱 𝗙𝗶𝗹𝘁𝗲𝗿𝘀 ═══════╗
Signal Type
True Ichimoku Kumo Breakout
Ichimoku traders mostly use the Kumo breakouts for trading based on several Bullish and Bearish conditions. For the sake of effective trade entries, trade entry plots for specific cloud events like Kumo twists, Tenkan Sen crossing Kijun Sen, price crossing cloud components etc have been intentionally ignored as Ichimoku traders often tend to visually trade them effectively.
Ichimoku Trade Bands Breakout
In addition to the True Kumo Breakouts, users of this script will be able to trade Ichimoku Trade Bands Breakouts. Ichimoku Trade Bands is an original ™TradeChartist model designed to detect early trend changes based on the Ichimoku settings. These bands are comprised of three plots - an upper band, a lower band and a mean line, namely and all are derived from the Ichimoku settings. The bands act as a filter and a breakout from bands' extreme boundaries signals a change in trend. The settings of the bands can be derived automatically or using manual input based on Ichimoku Cloud parameters, accessed from the indicator settings.
The Breakout Trade Entries can be further filtered by use of MA Visualizer or by using an external filter connected to the script.
===================================================================================================================
╔═════════ 𝗙𝗶𝗹𝘁𝗲𝗿 𝗦𝗲𝘁𝘁𝗶𝗻𝗴𝘀 ═════════╗
Filters are normally used to reduce noise in the Trade Entry Signals and they can be quite effective in helping the trader stay in trade and to minimize unproductive trade entries. Ichimoku Trader enables the user to use upto two trade filters - MA Visualizer and /or External Filter respectively.
Moving Averages are very effective trade filters and if the right Moving Average is used with right lookback period based on trade type and timeframe traded, they can be very effective in filtering trades.
Enabling 𝐔𝐬𝐞 𝐌𝐀 𝐕𝐢𝐬𝐮𝐚𝐥𝐢𝐳𝐞𝐫 𝐚𝐬 𝐓𝐫𝐚𝐝𝐞 𝐅𝐢𝐥𝐭𝐞𝐫 filters breakouts only when MA Visualizer agrees with the trend (which can be visualized using the fill colour between the MA Visualizer plots.
Enabling Fɪʟᴛᴇʀ Eᴀʀʟʏ Vɪsᴜᴀʟɪᴢᴇʀ Bʀᴇᴀᴋᴏᴜᴛs in addition filters breakouts even if price closed above the upper MA Visualizer plot without having to agree with fill colour.
In addition to MA Visualizer Filter, and external filter like RSI, MACD etc. can also be used by connecting to Ichimoku Trader under ╔═══ 𝗣𝗹𝘂𝗴 𝗙𝗶𝗹𝘁𝗲𝗿 𝗵𝗲𝗿𝗲 ═══ 🔌 dropdown by enabling 𝐔𝐬𝐞 𝐄𝐱𝐭𝐞𝐫𝐧𝐚𝐥 𝐅𝐢𝐥𝐭𝐞𝐫 𝐚𝐬 𝐓𝐫𝐚𝐝𝐞 𝐅𝐢𝐥𝐭𝐞𝐫. The external filter can be used as the only filter or in addition to MA Visualizer filter.
To get the external filter to work, Sɪɢɴᴀʟ Tʏᴘᴇ must be set right. For plots that are not oscillatory like Moving Averages, Super Trend etc., choose type as Non Oscillatory and for Oscillators like RSI, CCI, MACD etc., choose type as Oscillatory .
For Oscillators, levels must be specified for Fɪʟᴛᴇʀ Lᴇᴠᴇʟ ғᴏʀ ʟᴏɴɢs and Fɪʟᴛᴇʀ Lᴇᴠᴇʟ ғᴏʀ sʜᴏʀᴛs , especially if the Oscillator doesnt have 0 as mid line, like RSI. Even for 0 mid oscillators like CCI, filter levels like 100/-100 work effectively to filter noise.
Use 𝐓𝐫𝐚𝐝𝐞 𝐙𝐨𝐧𝐞𝐬 𝐁𝐚𝐜𝐤𝐠𝐫𝐨𝐮𝐧𝐝 𝐅𝐢𝐥𝐥 under 𝗨𝘀𝗲𝗳𝘂𝗹 𝗘𝘅𝘁𝗿𝗮𝘀 to paint the trade zones background. It helps visually see the effect of filters on the breakout entries and also the trade performance.
===================================================================================================================
╔═════════ 𝗨𝘀𝗲𝗳𝘂𝗹 𝗘𝘅𝘁𝗿𝗮𝘀 ═════════╗
Ichimoku Trader also includes the following useful extras
𝐓𝐫𝐚𝐝𝐞 𝐙𝐨𝐧𝐞𝐬 𝐁𝐚𝐜𝐤𝐠𝐫𝐨𝐮𝐧𝐝 𝐅𝐢𝐥𝐥 paints the trade zones in green and red as mentioned above.
Sʜᴏᴡ Hɪɢʜs ᴀɴᴅ Lᴏᴡs plots the highest highs of the Bull Zone and the lowest lows of the Bear Zone to help spot the wicks, support and resistance.
Tᴀᴋᴇ Pʀᴏғɪᴛ Bᴀʀs helps detect the volatility exhaustion prices and plots $ signs to help the trader take profits or move stop loss levels to secure gains or to reduce losses.
Vɪsᴜᴀʟɪᴢᴇʀ Cᴏʟᴏʀ Bᴀʀs paints the price bars with trend intensity and the user can opt from one of two themes under Bᴀʀ Cᴏʟᴏʀ Sᴄʜᴇᴍᴇ (Chilli and Flame).
The bar colors can be inverted by enabling Iɴᴠᴇʀᴛ Bᴀʀ Cᴏʟᴏʀs to see reverse bias with respect to the current trade direction.
===================================================================================================================
╔═════════ 𝗔𝗹𝗲𝗿𝘁𝘀 ═════════╗
Alerts can be created for Long and Short entries by using Once Per Bar Close as Alert Frequency. Entries are generated on Real time bars based on Breakout and filter conditions. It is recommended to wait for bar close before taking a position based on Ichimoku Trader Trade Entries.
The indicator does not repaint and can be confidently used for alerts and trade entries without worrying about signals disappearing.
™TradeChartist Ichimoku Trader 𝗧𝗿𝗲𝗻𝗱 𝗜𝗱𝗲𝗻𝘁𝗶𝗳𝗶𝗲𝗿 can also be connected to ™TradeChartist Plug and Trade to generate entries along with Targets, Stop Loss plots etc. Target and Stop Loss alerts can be created using Plug and Trade's Alerts system.
===================================================================================================================
There are several combinations of settings that can be tested on the security traded based on timeframe and risk/reward expectations. The indicator can be used for trade entries with filter combinations or can be used as standalone Visualizer for trend confirmations, levels etc. Following are a few examples using the Visualizer.
╔════════ 𝗘𝘅𝗮𝗺𝗽𝗹𝗲 𝗖𝗵𝗮𝗿𝘁𝘀 ════════╗
1. BTC-USDT 1hr True Ichimoku Kumo Breakout with no filters.
2. BTC-USDT 1hr Ichimoku Trade Bands (Default) Breakout with no filters.
3. BTC-USDT 1hr Ichimoku Trade Bands (Default) Breakout using 200 period Hull MA Visualizer filter.
4. AAPL 4hr Ichimoku Trade Bands (Default) Breakout using 200 period VIDYA MA Visualizer filter. Note: VIDYA is normally used for long term trades.
5. GBP-USD 5m True Ichimoku Kumo Breakout using 144 period TEMA MA Visualizer filter and Money Flow Index connected as external filter with 80/20 Filter values.
6. XAU-USD 1hr Ichimoku Trade Bands (Default) Breakout using 144 period TEMA MA Visualizer and Keltner Channels basis line as external non-oscillatory filter, connected to ™TradeChartist Plug and Trade using Ichimoku Trader 𝗧𝗿𝗲𝗻𝗱 𝗜𝗱𝗲𝗻𝘁𝗶𝗳𝗶𝗲𝗿.
7. SHITPERP 1hr Ichimoku Trade Bands (0.618 Band Width and Lookback 89 periods) using 50 period Zero-Lag EMA Visualizer Filter.
===================================================================================================================
Best Practice: Test with different settings first using Paper Trades before trading with real money
===================================================================================================================
This is not a free to use indicator. Get in touch with me (PM me directly if you would like trial access to test the indicator)
Premium Scripts - Trial access and Information
Trial access offered on all Premium scripts.
PM me directly to request trial access to the scripts or for more information.
===================================================================================================================
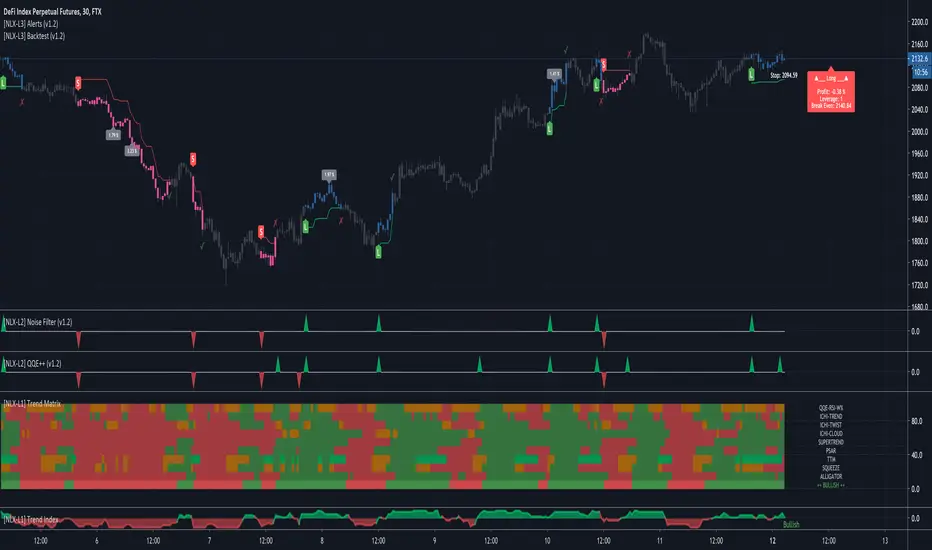
[NLX-L1] Noise Filter- NLX Modular Trading Framework -
This Noise Filter is build upon a logic of Hurst Exponent and MA-ATR %-Distance to Price and does a great job at filtering choppy trades and noise.
The Hurst Exponent will analyze a time series and determine whether it is a geometric Brownian motion, mean reverting or trending and effective at filtering out whipsaws.
- Getting Started -
1. Add the Noise Filter to your Chart
2. Add one of my Indicator Modules to your Chart, such as the QQE++ Indicator
3. Select the Noise Filter in the Indicator Settings
2. Add the Backtest Module to your Chart
3. Select the QQE Indicator in the Backtest Settings
- Alerts for Automated Trading -
This module is coming soon and you will be able to create alerts for the QQE Signals as part of my framework.
See my signature below for more information.
TradeChartist Visualizer ™TradeChartist Visualizer is a fully packed Trader's toolkit that helps decide Trade Entries and Exits based on Bollinger Bands and Donchian Channels breakouts and can be further exploited by the use of various visualizers and built in Filters like Ichimoku Cloud, 15 different Moving Averages, RSI, TradeChartist's original MA Visualizer and Automatic Levels Generator.
===================================================================================================================
Bollinger Bands is a classic indicator that uses a simple moving average of 20 periods, along with plots of upper and lower bands that are 2 standard deviations away from the basis line. These bands help visualize price volatility and trend based on where the price is, in relation to the bands.
Donchian Channels comprises of three plots - a upper band, a lower band and a mean line (or mid line of the channel). The upper band is based on highest high of N periods specified by the user and the lower band is based on the lowest low of N periods specified by the user. These channels help spot price breaching high or low of last N periods clearly, thereby aiding the trader to understand the price action of any security better on any given timeframe.
===================================================================================================================
╔═════ 𝗕𝗕 & 𝗗𝗼𝗻𝗰𝗵𝗶𝗮𝗻 𝗖𝗵𝗮𝗻𝗻𝗲𝗹𝘀 ═════╗
™TradeChartist Visualizer is based on the idea of Bollinger Bands and Donchian Channels Breakout model for generating Trade Entries. Visualizer uses the following three fundamental plot options from the settings that the user can choose from, to spot breakouts, support/resistance levels and the trading price range of the security.
1. Bollinger Bands
The 𝟏. 𝐁𝐨𝐥𝐥𝐢𝐧𝐠𝐞𝐫 𝐁𝐚𝐧𝐝𝐬 option plots the Bollinger Bands for the chart timeframe (default is 55 SMA with 1 standard Deviation). This can be changed by entering different values in BB Sᴛᴀɴᴅᴀʀᴅ Dᴇᴠɪᴀᴛɪᴏɴ and MA Lᴇɴɢᴛʜ ғᴏʀ BB/Dᴏɴᴄʜɪᴀɴ Cʜᴀɴɴᴇʟs .
To use a different Moving Average for the Bollinger Bands Basis line, uncheck 𝐒𝐌𝐀 𝐁𝐁 𝐨𝐧𝐥𝐲 - 𝐔𝐧𝐜𝐡𝐞𝐜𝐤 𝐟𝐨𝐫 𝐧𝐨𝐧-𝐒𝐌𝐀 𝐁𝐁
The option is enabled as default as it keeps the SMA as standard. Unchecking this option and choosing a different moving average out of the 15 MAs in the dropdown, the plot changes significantly for each. Also a warning label will appear on screen if Standard Deviation more than 1 is used for non standard MA for Bollinger Bands, as the settings must be tested for non-standard Bollinger Bands before planning to trade with it.
2. True Donchian Channels
The 𝟐. 𝐓𝐫𝐮𝐞 𝐃𝐨𝐧𝐜𝐡𝐢𝐚𝐧 𝐂𝐡𝐚𝐧𝐧𝐞𝐥𝐬 option plots Donchian Channels by inspecting the lookback lengths for highest highs and lowest lows of the user specified periods, which can be changed in Uᴘᴘᴇʀ Dᴏɴᴄʜɪᴀɴ Cʜᴀɴɴᴇʟ Lᴇɴɢᴛʜ and Lᴏᴡᴇʀ Dᴏɴᴄʜɪᴀɴ Cʜᴀɴɴᴇʟ Lᴇɴɢᴛʜ user input boxes from Visualizer settings.
3. Donchian Channels - MA and Non-MA Source
The 𝟑. 𝐃𝐨𝐧𝐜𝐡𝐢𝐚𝐧 𝐂𝐡𝐚𝐧𝐧𝐞𝐥𝐬 - 𝐌𝐀/𝐍𝐨𝐧-𝐌𝐀 𝐒𝐨𝐮𝐫𝐜𝐞 option plots modified Donchian Channels based on highest high and lowest low of Moving Average or the Source using user specified periods, which can be changed in Uᴘᴘᴇʀ Dᴏɴᴄʜɪᴀɴ Cʜᴀɴɴᴇʟ Lᴇɴɢᴛʜ , Lᴏᴡᴇʀ Dᴏɴᴄʜɪᴀɴ Cʜᴀɴɴᴇʟ Lᴇɴɢᴛʜ , MA Lᴇɴɢᴛʜ ғᴏʀ BB/Dᴏɴᴄʜɪᴀɴ Cʜᴀɴɴᴇʟs choosing the source plot from Sᴏᴜʀᴄᴇ and MA Type from MA ᴛʏᴘᴇ - (ғᴏʀ ᴘʟᴏᴛs 1 & 3) . For Donchian Channels plot of Non-MA Source, choose Use Source from MA ᴛʏᴘᴇ - (ғᴏʀ ᴘʟᴏᴛs 1 & 3) dropdown.
===================================================================================================================
╔═════════ 𝗠𝗔 𝗩𝗶𝘀𝘂𝗮𝗹𝗶𝘇𝗲𝗿 ═════════╗
MA Visualizer is a powerful and very useful original visual method to plot Moving Averages of the close price of the security for user specified look back period in a visually appealing style in the form of colour coded bands. MA Visualizer not only helps the trader spot the price action of the security relative to the moving average, but also paints a visual picture of the trend strength, which must be seen and used on chart to appreciate its elegance.
Activate 𝗠𝗔 𝗩𝗶𝘀𝘂𝗮𝗹𝗶𝘇𝗲𝗿 and choose the MA type from MA Vɪsᴜᴀʟɪᴢᴇʀ Tʏᴘᴇ dropdown and entering the lookback period in MA Vɪsᴜᴀʟɪᴢᴇʀ ᴘᴇʀɪᴏᴅ input box. MA Visualizer colour theme can be be changed from MA Vɪsᴜᴀʟɪᴢᴇʀ Cᴏʟᴏʀ Sᴄʜᴇᴍᴇ dropdown.
The faster of the two set of bands that form the MA Visualizer reacts to price action faster and can be clearly seen from its change of colour from Bull Colour to Bear Colour or viceversa earlier than the slower set of bands. The fill colour between the bands also helps the user stay in a trade or exit a trade based on other confirmators or filters included in ™TradeChartist Visualizer .
===================================================================================================================
╔═══════ 𝗦𝗶𝗴𝗻𝗮𝗹𝘀 𝗮𝗻𝗱 𝗙𝗶𝗹𝘁𝗲𝗿𝘀 ═══════╗
𝗦𝗶𝗴𝗻𝗮𝗹𝘀
Trade Signals can be enabled along with use of various filters from this heading in Visualizer settings. To plot Trade entry markers on chart when a trade signal is generated, enable 𝐁𝐁/𝐃𝐨𝐧𝐜𝐡𝐢𝐚𝐧 𝐂𝐡𝐚𝐧𝐧𝐞𝐥𝐬 𝐁𝐫𝐞𝐚𝐤𝐨𝐮𝐭 𝐒𝐢𝐠𝐧𝐚𝐥𝐬.
The script automatically detects the breakouts based on user specified settings under 𝗕𝗕 & 𝗗𝗼𝗻𝗰𝗵𝗶𝗮𝗻 𝗖𝗵𝗮𝗻𝗻𝗲𝗹𝘀. Trade Entries are plotted on the real-time breakout candle, so it is recommended to wait for bar close before taking a position in the direction of the breakout.
𝗙𝗶𝗹𝘁𝗲𝗿𝘀
Various Filters can be used from this heading to reduce noise and help make the trade decision more effective and eliminates unproductive trades when the price is ranging or during sideways movement.
To use Filters, enable 𝐔𝐬𝐞 𝐓𝐫𝐚𝐝𝐞 𝐅𝐢𝐥𝐭𝐞𝐫 and choose the Filters from under Tʀᴀᴅᴇ Fɪʟᴛᴇʀ 1 and Tʀᴀᴅᴇ Fɪʟᴛᴇʀ 2 . If --- is chosen, no filter will be used. Trade filter parameters can be changed from under 𝗙𝗶𝗹𝘁𝗲𝗿 𝗣𝗮𝗿𝗮𝗺𝗲𝘁𝗲𝗿𝘀 section of Visualizer settings. The two trade filter dropdowns enable traders to use upto 2 filters from the following.
══> MA filter - This filters entries after a breakout only if the close price had breached the MA price. Filter MA is based on the same settings as MA Visualizer. This MA used for Filter can also be plotted by enabling 𝐃𝐢𝐬𝐩𝐥𝐚𝐲 𝐌𝐀 𝐅𝐢𝐥𝐭𝐞𝐫 (𝐌𝐀 𝐕𝐢𝐬𝐮𝐚𝐥𝐢𝐳𝐞𝐫 𝐒𝐞𝐭𝐭𝐢𝐧𝐠𝐬). To view this MA plot clearly, disable MA Visualizer.
══> MA Visualizer filter - This filters entries after a breakout only if both set of MA Visualizer bands had turned into same colour (either Bull or Bear Colour) agreeing with the direction of the breakout.
══> RSI filter - This filters entries after a breakout only if the RSI had crossed above RSI - Lᴏɴɢ Eɴᴛʀʏ Fɪʟᴛᴇʀ for Longs or if RSI had crossed below RSI - Sʜᴏʀᴛ Eɴᴛʀʏ Fɪʟᴛᴇʀ .
══> Kumo Breakout filter - This filters entries after a breakout only if price had closed above or below the Kumo of the Ichimoku Cloud in the direction of the breakout.
══> Price crossing Kijun Sen - This filters entries after a breakout only if close price had crossed Kijun Sen or the Ichimoku Base Line in the direction of the breakout.
To visualize the Kumo Breakout or Price crossing Kijun Sen, Ichimoku Cloud can be plotted on chart by enabling 𝐃𝐢𝐬𝐩𝐥𝐚𝐲 𝐈𝐜𝐡𝐢𝐦𝐨𝐤𝐮 𝐂𝐥𝐨𝐮𝐝 from 𝗙𝗶𝗹𝘁𝗲𝗿 𝗣𝗮𝗿𝗮𝗺𝗲𝘁𝗲𝗿𝘀 section of Visualizer settings.
===================================================================================================================
╔═══ 𝗔𝘂𝘁𝗼𝗺𝗮𝘁𝗶𝗰 𝗟𝗲𝘃𝗲𝗹𝘀 𝗚𝗲𝗻𝗲𝗿𝗮𝘁𝗼𝗿 ════╗
Enabling 𝗔𝘂𝘁𝗼𝗺𝗮𝘁𝗶𝗰 𝗟𝗲𝘃𝗲𝗹𝘀 𝗚𝗲𝗻𝗲𝗿𝗮𝘁𝗼𝗿 plots support and resistance levels automatically without any input from the user other than preferred levels plot from the indicator settings namely,
Plot Local Levels for Lower TF - Plots all important Support/Resistance levels for mostly smaller time frames (can be used for up to 1hr in most cases). Recommended for Scalping/Swing Trading mostly dependent on volatility.
Plot Local Levels for Higher TF - Plots all important Support/Resistance levels inferred from mostly time frames - Short to Mid term outlook.
Use Trading View Data Window to make effective use of the levels.
===================================================================================================================
╔═════════ 𝗨𝘀𝗲𝗳𝘂𝗹 𝗘𝘅𝘁𝗿𝗮𝘀 ═════════╗
Volatility exhaustion is detected by the script and plots $ on bar highs for Long Trades and bar lows for Short Trades if Tᴀᴋᴇ Pʀᴏғɪᴛ Bᴀʀs is enabled.
Candles/Bars can be colored with Price action trend strength by enabling Vɪsᴜᴀʟɪᴢᴇʀ Cᴏʟᴏʀ Bᴀʀs and by choosing one of two themes from Bᴀʀ Cᴏʟᴏʀ Sᴄʜᴇᴍᴇ . Bar colors can also be inverted using Iɴᴠᴇʀᴛ Bᴀʀ Cᴏʟᴏʀs option.
To paint the background of the chart to spot trade zones, enable Tʀᴀᴅᴇ Zᴏɴᴇs Bᴀᴄᴋɢʀᴏᴜɴᴅ Fɪʟʟ .
Alerts
Alerts can be created for Long and Short entries by using Once Per Bar Close as Alert Frequency. Entries are generated on Real time bars based on Breakout and filter conditions. It is recommended to wait for bar close before taking a position based on Visualizer Trade Entries.
The indicator does not repaint and can be confidently used for alerts and trade entries without worrying about signals disappearing.
™TradeChartist Visualizer can also be connected to ™TradeChartist Plug and Trade to generate entries along with Targets, Stop Loss plots etc. Target and Stop Loss alerts can be created using Plug and Trade's Alerts system.
===================================================================================================================
There are several combinations of settings that can be tested on the security traded based on timeframe and risk/reward expectations. The indicator can be used for trade entries with filter combinations or can be used as standalone Visualizer for trend confirmations, levels etc. Following are a few examples using the Visualizer.
Example Charts
1. ETH-USDT 1hr chart using Bollinger Bands (55/1, SMA) with 89 period Hull MA as MA Visualizer filter for BB Entries.
2. AAPL 1hr chart using 34 period Donchian Channels with 89 period Zero-Lag EMA as MA Visualizer filter for Entries.
3.EUR-USD 1hr chart using 34 period Donchian Channels with 89 period TEMA as MA Visualizer Filter for Entries.
4. XBT Daily chart using 9/21 Donchian Channels with Kumo Breakout Filter and 34 period Hull MA Visualizer Filter for Entries connected to Plug and Trade.
5. LINK-USDT 1hr chart using 34 period Donchian Channels with 55 period LSMA MA Visualizer Filter for Entries with Ichimoku Cloud Plot.
===================================================================================================================
Best Practice: Test with different settings first using Paper Trades before trading with real money
===================================================================================================================
This is not a free to use indicator. Get in touch with me (PM me directly if you would like trial access to test the indicator)
Premium Scripts - Trial access and Information
Trial access offered on all Premium scripts.
PM me directly to request trial access to the scripts or for more information.
===================================================================================================================
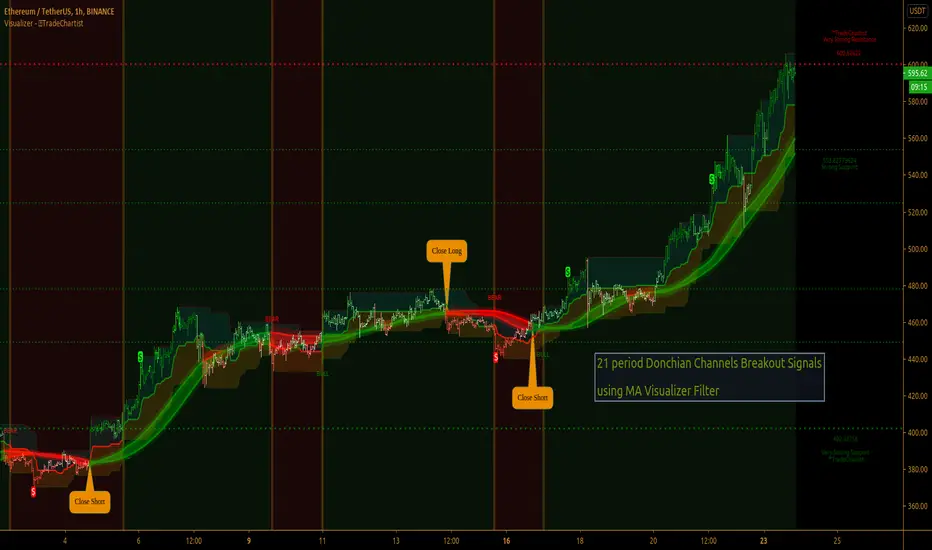
Computing FIR Filters Using Arrays [WMA Example]Over the years, many FIR filters have been proposed by the Pine community, with the standard way of computing them being `for` loops. The arrival of arrays allows for a new, more efficient way to compute them.
This script provides a template showing how you can compute FIR filters using Pine arrays.
FIR Filters
FIR stands for "Finite Impulse Response", and is associated with types of filters whose impulse response reaches a steady state.
FIR filters are calculated using convolution, or more simply put, using a weighted sum between a set of filter coefficients and past input values over a finite window.
In Pine, FIR filters are generally computed inside a `for` loop executing three processes:
1- Computing the coefficients.
2- Summing all the computed coefficients.
3- Performing the weighted sum between the inputs values and the computed coefficients.
Then we divide the result of our weighted sum by the sum of the coefficients obtained in step 2.
Because the computations inside the `for` loop execute on each bar, execution time can be significant when the calculation of coefficients is complex. This is where arrays are handy, as we can compute the coefficients just once, store them into an array, and use them in a weighted sum without the need to recalculate them over and over. This drastically reduces the computation time required to calculate a FIR filter.
The new `array.sum()` function helps eliminate step 2, thus further decreasing computation time.
How to Use This Template
All you need to do is to put the code that computes your coefficients in the first `for` loop (variable `w`). If the code that computes your coefficients contains more than one line, just make sure your final coefficient is placed in variable `w` (or change the `value` argument in `array.push()`). Another option is to declare a function that computes the coefficients and use it instead of variable `w`.
Look first. Then leap.

Ehlers 3 Pole Butterworth Filter V2 [CC]The 3 Pole Butterworth Filter was created by John Ehlers (Cybernetic Analysis For Stocks And Futures pgs 196-197) and this indicator is a moving average that also works well as a trendline. Buy when the indicator line turns green and sell when it turns red.
Let me know if you would like me to publish other indicators or if you want something custom done!
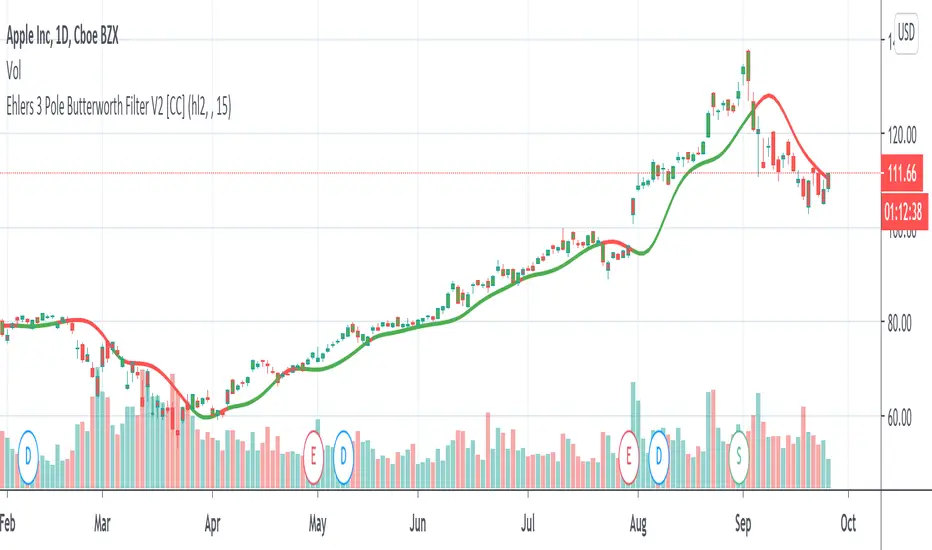
Ehlers 2 Pole Super Smoother Filter V2 [CC]The 2 Pole Super Smoother Filter was created by John Ehlers (Cycle Analytics For Traders pg 32) and this follows the price very closely and very useful because it is consistent with uptrends and falls sharply during a sudden downtrend so it should be able to help you stay more profitable. Buy when the indicator line turns green and sell when it turns red.
Let me know if there are other indicators you would like to see me publish or if you want something custom done!

Dynamic Equalizer [DW]This is an experimental study inspired by techniques primarily utilized in the visual and audio processing worlds.
This study is designed to serve as a pre or post processing filter designer that allows you to shape the frequency spectrum of your data on a more "in-depth" level.
First the data is fed through my Band-Shelf Equalizer function.
The EQ in this script works by dividing the input signal into 6 bands and 2 shelves using a series of roofing filters.
The bands are then gain adjusted recursively (in %) to match source as closely as possible at unity gain.
The recursive adjustment size can be changed using the "Gain Adjustment Increment" input, which will affect how tightly the resulting filter approximates source at unity.
The frequency range of each band is adjustable via the period inputs. In default settings, these are the ranges:
-> Low Shelf : 256+ Samples Per Cycle. This shelf is the largest trend component of the signal. Unlike the other bands and shelf, this shelf is not zero mean unless source data is.
-> Band 1 : 128 - 256 Samples Per Cycle. This band is a moderate trend and low cyclic component of the signal.
-> Band 2 : 64 - 128 Samples Per Cycle. This band is a mild trend and moderate cyclic component of the signal.
-> Band 3 : 32 - 64 Samples Per Cycle. This band is a high cyclic component of the signal.
-> Band 4 : 16 - 32 Samples Per Cycle. This band is a high cyclic component of the signal.
-> Band 5 : 8 - 16 Samples Per Cycle. This band is a moderate cyclic and mild to moderate noise component of the signal.
-> Band 6 : 4 - 8 Samples Per Cycle. This band is a high noise component of the signal.
-> High Shelf : 4- Samples Per Cycle. This shelf is primarily noise.
Each band and shelf can be manually gain adjusted via their respective inputs.
After EQ processing, each band and shelf is then optionally fed through my Peak Envelope Compressor function for dynamics control.
The compressor in this script works by reducing band power by a specified percentage when it exceeds a user defined percentage of the peak envelope.
The peak envelope measures maximum power of the band over its period range multiplied by a user defined integer.
There is an option included to apply Butterworth smoothing to the envelope as well, which will alter the shape of the compressor.
If you want an envelope that quickly responds to power peaks, use little to no smoothing. If you desire something more static, use a large smoothing period.
Attack and release are included in the algorithm to shape the sensitivity of the compressor.
Attack controls how many bars it takes from being triggered for attenuation to reach its target amount.
Release controls how many bars it takes from being un-triggered for attenuation to reach back to 0.
In addition, the compressor is equipped with parallel processing.
The "Parallel Mix" inputs control the amount of compressed vs non-compressed signal presence in the final output.
And of course, the compressor has a post-processing gain input (in %) to fine-tune the presence of the band.
For easy visual tuning, you can view each independent band's magnitude or power by selecting them in the display inputs.
This display setup can also be beneficial analytically if you wish to analyze specific frequency components of the source signal.
The default preset for this script is meant to show how versatile EQ filtering and compression can be for technical analysis.
The EQ preset detrends the data, moderately smooths the data, and emphasizes dominant cyclical ranges.
The compression preset provides fast, moderately heavy shaping to dial in dynamics and reduce transient effects.
The resulting curve is a great filter for responsively analyzing cyclical momentum.
The script is also fully equipped with outputs that can be used externally by other scripts.
You can integrate these external outputs with your own script by using a source input. Simply select the desired output from the dropdown tab on your script.
Multiband filtering and compression are concepts that are not conventionally used in the world of finance.
However, the versatile capabilities of these concepts make this a wonderful tool to have in the arsenal.
By surgically adjusting separate frequency components of a signal, you're able to design a wide variety of filters with unique responses for a vast array of applications.
Play around with the settings and see what kinds of filters you can design!
---------------------------------------------------------
This is a premium script, and access is granted on an invite-only basis.
To gain access, get a copy of the script overview, or for additional inquiries, send me a direct message.
I look forward to hearing from you!
---------------------------------------------------------
General Disclaimer:
Trading stocks, futures, Forex, options, ETFs, cryptocurrencies or any other financial instrument has large potential rewards, but also large potential risk.
You must be aware of the risks and be willing to accept them in order to invest in stocks, futures, Forex, options, ETFs or cryptocurrencies.
Don’t trade with money you can’t afford to lose.
This is neither a solicitation nor an offer to Buy/Sell stocks, futures, Forex, options, ETFs, cryptocurrencies or any other financial instrument.
No representation is being made that any account will or is likely to achieve profits or losses of any kind.
The past performance of any trading system or methodology is not necessarily indicative of future results.
---------------------------------------------------------
NOTE: Unlike standard tools of this nature in other applications, I scaled the signals in % rather than dB, mainly since it's proven so far to be more user-friendly to keep things linear on here.
In addition, no transitions to frequency domain are done in this script. This EQ is an experimental variant that processes in the time domain and relies on a network of roofing filters.
When changing cutoff periods, make sure they are organized in descending order with low shelf as the highest period, and high shelf as the lowest period.
Using non-descending lengths may result in an undesired output.
Lastly, when changing cutoff periods, parts of the spectrum may leak slightly differently between bands, so the "Gain Match Adjustment Increment" may need to be changed as well if you want it to match as closely as possible at unity.
Despite these shortcomings, this tool functions surprisingly well, especially with the default periods, and it's quickly become one of my favorites. I hope you all enjoy it!
