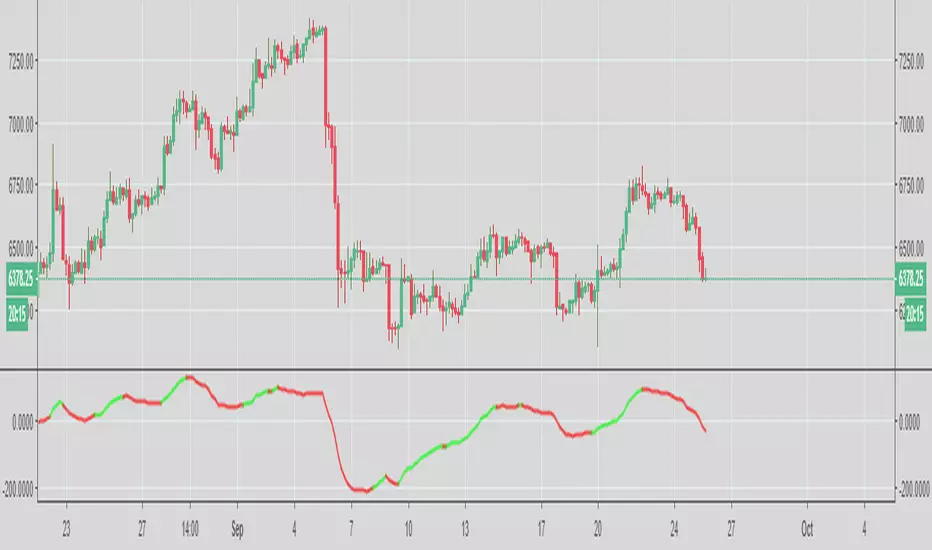
VJ_Holy_Trendline_IndicatorCan be used on any timeframe.
Gives you an idea of the overall trend.
Idea courtesy -> @shane73
Red indicates - Downtrend
Green indicates - Uptrend
Fomo
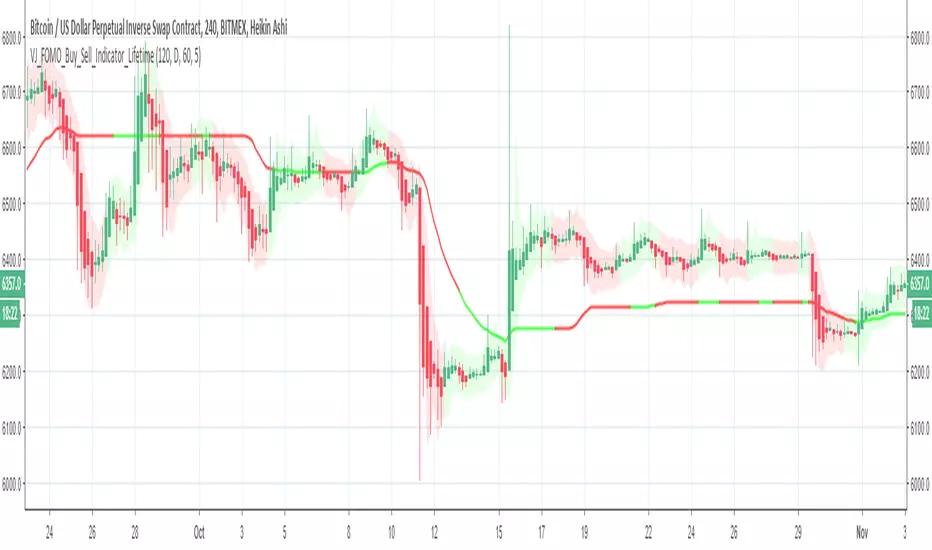
VJ_Holy_Grail_Scalper_Swing_Trader_v1// Added Scalper and Swing Trader in 1 indicator to help those who are using free version on TV
// Added Alerts for Scalp Buy/Sell, Swing Buy/Sell and TP alerts(for both scalper and swing trader) to work with Autoview


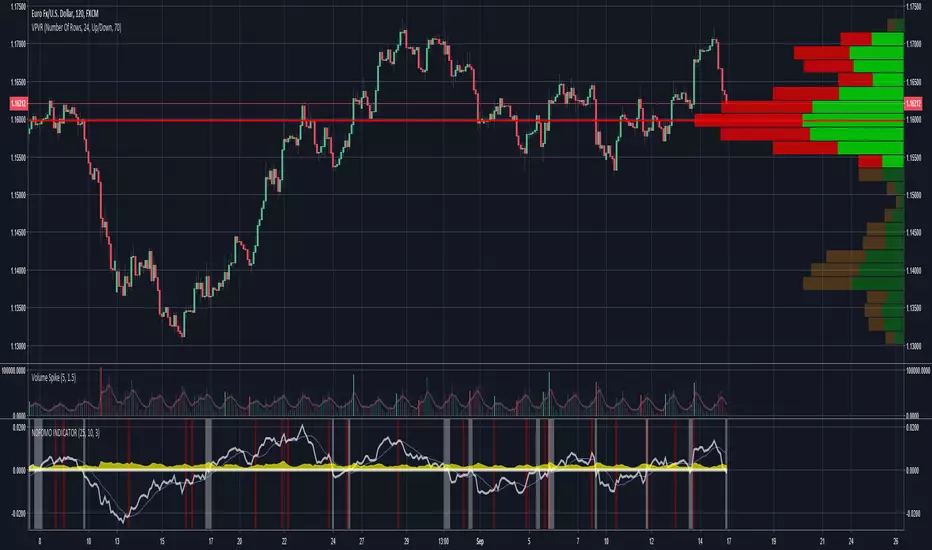
NOFOMO INDICATORNOFOMO Indicator
ABOUT:
This indicator can be used in conjunction with alerts to detect shifts in Momentum, which usually occur before volatility. ATR (Average True Range) is included as a measurement of volatility.
Momentum(White Line)
Zero Line(White Line)
Momentum SMA(Blue Line)
Average True Range(Yellow Area)
Momentum Crossover Momentum SMA(Red Highlight)
Momentum Cross Zero Line(White Highlight)
BASIC USE FOR TRADING:
Suggested Time-Frame: 30m, 1h, 2h, 4h
When Momentum crosses the “0” line this indicates a strong change in price action. You can observe price begin or continue to go UP after Momentum crosses the “0” line from the downside, moving upward. Likewise for downward movement as well. If you observe Momentum cross the “0” line from the upside moving downward, you will observe price begin or continue to move downward.
Prior to Momentum crossing the “0” line we can observe Momentum crossing over a light blue line, the SMA. Momentum crossing over the SMA indicates the initial change in price action and in some cases, can be used to verify or signal entry. One could theoretically use the Momentum/SMA cross as an alert, the Momentum crossing the “0” line as entry. One could also theoretically use a volume spike as an alert and the Momentum/SMA cross for entry. The point is that this indicators can be used in confluence with other indicators, and it can be used in various ways.
The most effective way to use either of the crosses (MOM/SMA or MOM/0 line) is to verify them against analyzing volume. Lets say you are using the MOM/SMA cross as an alert, and the momentum crossing “0” line as your entry signal. Once alerted, you will observe that Momentum has crossed the SMA and is heading toward the “0” line. Studying the price action and the volume bars, you can determine if the current price action has enough “fuel” to push momentum through the “0” line and begin its new trend.
The easiest way to analyze the volume for validity is to look for ascending volume bars that “grow” in proportion to price. For example a long candle stick should be associated with a tall volume bar, and a small candle stick should be associated with a short volume bar. This is not always the case though and further studies in to volume price analysis will be required on your end if you wish to use this indicator effectively with volume.
Authors: Sheldon#7775 & Walshdil#8568 (Discord)
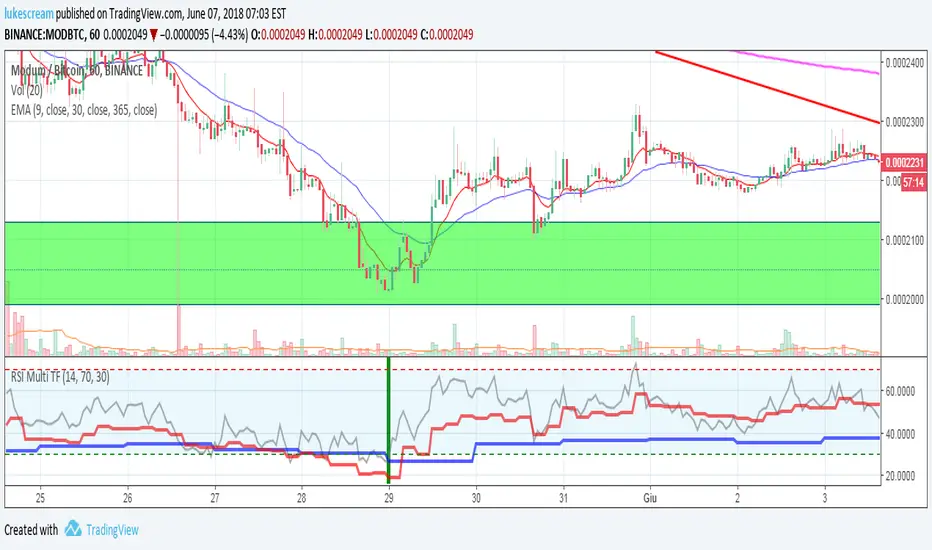
RSI Multi Time Frame - Spot Panic Sell Moments and profit!Union of three RSI indicators: 1h, 4h and daily. In order to show 1h RSI, you have to set it as active time frame on the chart.
Purpose: spot "triple oversold" moments, where all the three RSI are under the threshold, which is 30 by default but editable.
Target Market: Cryptocurrencies. Didn't try it on other ones, may work as well. Fits Crypto well as, by experience, I can tell it usually doesn't stay oversold for long.
When the market panics and triple oversold occurs, the spot is highlighted by a green vertical bar on the indicator.
The indicator highlights triple overbought conditions as well (usually indicating strong FOMO), but I usually don't use it as a signal.
I suggest to edit the oversold threshold in order to make it fit the coin you're studying, minimizing false positives.
Special thanks to Heavy91, a Discord user, for inspiring me in this indicator.
Any editing proposal is welcome!
I reposted this script, as the first time I wrote it in Italian. Sorry for that.
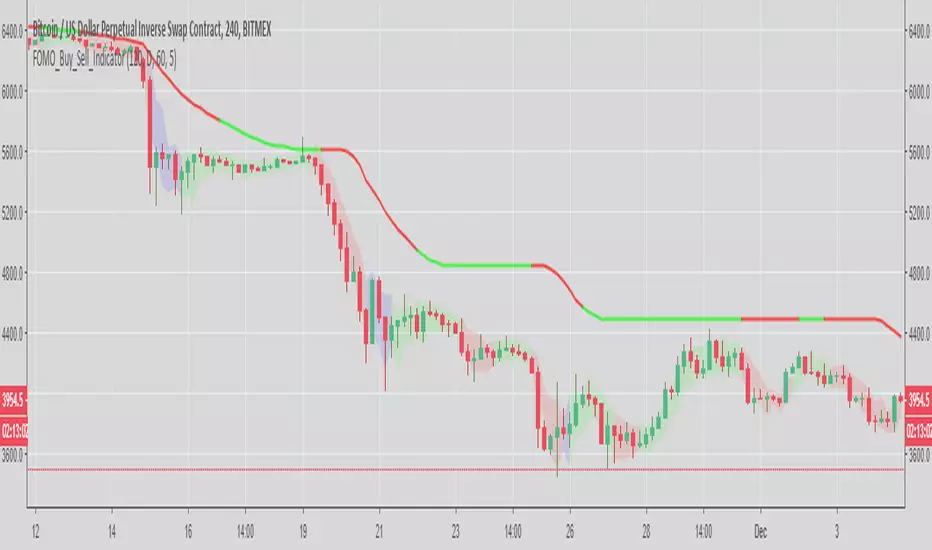
FOMO_Buy_Sell_IndicatorBuy and sell indicator that fits everyone's needs.
For noobs - You can use it even if you are not TA friendly. Green is buy and Red is sell.
For pros - It helps you second guess your ins and outs.
PM to gain access, please. Thanks