Malama's Institutional Liquidity & Price Action Concepts [ILPAC]Malama's Institutional Liquidity & Price Action Concepts is a comprehensive trading suite that unifies the three pillars of institutional analysis: Market Structure (Context), Liquidity (Targets), and Momentum (Triggers).
Justification for this Combination (The Mashup): Many traders clutter their screens with separate indicators for BOS/CHoCH, Liquidity Runs, and RSI divergences. This fragmentation makes it difficult to see the full narrative. ILPAC solves this by fusing these concepts into a single logic engine. By combining structure with liquidity heatmaps, the script allows you to see where price is going (Liquidity) and when the trend has shifted (Structure) without conflicting visual noise.
Optimizations & Fixes in This Version:
Unified Garbage Collection: Previous iterations of complex scripts often suffer from memory leaks. This version runs a global cleanup function every bar to manage lines and labels, ensuring smooth performance even on lower timeframes.
State-Machine BOS Logic: The Break of Structure (BOS) logic has been upgraded to a state machine. It tracks "Active Pivot Levels" and only fires a signal when a level is physically broken by a close, preventing repainting or flickering signals during live candles.
Physical Liquidity Sweeps: The Liquidity Heatmap now calculates the physical height of the zone in ticks. A zone is only considered "Swept" (mitigated) if price penetrates the interior of the box, not just touches the edge.
Deduplicated Psychological Levels: The logic for round numbers (Psychological Levels) now scans existing drawings to prevent stacking duplicate lines on top of each other when price consolidates around a key level.
Concepts & Underlying Calculations:
Market Structure: Identifies Swing Highs and Lows using a customizable lookback. A "Change of Character" (CHoCH) is flagged when the trend state flips from Bullish to Bearish (or vice versa), while a "Break of Structure" (BOS) indicates trend continuation.
Liquidity Heatmap: Automatically identifies unmitigated swing points where stop-losses are likely clustered. These are drawn as dynamic boxes that extend until price sweeps them.
FOMO Bubbles: A proprietary momentum filter that combines RSI extremes (Overbought/Oversold) with Volume Spikes (Volume > 2x Average). These bubbles highlight moments of retail panic or euphoria, often marking local tops or bottoms.
Auto-Trendlines: Connects the most recent non-breached pivots to project dynamic support and resistance channels.
How to Use:
Identify the Trend: Look for the Market Structure labels (HH, LL) and the colored structure lines (Green for Bullish, Red for Bearish).
Find the Target: Look for the Gold (High) or Blue (Low) Liquidity Zones. Price often gravitates toward these areas to clear liquidity before reversing.
Spot the Trigger: Use the FOMO Bubbles or Trendline Breakouts as your entry confirmation once price reaches a liquidity zone.
Disclaimer: This indicator is for educational analysis only. Past performance does not guarantee future results.
Fomo

Liquidity Sweep Guardian (Universal % or point based)
Liquidity Sweep Guardian - Complete User Guide
## Overview
The **Liquidity Sweep Guardian** is a visual warning system designed to prevent premature counter-trend trades (fades) near Previous Day High (PDH) and Previous Day Low (PDL) levels. This indicator helps you avoid one of the most common trading mistakes: fading too early before liquidity sweeps complete.
---
## 🎯 Core Trading Principle
### **THE GOLDEN RULE: Don't Fade Until It's Unlocked**
Price often **accelerates into key levels** to sweep liquidity before reversing. Trading against this momentum is extremely dangerous.
**The Process:**
1. **Danger Zone** (Red/White Box) = ⚠️ **DO NOT FADE** - Sweep likely incoming
2. **Sweep Occurs** (Triangle marker appears) = Price penetrates the level
3. **Reclaim Happens** (Price returns above/below level) = Level is tested
4. **🔓 UNLOCKED** (Gold border, green label) = **NOW you may CONSIDER a fade**
> **Important:** "UNLOCKED" means you may now *consider* a fade setup. It is NOT a trade signal itself. You still need your entry confirmation, risk management, and trade plan.
---
## 📊 Visual Elements Explained
### 1. **Danger Zone Boxes (Red Border by Default)**
**Two types of zones around PDH/PDL:**
- **Outer Danger Zone** (White fill): ±75pts (or 0.30%) around the level
- Indicates proximity to a key level where sweeps commonly occur
- Yellow/cautious trading zone
- **Inner Critical Zone** (Black fill): ±25pts (or 0.10%) around the level
- Highest probability area for liquidity sweep traps
- Avoid fading here at all costs
**What to do:**
- When price enters these zones, **wait and watch**
- Do not initiate counter-trend positions
- Allow the sweep to play out
### 2. **Unlocked Zones (Gold Border #ffeb3b)**
When a zone turns **gold/yellow** with green fill:
- The level has been swept AND reclaimed
- The liquidity grab is complete
- You may now look for fade opportunities with proper confirmation
### 3. **PDH/PDL Lines**
- **PDH Line** (Red): Previous Day High with price label
- **PDL Line** (Green): Previous Day Low with price label
- These are your key reference levels for the session
### 4. **Sweep Labels**
**Triangle Markers (SWEEP):**
- **Green Triangle** = Clean sweep (10-25pts penetration)
- **Orange Triangle** = Extended sweep (25-50pts penetration)
- **Red Triangle** = Deep penetration (50+ pts) - likely continuation, not reversal
**Warning Labels:**
- **⚠️ DEEP CONTINUATION?** = Penetration too deep, probably NOT a reversal setup
**Unlock Labels:**
- **🔓 LONG UNLOCKED** = PDL swept and reclaimed, may consider long fades
- **🔓 SHORT UNLOCKED** = PDH swept and reclaimed, may consider short fades
---
## ⚙️ Settings Guide
### **Calculation Mode**
**Use Percentage Mode (Default: ON)**
- ✅ **Enabled**: Universal mode - works on NQ, ES, RTY, stocks, crypto, forex
- ❌ **Disabled**: Fixed points mode - for specific instruments only
**When to use each:**
- **Percentage Mode**: Trading multiple instruments, or instruments with varying price levels
- **Fixed Points Mode**: Single instrument focus (e.g., only trading NQ at current levels)
### **Danger Zone Settings**
**Percentage Mode (Default for Universal Use):**
- **Danger Zone**: 0.30% each side (≈75pts on NQ@25,000)
- **Critical Zone**: 0.10% each side (≈25pts on NQ@25,000)
**Fixed Points Mode (For NQ Specifically):**
- **Danger Zone**: 75 points each side
- **Critical Zone**: 25 points each side
**Adjustment Tips:**
- For more volatile instruments: Increase percentages/points
- For less volatile instruments: Decrease percentages/points
- For higher timeframes: Use wider zones
- For lower timeframes: Use tighter zones
### **Sweep Classification**
**What defines a "real" sweep:**
- **Minimum**: 10pts / 0.04% - Shallow penetration may not grab enough liquidity
- **Optimal**: 10-25pts / 0.04-0.10% - "Goldilocks zone" for reversal setups
- **Extended**: 25-50pts / 0.10-0.20% - Deeper sweep, less reliable
- **Continuation**: 50+pts / 0.20%+ - Too deep, likely NOT reversing
**Max Bars for Reclaim**: 5 bars (default)
- Price should reclaim the level relatively quickly
- If it takes too long, the sweep may have failed
### **Visual Customization**
**Box Settings:**
- **Left Extension**: 60 bars (how far back the box extends)
- **Right Extension**: 50 bars (how far forward the box extends)
**Toggle Options:**
- Show/Hide Danger Zone Boxes
- Show/Hide PDH/PDL Lines
- Show/Hide Price Labels on lines
- Show/Hide Sweep Labels
- Show/Hide Unlock Labels
### **Color Customization**
All colors are fully customizable:
- Danger Zone Fill & Border
- Critical Zone Fill & Border
- Unlocked Zone Fill & Border
- PDH/PDL Line Colors
- PDH/PDL Label Colors
- Border Widths (1-5 pixels)
- Line Widths (1-5 pixels)
---
## 🎓 Trading Strategy Examples
### **Example 1: Long Setup at PDL**
1. **Morning**: Price approaches PDL (danger zone appears)
2. **Don't Fade Yet**: Price enters critical zone - resist urge to buy
3. **Sweep**: Price drops 15pts below PDL (green triangle appears)
4. **Reclaim**: Price closes back above PDL within 3 bars
5. **🔓 UNLOCKED**: Gold border + "LONG UNLOCKED" label appears
6. **Trade Setup**: Now look for bullish confirmation (order flow, structure, etc.)
### **Example 2: Avoiding a Trap at PDH**
1. **Afternoon**: Price rallies into PDH danger zone
2. **Temptation**: You want to short here (it "looks toppy")
3. **Sweep**: Price breaks 50pts above PDH (red triangle + ⚠️ warning)
4. **Continuation**: Deep penetration suggests continuation, not reversal
5. **Result**: No unlock occurs, price keeps running higher - trap avoided!
### **Example 3: Failed Unlock (No Trade)**
1. Price sweeps PDL by 12pts (green triangle)
2. Price struggles to reclaim PDL, stays below for 10+ bars
3. No "UNLOCKED" label appears
4. **Correct Action**: Do not fade - sweep failed to reclaim
---
## 📱 Alerts
The indicator includes built-in alerts for:
- **Entering Danger Zones**: Get warned when price approaches PDH/PDL
- **Sweep Detection**: Know immediately when a level is swept
- **Unlock Signals**: Get notified when fade setups become available
- **Continuation Warnings**: Alert when penetration suggests continuation
**To Set Alerts:**
1. Right-click indicator → "Add Alert"
2. Select desired alert condition
3. Configure notification preferences
---
## ⚠️ Important Disclaimers
### **What This Indicator IS:**
✅ A visual warning system to prevent premature fades
✅ A tool to identify when liquidity sweeps have completed
✅ A framework for counter-trend trade timing
### **What This Indicator IS NOT:**
❌ A complete trading system
❌ An entry signal generator
❌ A guarantee of trade success
❌ A substitute for proper risk management
### **Always Remember:**
- "UNLOCKED" = You may CONSIDER a fade (not a signal to trade)
- You still need your own entry confirmation
- You still need proper stop placement
- You still need position sizing and risk management
- Not every unlock leads to a successful trade
- Market context and order flow still matter
---
## 🔧 Recommended Settings by Instrument
### **NQ (Nasdaq-100 E-mini Futures)**
- Mode: Percentage or Fixed Points
- Percentage: 0.30% / 0.10% (default)
- Fixed Points: 75pts / 25pts (default)
### **ES (S&P 500 E-mini Futures)**
- Mode: Percentage
- Danger: 0.25% / Critical: 0.08%
- Or Fixed Points: 15pts / 5pts
### **RTY (Russell 2000 E-mini Futures)**
- Mode: Percentage
- Danger: 0.35% / Critical: 0.12%
- Or Fixed Points: 8pts / 3pts
### **Stocks (High Volume Large Caps)**
- Mode: Percentage (recommended)
- Danger: 0.20-0.40% / Critical: 0.08-0.15%
- Adjust based on ATR and volatility
### **Crypto (BTC, ETH)**
- Mode: Percentage (essential)
- Danger: 0.40-0.60% / Critical: 0.15-0.20%
- Higher volatility requires wider zones
---
## 💡 Pro Tips
1. **Use on Higher Timeframes**: Works best on 5min, 15min, 1hr charts
2. **Combine with Order Flow**: Use with footprint/delta for confirmation
3. **Watch Volume**: Strong volume on sweep = better reversal potential
4. **Consider Time of Day**: Sweeps during RTH often more reliable
5. **Multiple Timeframes**: Check if higher TF also shows unlock
6. **Don't Force Trades**: Not every session produces clean setups
7. **Journal Results**: Track which unlock types work best for you
8. **Respect Continuation Signals**: When indicator says "too deep," listen
---
## 🆘 Troubleshooting
**Q: Box isn't showing up**
A: Check that "Show Danger Zone Boxes" is enabled in Visual Settings
**Q: No price on labels**
A: Enable "Show Price Labels on Lines" in Visual Settings
**Q: Zones seem too tight/wide**
A: Adjust Danger Zone % or points based on current volatility
**Q: Getting too many/too few unlocks**
A: Adjust sweep classification thresholds (min/max penetration)
**Q: Want thicker/thinner lines**
A: Adjust line widths in "PDH/PDL Line Colors" section
**Q: Colors not matching my chart theme**
A: Fully customize all colors in the color settings groups
---
## 📚 Additional Resources
- Study price action around PDH/PDL on your instruments
- Learn about liquidity sweeps and stop hunts
- Understand market structure and order flow
- Practice identifying setups on replay/historical data
- Keep a trading journal of unlock scenarios
---
*Remember: The best trade is often the one you don't take. This indicator helps you avoid the trades you shouldn't take, so you can focus on the ones you should.*

Dumb Money Flow - Retail Panic & FOMO# Dumb Money Flow (DMF) - Retail Panic & FOMO
## 🌊 Overview
**Dumb Money Flow (DMF)** is a powerful **contrarian indicator** designed to track the emotional state of the retail "herd." It identifies moments of extreme **Panic** (irrational selling) and **FOMO** (irrational buying) by analyzing on-chain data, volume anomalies, and price velocity.
In crypto markets, retail traders often buy the top (FOMO) and sell the bottom (Panic). This indicator helps you do the opposite: **Buy when the herd is fearful, and Sell when the herd is greedy.**
---
## 🧠 How It Works
The indicator combines multiple data points into a single **Sentiment Index** (0-100), normalized over a 90-day period to ensure it always uses the full range of the chart.
### 1. Panic Index (Bearish Sentiment)
Tracks signs of capitulation and fear. High values contribute to the **Panic Zone**.
* **Exchange Inflows:** Spikes in funds moving to exchanges (preparing to sell).
* **Volume Spikes:** High volume during price drops (panic selling).
* **Price Crash (ROC):** Rapid, emotional price drops over 3 days.
* **Volatility (ATR):** High market nervousness and instability.
### 2. FOMO Index (Bullish Sentiment)
Tracks signs of euphoria and greed. High values contribute to the **FOMO Zone**.
* **Exchange Outflows:** Funds moving to cold storage (HODLing/Greed).
* **Profitable Addresses:** When >90% of holders are in profit, tops often form.
* **Parabolic Rise:** Rapid, unsustainable price increases.
---
## 🎨 Visual Guide
The indicator uses a distinct color scheme to highlight extremes:
* **🟢 Dark Green Zone (> 80): Extreme FOMO**
* **Meaning:** The crowd is euphoric. Risk of a correction is high.
* **Action:** Consider taking profits or looking for short entries.
* **🔴 Dark Burgundy Zone (< 20): Extreme Panic**
* **Meaning:** The crowd is capitulating. Prices may be oversold.
* **Action:** Look for buying opportunities (catching the knife with confirmation).
* **🔵 Light Blue Line:**
* The smoothed moving average of the sentiment, helpful for seeing the trend direction.
---
## 🛠️ How to Use (Trading Strategies)
### 1. Contrarian Reversals (The Primary Strategy)
* **Buy Signal:** Wait for the line to drop deep into the **Burgundy Panic Zone (< 20)** and then start curling up. This indicates that the worst of the selling pressure is over.
* **Sell Signal:** Wait for the line to spike into the **Green FOMO Zone (> 80)** and then start curling down. This suggests buying exhaustion.
### 2. Divergences
* **Bullish Divergence:** Price makes a **Lower Low**, but the DMF Indicator makes a **Higher Low** (less panic on the second drop). This is a strong reversal signal.
* **Bearish Divergence:** Price makes a **Higher High**, but the DMF Indicator makes a **Lower High** (less FOMO/buying power on the second peak).
### 3. Trend Confirmation (Midline Cross)
* **Crossing 50 Up:** Sentiment is shifting from Fear to Greed (Bullish).
* **Crossing 50 Down:** Sentiment is shifting from Greed to Fear (Bearish).
---
## ⚙️ Settings
* **Data Source:** Defaults to `INTOTHEBLOCK` for on-chain data.
* **Crypto Asset:** Auto-detects BTC/ETH, but can be forced.
* **Normalization Period:** Default 90 days. Determines the "window" for defining what is considered "Extreme" relative to recent history.
* **Weights:** You can customize how much each factor (Volume, Inflows, Price) contributes to the index.
---
**Disclaimer:** This indicator is for educational purposes only. "Dumb Money" analysis is a probability tool, not a crystal ball. Always manage your risk.
**Indicator by:** @iCD_creator
**Version:** 1.0
**Pine Script™ Version:** 6
---
## Updates & Support
For questions, suggestions, or bug reports, please comment below or message the author.
**Like this indicator? Leave a 👍 and share your feedback!**

Climax Absorption Engine [AlgoPoint]Overview
Have you ever noticed that during a sharp, fast-moving trend, the single candle with the highest volume often appears right at the end, just before the price reverses? This is no coincidence. It's the footprint of a Climax Event.
This indicator is designed to detect these critical moments of maximum panic (capitulation) and maximum euphoria (FOMO). These are the moments when retail traders are driven by emotion, creating a massive pool of liquidity. The "Climax Absorption Engine" identifies when Smart Money is likely absorbing this liquidity to enter large positions against the crowd, right before a potential reversal.
It's a tool built not just on mathematical formulas, but on the principles of market psychology and smart money activity.
How It Works: The 3-Step Logic
The indicator uses a sequential, three-step process to identify high-probability reversal setups:
1. Momentum Move Detection: First, the engine identifies a period of strong, directional momentum. It looks for a series of consecutive, same-colored candles and confirms that the move is backed by a steeply sloped moving average. This ensures we are only looking for climactic events at the end of a significant, non-random move.
2. Climax Candle Identification: Within this momentum move, the indicator scans for a candle with abnormally high volume—a volume spike that is significantly larger than the recent average. This candle is marked on your chart with a diamond shape and is identified as the Climax Candle. This is the point of peak emotion and the primary area of interest. No signal is generated yet.
3. Absorption & Reversal Confirmation: A climax is a warning, not a signal. The final signal is only triggered after the market confirms the reversal.
- For a BUY Signal: After a bearish (red) Climax Candle, the indicator waits for a subsequent green candle to close decisively above the midpoint of the Climax Candle. This confirms that the panic selling has been absorbed by buyers.
- For a SELL Signal: After a bullish (green) Climax Candle, it waits for a subsequent red candle to close decisively below the midpoint. This confirms that the euphoric buying has evaporated.
How to Interpret & Use This Indicator
- The Diamond Shape: A diamond shape on your chart is an early warning. It signifies that a climax event has occurred and the underlying trend is exhausted. This is the time to pay close attention and prepare for a potential reversal.
- The BUY/SELL Labels: These are the final, actionable signals. They appear only after the reversal has been confirmed by price action.
- A BUY signal suggests that capitulation selling is over, and buyers have absorbed the pressure.
- A SELL signal suggests that FOMO buying is over, and sellers are now in control.
Key Settings
- Momentum Detection: Adjust the number of consecutive bars and the EMA slope required to define a valid momentum move.
- Climax Detection: Fine-tune the sensitivity of the volume spike detection using the Volume Multiplier. Higher values will find only the most extreme events.
- Confirmation Window: Define how many bars the indicator should wait for a reversal candle after a climax event before the setup is cancelled.

FOMO Indicator - % of Stocks Above 5-Day AvgThe FOMO Indicator plots the breadth indicators NCFD and S5FD below the price chart, representing the percentage of stocks in the Nasdaq Composite (NCFD) or S&P 500 (S5FD) trading above their respective 5-day moving averages.
This indicator identifies short-term market sentiment and investor positioning. When over 85% of stocks exceed their 5-day averages, it signals widespread buying pressure and potential FOMO (Fear Of Missing Out) among investors. Conversely, levels below 15% may indicate oversold conditions. By analyzing these breadth metrics over a short time window, the FOMO Indicator helps traders gauge shifts in investor sentiment and positioning.

FOMO Alert (Miu)This indicator won't plot anything to the chart.
Please follow steps below to set your alarms based on price range variation:
1) Add indicator to the chart
2) Go to settings
3) Choose timeframe which will be used to calculate bars
4) Choose how many bars which will be used to calculate max and min range
5) Choose max and min range variation (%) to trigger alerts
5) Choose up to 6 different symbols to get alert notification
6) Once all is set go back to the chart and click on 3 dots to set alert in this indicator, rename your alert and confirm
7) You can remove indicator after alert is set and it'll keep working as expected
What does this indicator do?
This indicator will generate alerts based on following conditions:
- If min and max prices reach the range (%) from amount of bars on timeframe set for any symbol checked it will trigger an alert.
- If next set of bars reaches higher range than before it will trigger an alert with new data
- If next set of bars doesn't reach higher range than before it will not trigger alerts, even if they are above the range set (this is to prevent the alert to keep triggering with high frequency)
Once condition is met it will send an alert with the following information:
- Symbol name (e.g: BTC, ETH, LTC)
- Range achieved (e.g: 3,03%)
- Current symbol price and current bar direction (e.g: 63,477.1 ▲)
This script will request lowest and highest prices through request.security() built-in function from all different symbols within the range set. It also requests symbols' price (close) and amount of digits (mintick) for each symbol to send alerts with correct value.
This script was developed with main purpose to send alerts when there are strong price movements and I decided to share with community so anyone can set different parameters for different purposes.
Feel free to give feedbacks on comments section below.
Enjoy!

Market Condition DetectorThis script allows to change the background color of the main chart to green or red depending on the following factors:
Based on the QQQ graph whatever ticker you are watching
- Price > EMA20 Da
- Net New Highs > 0
- 10EMA Da > 20 EMA Da
When you are trading Break-Out, EP or other similar trades you will need the market at your back to improve both the winrate and the risk reward ratio.
This is a very useful tool if you struggle with the FOMO biais. It will help you detect the trend at a glance.
Remember that the top best trader are waiting for their trade to work and only after getting some traction, and only then will they take the next trade.
I also proceeded to find a formula that make the indicator be the smoother possible with the less possible amount of noise.
/!\ This indicator is intended for use on daily charts . /!\

Fear Of Missing Out grid of forex tradingAbstract
This script finds potential safe grids placing limit orders without fear of missing out.
This script computes grids according to power of 1.0025 .
You can reference those price levels for your trading.
Introduction
Grid trading is a popular trading method.
Traders plan several price levels as grids and repeat buying at lower grids and selling at higher grids.
Grids can be round number like multiple of 100 pips.
Grids can also be support and resistance according to price history.
Some traders may think they need to adjust grids to trade.
However, there are several problems in choosing grids.
One problem is rate of change is related and therefore exponential. 20 to 30 is different from 30 to 40.
Another interesting point is there are some special impressing reversal price levels.
Several months ago, I had a question why usdjpy bounced near 108.3 .
After using a calculator, I found that 108.3 = 100 * 1.083 ≒ 100 * pow(1.0025,31) .
1.0025 , as known as 0.25% of change, is a potential stop out zone.
Therefore, we can compute grids and one grid is a little more than 1.0025 times than an another one.
After we finished computing grids, we can consider buy and sell near those grids.
Note that different traders may obtain different grid values.
For example, from 1.0 to 2.0 , it can be splited as 270 grids or 277 grids because pow(1.0025,277)<2 .
Those grids cannot always imply potential reversal points but they can be useful for traders looking for 0.25% profit targets with reducing fearing of buying or selling too early.
Computing grids
This script split from 1.0 to 10.0 into three segments.
One is 1.0 to 2.0 .
The second segment is from 2.0 to 5.0 .
The third segment is from 5.0 to 10.0 .
This script does the same thing for 0.1 to 1.0 , 10.0 to 100.0 , and so on.
For 1.0 to 2.0 and 5.0 to 10.0 , this script split a segment as 270 grids.
For 2.0 to 5.0 , this script split a segment as 360 grids.
The last step is display the next grids to the daily low and daily high.
Maybe also display the grids behind grids shown.
Parameters
x1,x2,x3,x4 : display the next x1,x2,x3,x4 grids to daily high and daily low. 1 means the next grid to daily high and daily low. 2 means the next grid to 1.
x_seg : default 2.0 . This script split from 1.0 to 10.0 into three segments. One is 1.0 to x_seg. The second segment is from x_seg to 10.0/x_seg . The third segment is from 10.0/x_seg to 10.0 .
x_grid1 : how many grids in the first segment
x_grid2 : how many grids in the second segment
x_lowprice : add this number for bigger grid distance. Generally, you don't need this number when trading forex but you may need it in stock trading. For stocks with price between 50 to 100, I recommend you use x_lowprice=100.
Conclusion and suggestions
This script can find potential grids for trading.
If price touches grids usually, we can consider buy and sell after price touches grids.
If price reverses before touching grids usually, we may consider buy and sell before price touches grids.
Those grids can remind us don't buy too much unless the price touches the next grid.
For instruments with less volatility, maybe we need more grids.
For traders with more money, they may also consider more grids for more dedicated range trading to collect more profit.
Reference
Sorry, I forgot them.

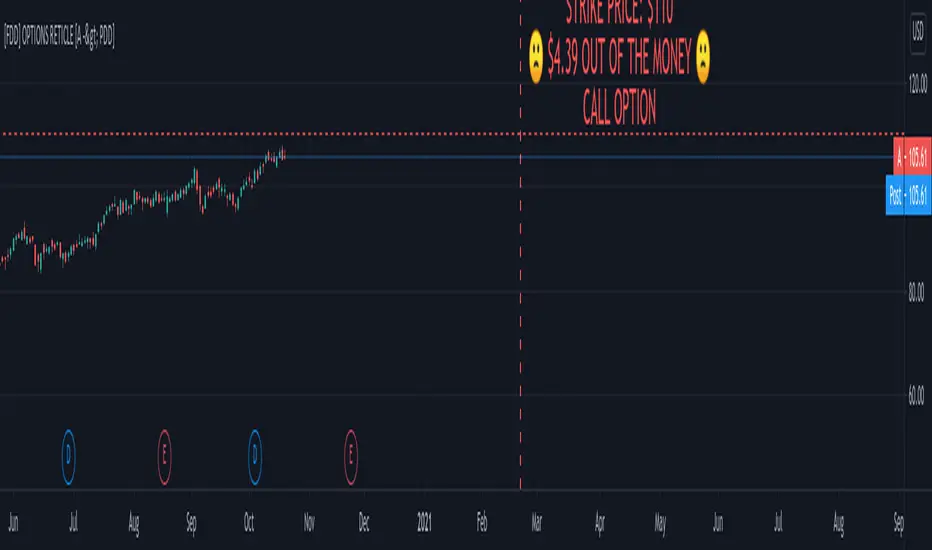
FOMO DRIVEN DEVELOPMENT OPTIONS RETICLE Options Reticle caters to degenerate traders and gamblers worldwide, reaching out for long distant contract expiration and just OTM strike placement.
Generate the overlay yourself using the tradingview-options-reticle CLI tool found on GitHub.
The Options Reticle provides a targeting system overlay that will show a horizontal OTM strike price and verticle expiration target. If you're thinking as soon as the expiration date has passed, this overlay will be useless; you're right but, you can use the options-reticle CLI tool to generate a new overlay from a watchlist exported from TradingView.
OVERLAY FEATURES:
Quick Action PUT (QAP) Mode - When you flip the chart by adding a 0- in front of the symbol, you will see the PUT contract target. Strike Price / Expiration Crosshairs.
Fill Mode - Shows a fill between the historical price and the target strike price. It will show green when ITM and red when OTM. Target information panel - Shows the company name, days till expiration, month and day of expiration, strike price, dollars OTM or ITM, and the contract type.
Emotion Indicator - Shows an exact representation of your feelings based on if you were in the trade. It has an accuracy of 99.9 percent.
QUICK ACTION PUT (QAP) MODE :
This style of reticle is not visible until you flip the chart. The advantage of the (QAP) is that it maintains the same appearance as the standard style of reticle, making PUT contract targeting feel the same. When targeting with (QAP) mode, be aware that the chart prices are reversed. Up is down, and down is up; this can be confusing but will feel normal overtime. Activate QAP mode by appending a 0- to the symbol of the chart. If nothing appears, no put option data was found for that symbol.
CALIBRATING YOUR RETICLE :
The overlay is generated using the options-reticle CLI tool found on GitHub. The adjustment script will parse a watchlist exported from TradingView then download options data for each ticker in the watchlist. The max amount of symbols you can add to a single overlay is about 200. Any more than 200 and the overlay will crash. Luckily, If you use a TradingView watchlist with more than 200 ticker symbols to generate overlays, the options-reticle command-line tool will automatically create multiple overlays with 200 tickers each. You can add multiple overlays to your chart to get all the tickers in the watchlist.
RETICLE GENERATION AND MOUNTING :
Add all the tickers you want to track into a watchlist on Tradingview.
Export the watchlist into a txt file using TradingView's watchlist export list button.
Open the terminal and change to the directory with the downloaded watchlist txt file.
Install options-reticle command tool with pipx. pipx install tradingview-options-reticle.
Run the command options-reticle download --watchlist {name of watchlist.txt file}. This will download the options data to an options_data.toml in the same directory as the watchlist txt file.
Run the command options-reticle build --options-data-input-path options_data.toml. This will generate the overlay scripts. If the watch list has more than 200 ticker symbols, it will generate a separate overlay script for every 200 ticker symbol chunk.
Copy and paste each of the generated overlay scripts one at a time into the Pine Editor on TradingView, then click the Add to Chart button. Make sure you copy the entire code.
FUTURE FEATURES :
Give the choice to generate PUT option contracts without using QAP mode. This option will allow you to use the input settings to change the contract type without flipping the chart.
Max OTM target argument - This will allow the option-reticle CLI to generate overlays with deeper OTM contracts. It currently only searches for the first OTM contract.
Add the ability to change the crosshair line type.
Keltner Channels times 4!Have you always wanted the ultimate MOMO buying script? Well here you go, KC stacked on top of one another.
As Trump would say,
ENJOY!

MyAlgoPLEASE READ THE ENTIRE POST BEFORE PURCHASING & USING THE MyAlgo Tool. Saves you and me some time in emails and messages. :)
This is the official version of MyAlgo
PLEASE UNDERSTAND THAT THIS IS A DIFFERENT AND SEPARATE PRODUCT AND SCRIPT FROM "MyAlgo SLIM" FROM THE MyAlgo TRADING TOOL SERIES
Description
Buy & Sell Alerts can be set on all Tickers. This includes, but is not limited to Crypto, Commodities , FOREX, Equities and Indices. Also all candle Types are compatible.
Recommended Time-frames - Due to the complexity of MyAlgo-SLIM the user has a choice between three algorithms and is like that able to trade on all timeframes with the highest returns.
MyAlgo combines many different aspects at the same time, scans multiple other Algorithms and comes to a conclusion based on over 1350 lines of code.
It is based on Divergences, Elliott Waves , Ichimoku , MACD , MACD Histogram, RSI , Stoch , CCI , Momentum, OBV, DIOSC, VWMACD, CMF and multiple EMAs.
Every single aspect is weighted into the decision before giving out an indication.
Most buy/sell Algorithms FAIL because they try to apply the same strategy to every single chart, which
are as individual as humans. To conquer this problem, MyAlgo has a wide range of settings and variables which can be easily
modified.
To make it a true strategy, MyAlgo has as well settings for Take Profit Points and Stop
Losses. Everything with an Alert Feature of course so that FULL AUTOMATION IS POSSIBLE.
I know from experience that many people take one Algorithm and are simply too LAZY to add multiple Algorithms to make a rational choice. The result of that is that they lose money, by following blatantly only one Algorithm.
MyAlgo has additional 15 Indicators, perfect for all markets, which can be turned on and off individually.
Side Notes
MyAlgo is being updated and upgraded very frequently to suit the requests of our customers.
This is not financial advice. Please read our disclaimer before using.
Anything below this sentence will be Updates regarding MyAlgo
MyAlgo-SLIMPLEASE READ THE ENTIRE POST BEFORE PURCHASING & USING THE MyAlgo-SLIM Tool. Saves you and me some time in emails and messages. :)
This is the official version of MyAlgo-SLIM
Description
Buy & Sell Alerts can be set on all Tickers. This includes, but is not limited to Crypto, Commodities , FOREX, Equities and Indices. Also all candle Types are compatible.
Recommended Time-frames - Due to the complexity of MyAlgo-SLIM the user has a choice between three algorithms and is like that able to trade on all timeframes with the highest returns.
MyAlgocombines many different aspects at the same time, scans multiple other Algorithms and comes to a conclusion based on over 1350 lines of code.
It is based on Divergences, Elliott Waves , Ichimoku , MACD , MACD Histogram, RSI , Stoch , CCI , Momentum, OBV, DIOSC, VWMACD, CMF and multiple EMAs.
Every single aspect is weighted into the decision before giving out an indication.
Most buy/sell Algorithms FAIL because they try to apply the same strategy to every single chart, which
are as individual as humans. To conquer this problem, MyAlgo has a wide range of settings and variables which can be easily
modified.
To make it a true strategy, MyAlgo has as well settings for Take Profit Points and Stop
Losses. Everything with an Alert Feature of course so that FULL AUTOMATION IS POSSIBLE.
I know from experience that many people take one Algorithm and are simply too LAZY to add multiple Algorithms to make a rational choice. The result of that is that they lose money, by following blatantly only one Algorithm.
MyAlgo has additional 15 Indicators, perfect for all markets, which can be turned on and off individually.
Side Notes
MyAlgo is being updated and upgraded very frequently to suit the requests of our customers.
This is not financial advice. Please read our disclaimer before using.
Anything below this sentence will be Updates regarding MyAlgo-SLIM
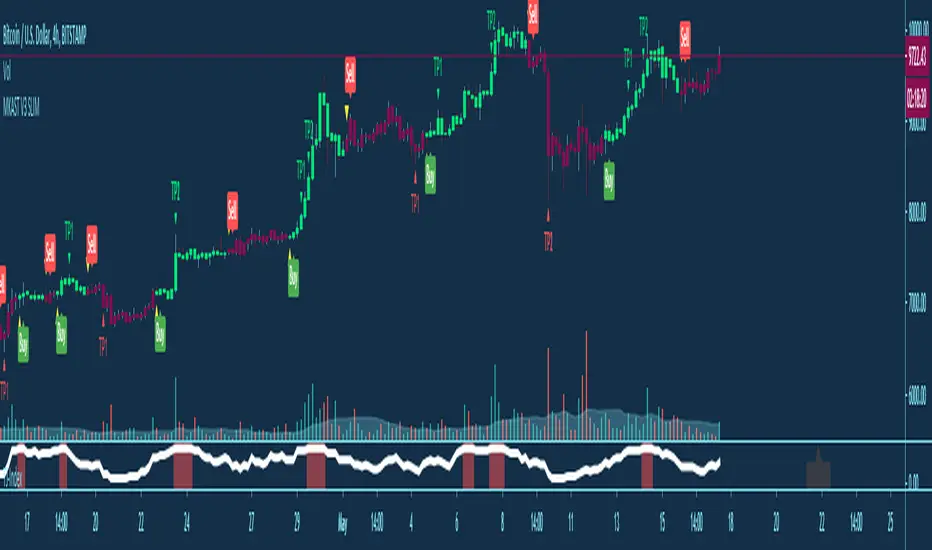
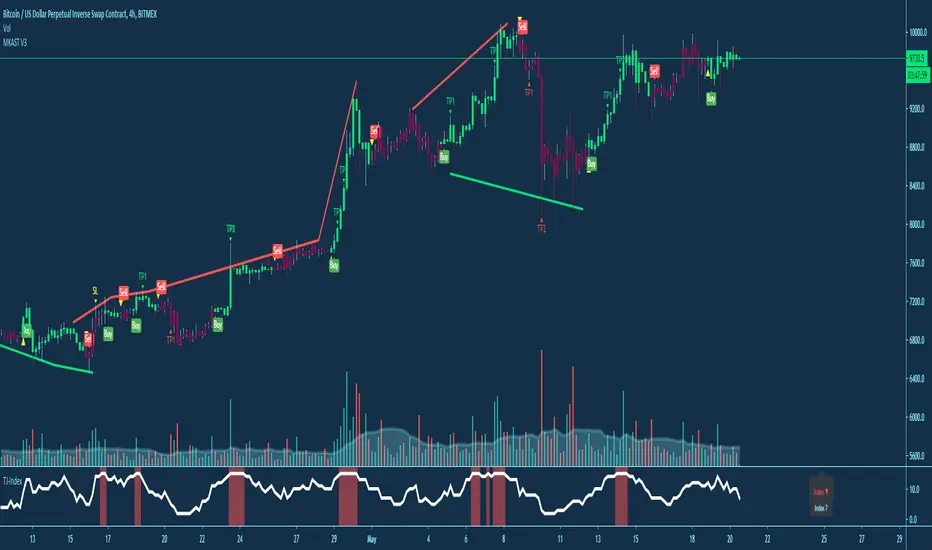
MKAST V2 (monthly)PLEASE READ THE ENTIRE POST BEFORE PURCHASING & USING THE MKAST Algorithm. Saves you and me some time in emails and messages. :)
This is the NEW MONTHLY ACCESS Version of the MKAST
The MKAST Buy Sell Algorithm is a very specific strategy, cut down to its roots and made perfect for the volatile crypto market.
Many Algorithms focus only on one aspect, one side, one specific rule.
As you know, this is not how life, the market or anything else works.
MKAST combines many different aspects at the same time, scans multiple other Algorithms and comes to a conclusion based on over 1350 lines of code.
It is based on Divergences, Elliott Waves , Ichimoku , MACD , MACD Histogram, RSI , Stoch , CCI , Momentum, OBV, DIOSC, VWMACD, CMF and multiple EMAs.
Every single aspect is weighted into the decision before giving out an indication.
Most buy/sell Algorithms FAIL because they try to apply the same strategy to every single chart, which
are as individual as humans.
To conquer this problem, MKAST has a wide range of settings and variables which can be easily
modified.
To make it a true strategy, MKAST has as well settings for Take Profit Points, Multiple Entries and Stop
Losses. Everything with an Alert Feature of course.
I know from experience that many people take one Algorithm and are simply too LAZY to add multiple Algorithms to make a rational choice.
The result of that is that they lose money, by following blatantly only one Algorithm.
MKAST has additional 9 Indicators, perfect for the crypto market, which can be turned on and off.
Manual
MKAST Signals Settings
“Show Signals?” - On/Off to show the Buy/Sell Signals.
“Aggressiveness” - Increase to make the signals less aggressive and decrease to make them more aggressive.
“Show Custom Signals?” - On/Off to show custom MKAST Signals as chosen in the settings below.
“Custom Buy/Sell Aggressiveness” - Choose a custom Aggressiveness for each buy and sell signal individually.
“TJ-Index Requirement For Buy/Sell” - If the TJ-Index is below the given number, it will show the signal in grey, this also applies for normal signals. Buy 0 and Sell 15 shows all signals in their original colour again.
“Don’t show signals that don’t meet index requirement?” - Checked, it will completely not show signals which would be “grey” as in the explanation above.
“Change Backgroundcolour if index is at 15 or 0?” - Checked, changes the colour of the chart if the index is at 15 or 0 points
MKAST Panel Settings
“Show Info Panel?” - Shows Info Panel on the chart.
“Move Info Panel UP by %” - Moves Info Panel up/down.
“Move Info Panel Left/Right ” - Moves Info Panel Left/Right.
“Show BitMEX Panel?” - Shows BitMEX Panel on the chart.
“Move BitMEX Panel by % ” - Moves BitMEX Panel up/down.
“Move BitMEX Panel Left/Right” - Moves BitMEX Panel Left/Right. “Signal Source” - Choose source of candle open/close for Equity calculation.
“Leverage Used?” - Select the used Leverage for your strategy and Equity calculation.
“Fees Per Trade in % ” - Deducts these fees after each trade from Equity calculation.
“Round Current Profit Price?” - Rounds the number on the Panel. “Trading Periods ” - Choose a trading Period which will be used to calculate Period Equity.
“Show separations of each Trading Period?” - Show separations on the chart of each Trading Period.
The very new feature on Tradingview and obviously now as well on MKAST are Information Panels.
I have chosen to add an Info Panel and a BitMEX Price Panel into MKAST, to make live and even
backtesting easier.
With only one blink of an eye the user is able to see ALL relevant information, without having to go
through various ways of checking and using other tools.
The Info Panel:
The first row shows the current profit. This is calculated since the signal initiation and the current candle close. Followed by a single number, which represents the current TJ-Index, removing the need of having to add the actual TJ-Index Oscillator on the chart.
The second row shows the current position and its status. This was added on request of many users wanting to know if their position is “about to change” or not. The status shows the users if the position is “endangered” or “okay”.
Followed by the “backtesting tool” already included inside the Panel. No need for complex oscillators with a hard reading for backtesting. With this one and simple panel, you see the Period Equity for the period chosen previously in the settings. This calculates all profits made inside that period and re-sets when the period ends. Right next to it, the Total Equity calculating ALL profits since the beginning of the chart.
Right below, you see the information about the last long and short position which have been open. This helps with the evaluation and documentation of the last trade.
The BitMEX Panel:
A convenient panel which shows all BitMEX contracts and their LIVE prices. The need for opening each chart goes away, the quality and experience of trading increases.
MKAST custom Signals are one of the notorious possibilities for ADVANCED strategies with MKAST.
Users who requested these features and use them frequently are the ones, having already a very unique trading strategy and they use these very custom signals as confluence or for multiple entry trades.
These custom signals and their settings can be mostly ignored by the majority of traders who are using this Algorithm.
The idea behind the grey signals has its roots in the idea of the TJ-Index. The TJ-Index being 15 Algorithms and conditions possible showing a bullish or bearish interpretation. The index counts the Algorithms which are showing a bullish interpretation.
Like that we can make sure that signals are shown in the original colour, are only those who have an additional confluence with the TJ-Index, not letting the user buy, if at least the majority is not bullish , and not letting the user sell, if at least the majority is bearish .
The custom buy and sell aggressiveness lets the user customise the MKAST algorithm even more.
Either the users wants to see how signals are changing on a different (slightly lower or higher) aggressiveness, being able to expect a change on their own settings. OR seeing that some signals of the same sort are a little out of place and is able to move these to a different aggressiveness, increasing the profitability even more.
Needless to say, custom signals are NOT a part of the Info Panel.
MKAST Label & Trendline Settings
“Show Labels?” - On/Off to show Labels above each signal, with the percentage gain or loss, calculated from the last signal to the new signal.
“Show Trendlines?” - On/Off to show automatic Trendlines following Gainzy Lines.
“Lookback Length” - Choose a length that the automatic trendiness use for calculation. Comparable to Aggressiveness.
“Wicks//Bodies” - Change between trendiness connecting from wick to wick or from body to body.
“Black lines// Coloured lines” - Change between simply black lines or changing colour lines.
“Filter Trendlines?” - On/Off to show all trendiness or just resistance decreasing and support increasing ones.
“Limit Extensions Of The Lines?” - This value increases by how much the trendiness are being extended. 0 = endless extension, otherwise 100 = maximum custom extension.MKAST Strategy “Take Profit 1” - On/Off to show TP1 points.
“Take Profit After %” - Set the percentage after which TP1 is active.
“Take Profit 2 ” - On/Off to show TP2 points.
“Take Profit 2 After %” - Set the percentage after which TP1 is
active.
“Take Profit 3” - On/Off to show TP3 points.
“Take Profit 3 After %” - Set the percentage after which TP1 is active.
“Second Entry” - On/Off to show Second Entry points.
“Second Entry After %” - Set the percentage after which Second Entry is active.
“Third Entry” - On/Off to show Third Entry points.
“Third Entry After %” - Set the percentage after which Third Entry is active.
“Stop Loss” - On/Off to show Stop Loss points.
“Stop Loss After %” - Set the percentage after which Stop Loss is active.
MKAST Strategy
To make the life of the MKAST user even easier, I have added all adjustable Take Profit Points, Multiple entry points and Stop Loss points.
I have never seen a sustainable and reliable trading strategy without TPs, Multiple entry and especially without a stop loss. Everything in the usual and fully customisable MKAST style.
Simply choose how many Take Profit points you would like to have and choose the percentage after which you would like to see the Take Profit point appear on the chart and notify you to take profits.
Are you a Trader who likes Multiple Entries? Also no problem with MKAST. Select how many additional entries you would like to have and after how many percent you would like them to appear on the chart and remind you of adding to the position.
What would a Strategy be without a Stop Loss? Same settings apply here as on the TPs and MEs .
All of the settings are able to take fractions of a number as well. This enables users to even use all of the strategy settings for scalping or FX pairs, where high leverage and the smallest of moves are used for trading.
Needless to say, all of these settings work on RENKO and Heikin Ashi as well. These might need adjustment, since the calculation is different, yet there is nothing standing in the way of it anymore.
Crypto Modified Indicators
“Show Divergences?” - On/Off to show Divergences on the Chart based on the data of 10 different Algorithms.
“Show Oversold/bought?” - On/Off to change the colour of the chart in Oversold/bought conditions.
“Oversold/bought value?” - Choose a value for which the chart is Oversold/bought.
“Show Fibonacci Levels?” - On/Off to show automatic Fibonacci Levels.
“Fibonacci Lookback Lenght” - This value states how many candles from right now are taken into account to paint the Fibonacci Levels.
“Fibonacci Custom Period” - Choose a custom Timeframe that should be used to paint the Fibonacci Levels.
“2nd-7th Fibonacci Level” - Enter a value for the Fibonacci Levels you would like to use and see on the chart.
“Plot 1.618 Level?” - On/Off for the Fibonacci extension level.
Crypto Modified Indicators
“Show Bands?” - On/Off to show the TJ-Bands on the chart.
“Bands Length” - Choose a value for the TJ-Bands Lenght
“Show Show EMA 1-3?” - On/Off to show the EMAs 1-3 on the chart.
“EMA Lenght 1-3” - Choose a value for the first to third EMA Lenght
“Show Ichimoku? ” - On/Off to show Ichimoku on the chart.
“Show Tenkin?” - On/Off to show Tenkin on the chart. “Tenkin” - Set the lenght of the Tenkin.
“Show Kijun?” - On/Off to show Kijun on the chart.
“Kijun” - Set the lenght of the Kijun.
“Show Senkou?” - On/Off to show the Senkou on the chart. “Senkou” - Set the lenght of the Senkou.
“Displacement” - Set the value of the Displacement.
“Show Chikou Span?” - On/Off to show the Chikou Span on the chart.
Crypto Custom Indicators
In the picture above, you see the first pair of Crypto Custom Indicators. The oversold and overbought conditions are highlighted.
Bullish and Bearish divergences are also plotted on the chart.
This is personally my favourite combination of Indicators and MKAST settings. It shows nicely
everything one needs to know and makes it easier to decide wether to follow a signal or not.
We here as well a perfect example of the Automatic Fibonacci Lines (Lookback 50, Timeframe 1D).
It shows all significant levels, which we can see being respected.
Orange = 23.6%, Green = 38.2%, Red = 50%, Yellow = 61.8%, Blue = 78.6%, White = 0%;100%
In this picture above, we observe the perfect ensemble of MKAST and an EMA strategy, especially modified for crypto markets.
Here, as by default, we have the EMAs at 21, 90 and 200. These have shown to be very significant moving support and resistance points in the crypto market.
In this picture above, I lowered the timeframe to show the highly significant levels of the Ichimoku . It has not the “usual values”. These here have been modified for the volatile crypto market and set as default.
An incredibly powerful tool for anyone who is ready to step up their trading game. It is a huge part of the MKAST back end and the strategy behind it.
MKAST Custom Alerts
1
MKAST without any doubt has Custom Alerts for all Signals that it is painting on the chart.
One can even choose to receive custom notifications for Take Profit points, Multiple Entry points and
the Stop Loss points.
The signals appear on the chart DURING the candle, not at the end of the candle. Therefore, the
alerts do this as well. These appear during the candle.
Here we can see all of the possible Alerts that can be chosen to be displayed. In total it is 14 different custom alerts, based on what the trader is looking for and how he is trading.
Personally, I have 10-15 coins that I trade the most and for these I have custom notifications, mostly though only the MKAST Buy/Sell and Stop Loss Signals.
To activate Alerts for MKAST,
1) Go to the “ALERT” icon on the top tool bar of your Tradingview.
2) Select “CONDITION” as “—MKAST—“
3) Then choose ONE condition from the list of conditions.
4) On “OPTIONS” you can set how many times it appears, I have “Once per Bar”.
4.1) If you want to make sure that the signal is truly there and not just a condition for a second during the candle, choose “ONCE PER BAR CLOSE”.
5) “Expiration Time” sets the time until the alert expires. PRO users have no expiration for alerts.
6) “Alert Actions” give you a row of choices what happens and how you want to be notified.
7) “Message” is the message that you receive inside the notification.
Thank you, Kong

MKAST V2 (lifetime)PLEASE READ THE ENTIRE POST BEFORE PURCHASING & USING THE MKAST Algorithm. Saves you and me some time in emails and messages. :)
This is the NEW LIFETIME ACCESS Version of the MKAST
The MKAST Buy Sell Algorithm is a very specific strategy, cut down to its roots and made perfect for the volatile crypto market.
Many Algorithms focus only on one aspect, one side, one specific rule.
As you know, this is not how life, the market or anything else works.
MKAST combines many different aspects at the same time, scans multiple other Algorithms and comes to a conclusion based on over 1350 lines of code.
It is based on Divergences, Elliott Waves, Ichimoku, MACD, MACD Histogram, RSI, Stoch, CCI, Momentum, OBV, DIOSC, VWMACD, CMF and multiple EMAs.
Every single aspect is weighted into the decision before giving out an indication.
Most buy/sell Algorithms FAIL because they try to apply the same strategy to every single chart, which
are as individual as humans.
To conquer this problem, MKAST has a wide range of settings and variables which can be easily
modified.
To make it a true strategy, MKAST has as well settings for Take Profit Points, Multiple Entries and Stop
Losses. Everything with an Alert Feature of course.
I know from experience that many people take one Algorithm and are simply too LAZY to add multiple Algorithms to make a rational choice.
The result of that is that they lose money, by following blatantly only one Algorithm.
MKAST has additional 9 Indicators, perfect for the crypto market, which can be turned on and off.
Manual
MKAST Signals Settings
“Show Signals?” - On/Off to show the Buy/Sell Signals.
“Aggressiveness” - Increase to make the signals less aggressive and decrease to make them more aggressive.
“Show Custom Signals?” - On/Off to show custom MKAST Signals as chosen in the settings below.
“Custom Buy/Sell Aggressiveness” - Choose a custom Aggressiveness for each buy and sell signal individually.
“TJ-Index Requirement For Buy/Sell” - If the TJ-Index is below the given number, it will show the signal in grey, this also applies for normal signals. Buy 0 and Sell 15 shows all signals in their original colour again.
“Don’t show signals that don’t meet index requirement?” - Checked, it will completely not show signals which would be “grey” as in the explanation above.
“Change Backgroundcolour if index is at 15 or 0?” - Checked, changes the colour of the chart if the index is at 15 or 0 points
MKAST Panel Settings
“Show Info Panel?” - Shows Info Panel on the chart.
“Move Info Panel UP by %” - Moves Info Panel up/down.
“Move Info Panel Left/Right ” - Moves Info Panel Left/Right.
“Show BitMEX Panel?” - Shows BitMEX Panel on the chart.
“Move BitMEX Panel by % ” - Moves BitMEX Panel up/down.
“Move BitMEX Panel Left/Right” - Moves BitMEX Panel Left/Right. “Signal Source” - Choose source of candle open/close for Equity calculation.
“Leverage Used?” - Select the used Leverage for your strategy and Equity calculation.
“Fees Per Trade in % ” - Deducts these fees after each trade from Equity calculation.
“Round Current Profit Price?” - Rounds the number on the Panel. “Trading Periods ” - Choose a trading Period which will be used to calculate Period Equity.
“Show separations of each Trading Period?” - Show separations on the chart of each Trading Period.
The very new feature on Tradingview and obviously now as well on MKAST are Information Panels.
I have chosen to add an Info Panel and a BitMEX Price Panel into MKAST, to make live and even
backtesting easier.
With only one blink of an eye the user is able to see ALL relevant information, without having to go
through various ways of checking and using other tools.
The Info Panel:
The first row shows the current profit. This is calculated since the signal initiation and the current candle close. Followed by a single number, which represents the current TJ-Index, removing the need of having to add the actual TJ-Index Oscillator on the chart.
The second row shows the current position and its status. This was added on request of many users wanting to know if their position is “about to change” or not. The status shows the users if the position is “endangered” or “okay”.
Followed by the “backtesting tool” already included inside the Panel. No need for complex oscillators with a hard reading for backtesting. With this one and simple panel, you see the Period Equity for the period chosen previously in the settings. This calculates all profits made inside that period and re-sets when the period ends. Right next to it, the Total Equity calculating ALL profits since the beginning of the chart.
Right below, you see the information about the last long and short position which have been open. This helps with the evaluation and documentation of the last trade.
The BitMEX Panel:
A convenient panel which shows all BitMEX contracts and their LIVE prices. The need for opening each chart goes away, the quality and experience of trading increases.
MKAST custom Signals are one of the notorious possibilities for ADVANCED strategies with MKAST.
Users who requested these features and use them frequently are the ones, having already a very unique trading strategy and they use these very custom signals as confluence or for multiple entry trades.
These custom signals and their settings can be mostly ignored by the majority of traders who are using this Algorithm.
The idea behind the grey signals has its roots in the idea of the TJ-Index. The TJ-Index being 15 Algorithms and conditions possible showing a bullish or bearish interpretation. The index counts the Algorithms which are showing a bullish interpretation.
Like that we can make sure that signals are shown in the original colour, are only those who have an additional confluence with the TJ-Index, not letting the user buy, if at least the majority is not bullish, and not letting the user sell, if at least the majority is bearish.
The custom buy and sell aggressiveness lets the user customise the MKAST algorithm even more.
Either the users wants to see how signals are changing on a different (slightly lower or higher) aggressiveness, being able to expect a change on their own settings. OR seeing that some signals of the same sort are a little out of place and is able to move these to a different aggressiveness, increasing the profitability even more.
Needless to say, custom signals are NOT a part of the Info Panel.
MKAST Label & Trendline Settings
“Show Labels?” - On/Off to show Labels above each signal, with the percentage gain or loss, calculated from the last signal to the new signal.
“Show Trendlines?” - On/Off to show automatic Trendlines following Gainzy Lines.
“Lookback Length” - Choose a length that the automatic trendiness use for calculation. Comparable to Aggressiveness.
“Wicks//Bodies” - Change between trendiness connecting from wick to wick or from body to body.
“Black lines// Coloured lines” - Change between simply black lines or changing colour lines.
“Filter Trendlines?” - On/Off to show all trendiness or just resistance decreasing and support increasing ones.
“Limit Extensions Of The Lines?” - This value increases by how much the trendiness are being extended. 0 = endless extension, otherwise 100 = maximum custom extension.MKAST Strategy “Take Profit 1” - On/Off to show TP1 points.
“Take Profit After %” - Set the percentage after which TP1 is active.
“Take Profit 2 ” - On/Off to show TP2 points.
“Take Profit 2 After %” - Set the percentage after which TP1 is
active.
“Take Profit 3” - On/Off to show TP3 points.
“Take Profit 3 After %” - Set the percentage after which TP1 is active.
“Second Entry” - On/Off to show Second Entry points.
“Second Entry After %” - Set the percentage after which Second Entry is active.
“Third Entry” - On/Off to show Third Entry points.
“Third Entry After %” - Set the percentage after which Third Entry is active.
“Stop Loss” - On/Off to show Stop Loss points.
“Stop Loss After %” - Set the percentage after which Stop Loss is active.
MKAST Strategy
To make the life of the MKAST user even easier, I have added all adjustable Take Profit Points, Multiple entry points and Stop Loss points.
I have never seen a sustainable and reliable trading strategy without TPs, Multiple entry and especially without a stop loss. Everything in the usual and fully customisable MKAST style.
Simply choose how many Take Profit points you would like to have and choose the percentage after which you would like to see the Take Profit point appear on the chart and notify you to take profits.
Are you a Trader who likes Multiple Entries? Also no problem with MKAST. Select how many additional entries you would like to have and after how many percent you would like them to appear on the chart and remind you of adding to the position.
What would a Strategy be without a Stop Loss? Same settings apply here as on the TPs and MEs.
All of the settings are able to take fractions of a number as well. This enables users to even use all of the strategy settings for scalping or FX pairs, where high leverage and the smallest of moves are used for trading.
Needless to say, all of these settings work on RENKO and Heikin Ashi as well. These might need adjustment, since the calculation is different, yet there is nothing standing in the way of it anymore.
Crypto Modified Indicators
“Show Divergences?” - On/Off to show Divergences on the Chart based on the data of 10 different Algorithms.
“Show Oversold/bought?” - On/Off to change the colour of the chart in Oversold/bought conditions.
“Oversold/bought value?” - Choose a value for which the chart is Oversold/bought.
“Show Fibonacci Levels?” - On/Off to show automatic Fibonacci Levels.
“Fibonacci Lookback Lenght” - This value states how many candles from right now are taken into account to paint the Fibonacci Levels.
“Fibonacci Custom Period” - Choose a custom Timeframe that should be used to paint the Fibonacci Levels.
“2nd-7th Fibonacci Level” - Enter a value for the Fibonacci Levels you would like to use and see on the chart.
“Plot 1.618 Level?” - On/Off for the Fibonacci extension level.
Crypto Modified Indicators
“Show Bands?” - On/Off to show the TJ-Bands on the chart.
“Bands Length” - Choose a value for the TJ-Bands Lenght
“Show Show EMA 1-3?” - On/Off to show the EMAs 1-3 on the chart.
“EMA Lenght 1-3” - Choose a value for the first to third EMA Lenght
“Show Ichimoku? ” - On/Off to show Ichimoku on the chart.
“Show Tenkin?” - On/Off to show Tenkin on the chart. “Tenkin” - Set the lenght of the Tenkin.
“Show Kijun?” - On/Off to show Kijun on the chart.
“Kijun” - Set the lenght of the Kijun.
“Show Senkou?” - On/Off to show the Senkou on the chart. “Senkou” - Set the lenght of the Senkou.
“Displacement” - Set the value of the Displacement.
“Show Chikou Span?” - On/Off to show the Chikou Span on the chart.
Crypto Custom Indicators
In the picture above, you see the first pair of Crypto Custom Indicators. The oversold and overbought conditions are highlighted.
Bullish and Bearish divergences are also plotted on the chart.
This is personally my favourite combination of Indicators and MKAST settings. It shows nicely
everything one needs to know and makes it easier to decide wether to follow a signal or not.
We here as well a perfect example of the Automatic Fibonacci Lines (Lookback 50, Timeframe 1D).
It shows all significant levels, which we can see being respected.
Orange = 23.6%, Green = 38.2%, Red = 50%, Yellow = 61.8%, Blue = 78.6%, White = 0%;100%
In this picture above, we observe the perfect ensemble of MKAST and an EMA strategy, especially modified for crypto markets.
Here, as by default, we have the EMAs at 21, 90 and 200. These have shown to be very significant moving support and resistance points in the crypto market.
In this picture above, I lowered the timeframe to show the highly significant levels of the Ichimoku. It has not the “usual values”. These here have been modified for the volatile crypto market and set as default.
An incredibly powerful tool for anyone who is ready to step up their trading game. It is a huge part of the MKAST back end and the strategy behind it.
MKAST Custom Alerts
1
MKAST without any doubt has Custom Alerts for all Signals that it is painting on the chart.
One can even choose to receive custom notifications for Take Profit points, Multiple Entry points and
the Stop Loss points.
The signals appear on the chart DURING the candle, not at the end of the candle. Therefore, the
alerts do this as well. These appear during the candle.
Here we can see all of the possible Alerts that can be chosen to be displayed. In total it is 14 different custom alerts, based on what the trader is looking for and how he is trading.
Personally, I have 10-15 coins that I trade the most and for these I have custom notifications, mostly though only the MKAST Buy/Sell and Stop Loss Signals.
To activate Alerts for MKAST,
1) Go to the “ALERT” icon on the top tool bar of your Tradingview.
2) Select “CONDITION” as “—MKAST—“
3) Then choose ONE condition from the list of conditions.
4) On “OPTIONS” you can set how many times it appears, I have “Once per Bar”.
4.1) If you want to make sure that the signal is truly there and not just a condition for a second during the candle, choose “ONCE PER BAR CLOSE”.
5) “Expiration Time” sets the time until the alert expires. PRO users have no expiration for alerts.
6) “Alert Actions” give you a row of choices what happens and how you want to be notified.
7) “Message” is the message that you receive inside the notification.
Thank you, Kong

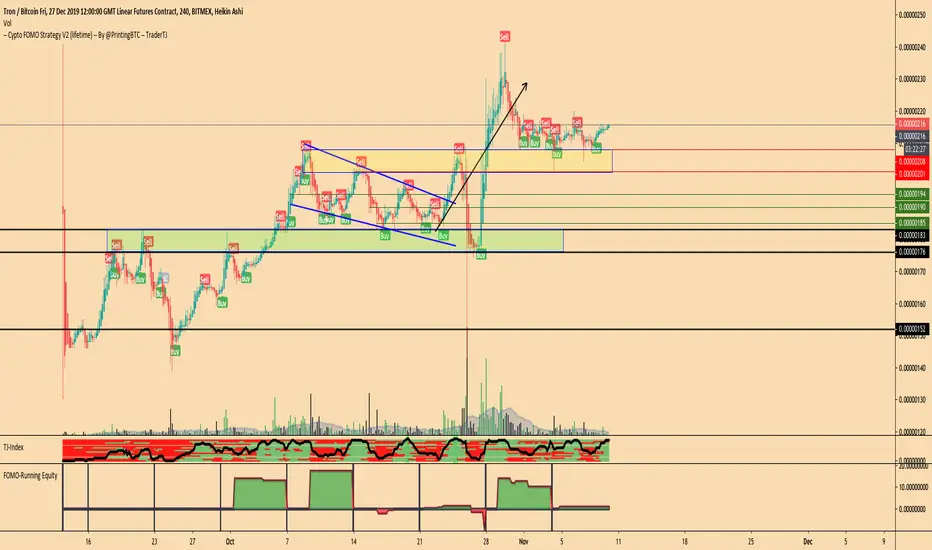
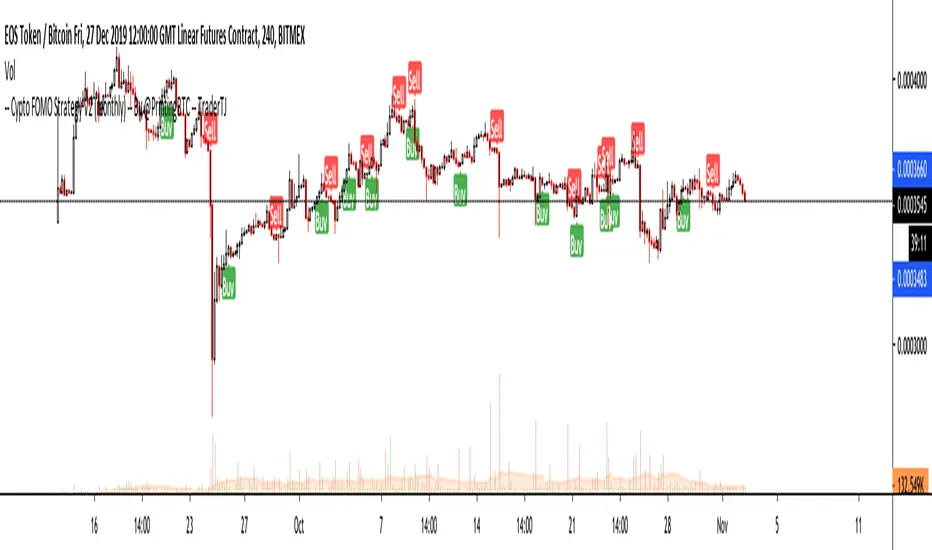
FOMO-Running EquityThis is a backtested for the running equity of my Crypto FOMO Strategy.
It shows you the performance of each trade, shows you periodical equity, resets the equity after each period to 0, shows histograms after each trade.
This is an easy visual tool following Gainzys style to see how the algorithm performed previously and which settings might be the most or more profitable ones in the near future.
Best regards, TJ
Crypto FOMO Strategy (monthly-access)PLEASE READ THE ENTIRE POST BEFORE PURCHASING & USING THE FOMO INDICATOR. Saves you and me some time in emails and messages. :)
This is the NEW MONTHLY ACCESS Version of the Crypto FOMO Strategy
Please check the links at the bottom of this post, so you find the way to our shop.
1 Month access is set at $25
10% Disount --> "FOMO25"
Any question, DM me here or on Twitter , check for link on the bottom.
The FOMO Buy Sell Indicator is a very specific strategy, cut down to its roots and made perfect for the volatile crypto market.
Many indicators focus only on one aspect, one side, one specific rule. As you know, this is not how life, the market or anything else works.
FOMO combines many different aspects at the same time, scans multiple other indicators and comes to a conclusion based on over 950 lines of code.
It is based on Divergences, Elliott Waves , Ichimoku , MACD , MACD Histogram, RSI , Stoch , CCI , Momentum, OBV, DIOSC, VWMACD, CMF and multiple EMAs.
Every single aspect is weighted into the decision before giving out an indication.
Most buy/sell indicators FAIL because they try to apply the same strategy to every single chart, which
are as individual as humans.
To conquer this problem, FOMO has a wide range of settings and variables which can be easily
modified.
To make it a true strategy, FOMO has as well settings for Take Profit Points, Multiple Entries and Stop Losses. Everything with an Alert Feature of course.
I know from experience that many people take one indicator and are simply too LAZY to add multiple indicators to make a rational choice.
The result of that is that they lose money, by following blatantly only one indicator.
FOMO has additional 7 indicators, perfect for the crypto market, which can be turned on and off.
FOMO Signals Settings
“Show Signals?” - On/Off to show the Buy/Sell Signals. “Aggressiveness” - Increase to make the signals less aggressive
and decrease to make them more aggressive.
“Show Custom FOMO Timeframe?” - On/Off to show FOMO Signals of a different timeframe in addition to the normal ones.
“Custom FOMO Timeframe?” - Choose the timeframe for the custom FOMO signals.
“Use Safe FOMO?” - On/Off to show only “safe” (less but more exact) FOMO signals.
“Safe FOMO Sells” - Settings for the “safe” FOMO Sell Signals. Decrease number for “less safe” Signals.
Increase number for “more safe” Signals.
“Safe FOMO Buys” - Settings for the “safe” FOMO Buy Signals. Decrease number for “more safe” Signals.
Increase number for “less safe” Signals.
FOMO Strategy Settings
“Take Profit 1 ” - On/Off to show TP1 points.
“Take Profit After %” - Set the percentage after which TP1 is
active.
“Take Profit 2 ” - On/Off to show TP2 points.
“Take Profit 2 After %” - Set the percentage after which TP2 is active.
“Take Profit 3 ” - On/Off to show TP3 points.
“Take Profit 3 After %” - Set the percentage after which TP3 is
active.
“Second Entry” - On/Off to show Second Entry points.
“Second Entry After %” - Set the percentage after which Second Entry is active.
“Third Entry ” - On/Off to Third Entry points.
“Third Entry After %” - Set the percentage after which Third
Entry is active.
“Stop Loss ” - On/Off to show Stop Loss points.
“Take Profit After %” - Set the percentage after which Stop Loss is active.
The FOMO Lifeguard is a special feature made to cancel out the “noice” of the signals and show only signals with a great technical significance.
For this FOMO uses the default settings of +7 and - 7. This references to an index value of multiple settings of almost all indicators used in this script.
+7 cuts out all sell signals below the index value of 7.
- 7 cuts out all buy signals above the index value of - 7.
Using the FOMO Lifeguard is a key element for a sustainable and profitable strategy.
As the normal FOMO Signals, the Lifeguard Signals are also bound to the “Aggressiveness”. Should the cut out of signals with the Lifeguard on be too big, try adjusting the “Aggressiveness”.
With this, once can choose and make this indicator PERFECT for his own strategy and trading style. Day Traders would use no “Lifeguard” and aggressive signals.
Swing Traders would use “Lifeguard” and aggressive signals.
To make the life of the FOMO user even easier, I have added all adjustable Take Profit Points, Multiple entry points and Stop Loss points.
Simply choose how many Take Profit points you would like to have and choose the percentage after which you would like to see the Take Profit point appear on the chart and notify you to take profits.
Are you a Trader who likes multiple entries? Also no problem with FOMO. Select how many additional entries you would like to have and after how many percent you would like them to appear on the chart and remind you of adding to the position.
What would a Strategy be without a Stop Loss? Same settings apply here as on the TPs and MEs .
Crypto Modified Indicators
“Show Divergences?” - On/Off to show Divergences on the Chart based on the data of 10 different indicators.
“Show Custom Divergences?” - On/Off to show Divergences on the chart of a custom timeframe.
“Custom Divergence Timeframe?” - Choose the Timeframe for which the Custom Divergences should appear on the chart.
“Show Oversold/bought?” - On/Off to change the colour of the chart in Oversold/bought conditions.
“Oversold/bought value?” - Choose a value for which the chart is Oversold/bought.
“Show Fibonacci Levels?” - On/Off to show automatic Fibonacci Levels.
“Fibonacci Lookback Lenght” - This value states how many candles from right now are taken into account to paint the Fibonacci Levels.
“Fibonacci Lookback Lenght” - Choose a custom Timeframe that should be used to paint the Fibonacci Levels.
Crypto Modified Indicators 2
“Show EMAs?” - On/Off to show three EMAs on the chart, after the example of @Teddycleps
“EMA Lenght 1” - Choose a value for the first EMA Lenght
“EMA Lenght 2 ” - Choose a value for the second EMA Lenght.
“EMA Lenght 3” - Choose a value for the third EMA Lenght.
The area between the first and third EMA is filled. Is EMA1 above 21, it’s filled green. Is it below, it’s filled red.
“Show Ichimoku? ” - On/Off to show Ichimoku on the chart.
“Show Tenkin?” - On/Off to show Tenkin on the chart.
“Tenkin” - Set the lenght of the Tenkin.
“Show Kijun?” - On/Off to show Kijun on the chart.
“Kijun” - Set the lenght of the Kijun.
“Show Senkou?” - On/Off to show the Senkou on the chart. “Senkou” - Set the lenght of the Senkou.
“Displacement” - Set the value of the Displacement.
“Show ZIG ZAG Lines?” - On/Off to show ZigZag Lines on the chart, used to identify short-term trends and EW counts.
“ZZ Lenght 1” - Set the first lenght of the ZigZag Lines.
“ZZ Lenght 2” - Set the second lenght of the ZigZag Lines.
FOMO without any doubt has Custom Alerts for all Signals that it is painting on the chart. This goes for the “Normal Signals” as well as for the “Lifeguard Signals”.
One can even choose to receive custom notifications for Take Profit points, Multiple Entry points and the Stop Loss points.
The signals appear on the chart DURING the candle, not at the end of the candle. Therefore, the alerts do this as well. These appear during the candle.
Here we can see all of the possible Alerts that can be chosen to be displayed. In total it is 30 different custom alerts, based on what the trader is looking for and how he is trading.
Personally, I have 10-15 coins that I trade the most and for these I have custom notifications, mostly though only the SAFE FOMO Buy and Sell Signals.
To activate Alerts for FOMO
1) Go to the “ALERT” icon on the top tool bar of your Tradingview.
2) Select “CONDITION” as “—Crypto FOMO Strategy—“
3) Then choose ONE condition from the list of conditions.
4) On “OPTIONS” you can set how many times it appears, I have “Once per Bar”.
4.1) If you want to make sure that the signal is truly there and not just a condition for a second during the candle, choose “ONCE PER BAR CLOSE”.
5) “Expiration Time” sets the time until the alert expires. PRO users have no expiration for alerts.
6) “Alert Actions” give you a row of choices what happens and how you want to be notified.
7) “Message” is the message that you receive inside the notification.
AFTERWORD/DISCLAIMER
FOMO has been created after my goal to #MakeCryptoProfessionalAgain. Every aspect of it has its own and very specific use, which traders have shown to find useful in their trading.
This Indicator is meant to help new and experienced traders to understand the various aspects of this market and access all of the most important and most commonly used tools, with JUST ONE CLICK.
FOMO should be used responsibly and treated as an indicator. Signals, scripts, algorithms can NEVER be 100% exact. It is up to the trader to make a well thought and educated decision, wether to follow a signal or not. Our brains are way more advanced than any indicator and algorithm.
I advise especially for this reason to have not just the signals turned on. Please do not use the SAME settings for each chart. Look which Aggressiveness and Lifeguard Settings fit your chart the most, you will be amazed how well some charts work with FOMO.
FOMO should NOT make you FOMO into a trade anymore. It should teach you to make more educated decisions and especially for margin trading reduce the risk of liquidation.
Should you have problems with being liquidated multiple times, I advise to use the “STOP LOSS” function.
Most importantly, enjoy the indicator and trading in general.


FOMO_V4_Trend_IndicatorBrief Introduction
1. EMAs - 26, 50, 100, 200, 300
2. Trend Cloud - Green (uptrend), Red (Downtrend) and Blue (Choppy/Sideways)
3. Buy Sell Signals
4. Bar Colors change with the trend - Green (uptrend), Red (Downtrend) and Blue (Choppy/Sideways)

FOMO_Buy_Sell_Indicator_BasicFOMO Buy Sell Indicator (Basic Version)
Inexpensive alternative to FOMO (Full Version), best for those who wish to use FOMO but with limited functionalities.
Features
-> Conventional FOMO
-> Multiple EMAs
Doesn't Include
-> Short Term/Mid Term/Long Term Trade Signals
-> Holy Trend Line
-> Options to change parameters inside FOMO.

FOMO_V2_Trend_Cloud// Currently in Testing.
// Official information will be published when back testing is complete.

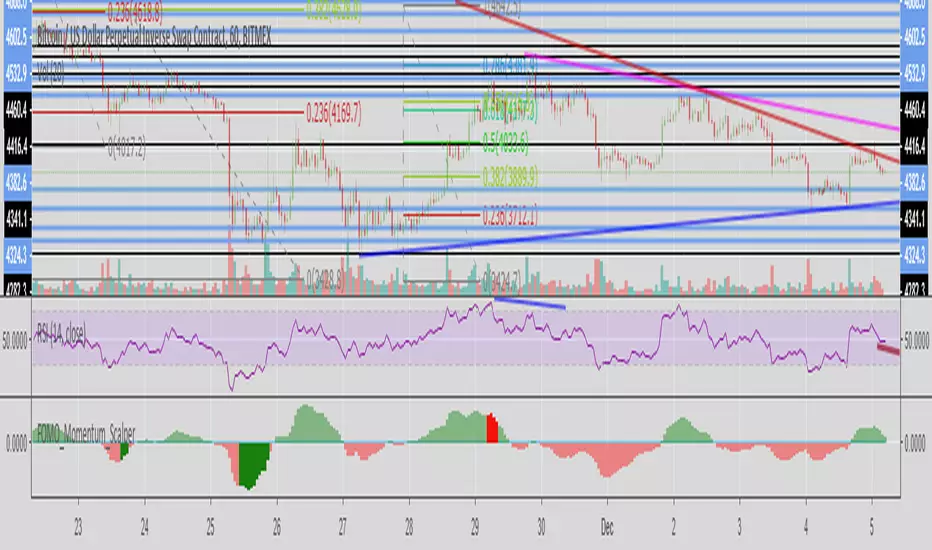
FOMO_Momentum_ScalperIndicator is easy to work with.
The histogram indicates the momentum.
Nothing fancy but signals are pretty accurate
Dark Green Bars on Histogram - Buying opportunity (Momentum of dump is decreasing)
Dark Red Bars on Histogram - Selling opportunity (Momentum of pump is decreasing)
Works best on 1m chart for those great scalping opportunities. Signals are based on increasing Buy/Sell momentum against the direction of the movement.
Haven't tested on any instrument except BTC.
Haven't tested for divergences but it should do the job.
P.S. It doesn't give too many signals as it waits for extreme conditions.
VJ_Holy_Grail_BigSwing_TraderBig Swings Trading Indicator
Suitable for Stocks, CFDs and Forex.
Not at all suitable for cryptocurrencies due to lack of historical data.
Add script to your favorites to gain access.
