Q-TrendQ-Trend is an multipurpose indicatorm that can be used for swing- and trend-trading equally on any timeframe (non-volatile markets are better for this thing).
Settings:
Trend period - used to calculate trend line in the special moments(will explain below);
ATR Multiplier - changes sensitivity. The higher the multiplier = the more sensitive it is.
Also option to smooth source data (helps get cleaner signals, as always).
How to use?
Signals are given on the chart. Also ou can use trend line as S/R line.
The idea behind:
Terms:
SRС = Source
TL = trend line;
MP = ATR multiplier;
ATR = ATR :)
TL = (highest of source P-bars back + lowest of source P-bars back) / 2
Epsilon = MP * ATR
I was thinking for a week about combining volatility and relation between highest and lowest price point. That why I called indicator Q-Trend = Quantitative Trend , as I was trying to think about price in a mathematical way.
Okay, time to go philosophical:
1) TL is shows good price trend, but as it is slow enough and not enough informative, we need add additional conditions to produce signals.
2) Okay, so what can we add as conditions? We need to take volatility into account, as it is crucial in the moments of market uncertainty. So let's use ATR (Average True Range) somehow. My idea is that if SRC breaks TL + ATR , then it means that there will be upmove and we update our TL . Analogically for SRC breaking TL - ATR (breaks are crosses of TL +- ATR lines) .
Conclusion:
- if SRC breaks TL + ATR , it is a BUY signal and update of trend line;
- if SRC breaks TL - ATR , it is a SELL signal and update of trend line;
I think that such indicator already exisits on TradingView, as I've already saw something similar, but long ago, so please don't report, if such thing already exists.
But if not, then I hope, that you will gain some profits with Q-Trend :)
I will continue my work on this thing, so stay tuned.
Trade with your own risks and have your profits!
Wish you all the best!
- Tarasenko Fyodor
Godmode

[EDU] Close Open Estimation Signals (COE Signals)EN:
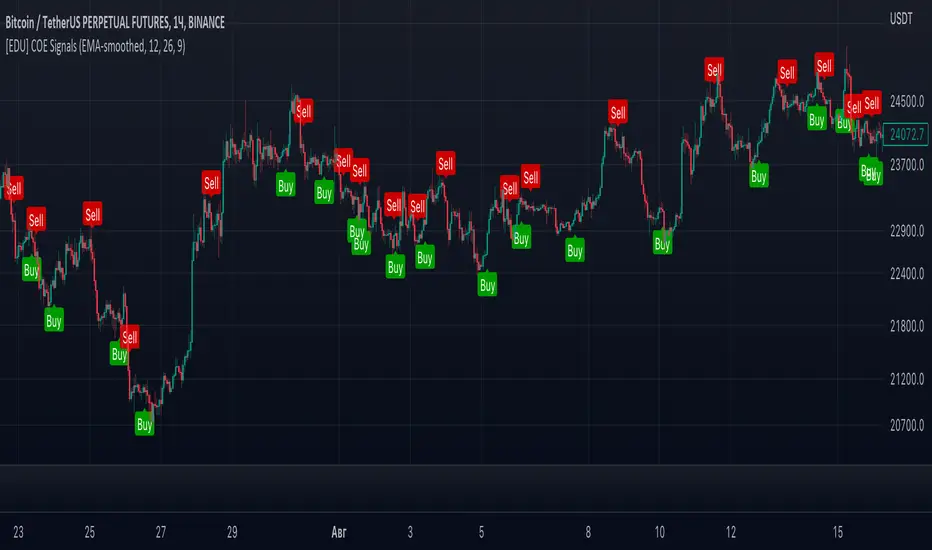
Close Open Estimation ( aka COE ) is a very simple swing-trading indicator based on even simpler idea. This indicator is from my educational series, which means that I just want to share with another way to look at the market in order to broaden your knowledge .
Idea :
Let's take n previous bars and make a sum a of close - open -values of each bar. Knowledgeable of you may already see the similarity to RSI calculation idea . Now let's plot this sum and see what we have now.
We can see, that whenever COE crosses over 0-level, uptrend begins, and if COE crosses under 0-level, downtrend begins. The speed of such signals can be adjusted by changing lookback period: the lower the lookback, the faster signals you get, but high-quality ones can be obtained only via not-so-fast lookback as when the market is consolidating or volatility is to high, there can be many garbage signals, like 95+% of other indicators have.
Let's explore more and calculate volatility of COE(v_coe in the code): current COE - previous CEO .
Now it appears that when v_coe crosses over 0-level, it's a signal, that this is a new low and soon the uptrend will follow. Analogically for crossing under 0-level .
I guess now you understood what these all are about: COE crossings show global trend signals , while Volatility COE ( v_coe or VCOE ) crossings show reversal points .
For signals I further calculated volatility of VCOE(VVCOE) and then volatility of VVCOE(VVVCOE). Why? Because for me they seem to be more accurate, but you are welcome to experiment and figure best setups for yourself and by yourself, I just share my opinion and experience .
COE can be helpful only in high liquidity markets with good trend or wide sideways .
If you want to experiment with COE, just copy the code and play with it. Curious of you will probably find it helpful eventhough the idea is way too simple.
By it's perfomance COE can probably beat QQE at open price settings.
(use open of the price at indicator to get zero repaint! )
Examples :
If you any questions, feel free to DM me or leave comments.
Good luck and take your profits!
- Fyodor Tarasenko
RU:
Close Open Estimation ( aka COE ) — это очень простой индикатор свинг-трейдинга, основанный на еще более простой идее. Этот индикатор из моей образовательной серии, а это значит, что я просто хочу поделиться с другим взглядом на рынок , чтобы расширить ваши знания .
Идея :
Возьмем n предыдущих баров и составим сумму a из close - open -значений каждого бара. Знающие люди могут уже заметить сходство с идеей расчета RSI . Теперь давайте построим эту сумму и посмотрим, что у нас сейчас есть.
Мы видим, что всякий раз, когда COE пересекает выше 0-уровня, начинается восходящий тренд , а если COE пересекает ниже 0-уровня, начинается нисходящий тренд. Скорость таких сигналов можно регулировать изменением ретроспективы: чем меньше ретроспектива, тем быстрее вы получаете сигналы, но качественные можно получить только через не- такой быстрый взгляд назад, как когда рынок консолидируется или волатильность слишком высока, может быть много мусорных сигналов, как у 95+% других индикаторов.
Давайте рассмотрим больше и рассчитаем волатильность COE(v_coe в коде): текущий COE - предыдущий CEO .
Теперь кажется, что когда v_coe пересекает уровень 0, это сигнал о том, что это новый минимум и вскоре последует восходящий тренд . Аналогично для пересечения под 0-уровнем .
Думаю, теперь вы поняли, о чем все это: COE пересечения показывают глобальные сигналы тренда , а пересечения Volatility COE ( v_coe или VCOE ) показывают точки разворота .
Для сигналов я дополнительно рассчитал волатильность VCOE(VVCOE), а затем волатильность VVCOE(VVVCOE). Почему? Потому что для меня они кажутся более точными, но вы можете поэкспериментировать и подобрать оптимальные настройки для себя и для себя, я просто делюсь своим мнением и опытом .
COE может быть полезен только на рынках с высокой ликвидностью и хорошим трендом или широким боковиком .
Если вы хотите поэкспериментировать с COE, просто скопируйте код и поэкспериментируйте с ним. Любознательные из вас, вероятно, сочтут это полезным, хотя идея слишком проста.
По своей результативности СОЕ может составить конкуренцию широко известному QQE, используя open цены.
(используйте open цены на индикаторе, чтобы получить нулевую перерисовку! )
Примеры :
Если у вас есть вопросы, пишите мне в личные сообщения или оставляйте комментарии.
Удачи и профита всем!
- Федор Тарасенко
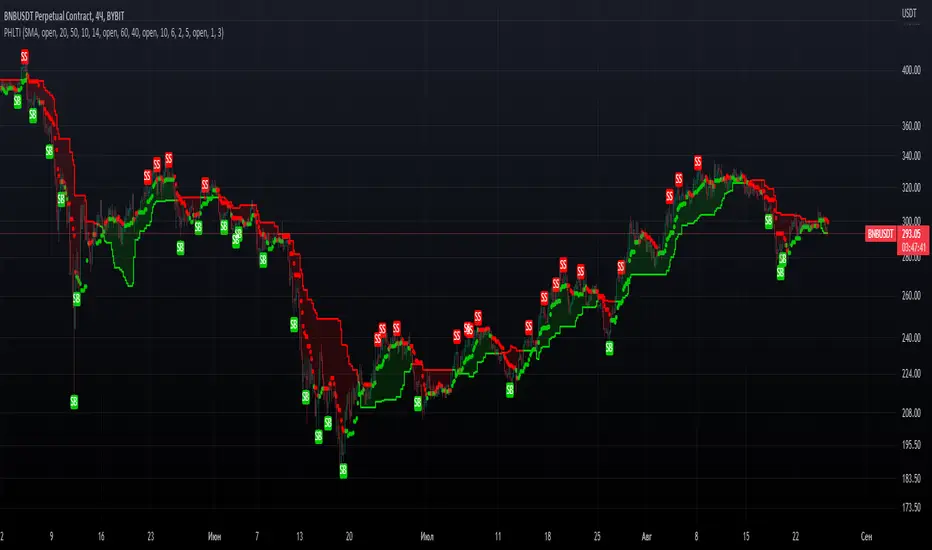
PrevHighLow Trend IndicatorPrevHighLow Trend Indicator which is calculated by using prev lowest and highest of p1 -period and p2 -period for two MAs.
First MA is made of prev highest of p1-period / prev lowest of p1-period.
Second MA is faster, made up of p2(<p1)- period(same formula).
Can be used in the next way: slower MA(straight line) shows main trend, faster shows temporary trend.
BUY, when first MA and second MA are green; Exit: second MA changes from green to red.
SELL, when first MA and second MA are red; Exit: second MA changes from red to green.
RSI Assistant basically filtres signals in the way, when signals from RSI and Faster MA are similar? it signals about it with labels: BUY for long, SELL for short. You can either enable or disable it. Also customizable so you can find your setup. RSI Assistant, depending on you customize it, can help you either follow trend or show reversals. Just find your own setup and watch things happen!
Feel free to leave valuable feedback and your setups which you consider to be good.
Hope you PHLTI usefull. Good luck!
God Number Channel v2(GNC v2)GNC got a little update:
1) Logic changed a bit.
I tried to calculate MAs based on the power(high - low of previous bars).You can see it the M-variables, as new statements were added in calculation section of MAs. I don't really know if I did right, because I didn't go too much in Pine Script. I just wanted to make a Bollinger-bands-like bands, which could predict the levels at which might reverse, using legendary fibonacci and Tesla's harmonic number 432. It's might sound as a joke, but as you can see, it works pretty good.
2) Customization :
No need to change Fibonacci ratios in code. Now you can do it in the GNC settings. Also MAs' names were made obvious, just check it out. Time of million similar "MA n1" has passed :)
3) Trade-entry advices :
I didn't tell you exactly the trade-entry advices, as I haven't explored this script fully yet :) But you probably understood something intuitively, when added GNC on the chart. Now I made things way more obvious:
1. Zones between Fib ratios show you how aware you should be of price movements. Basically, here are the rules, but you probably understand them already:
1.1 Red zone(RZ) : high awareness, very likly for price to be reversed, but if there is a clear trend and you know, than it might be a time for price to shoot up/down.
1.2 Orange zone(OZ) : medium awareness, not so obvious, as price might go between boundaries of OZ and continue the trend movement if such followed before entering the OZ. If price go below lower boundary of OZ and the next bar opens below this boundary, it might be a signal for SHORY, BUT(!) please consider confirmation of any sort to be more sure. Think of going beyond the upper boundary by analogy.
1.3 Green Zone(GZ) : if the price hits any boundary of green zone, it is usually a good oppurtunity to open a position against the movement(hit lower boundary -> open LONG, hit upper boundary -> open SHORT).
1.4 Middle Zone(Harmonic Zone)(MZ) : same rules from Green Zone.
IMPORTANT RECCOMENDATION : Use trend indicator to trend all signals from zones to follow the trend, 'cause counter-trending with this thing without stop loss might very quickly wipe you out , might if you will counter-trend strategy with GNC, I will be glad if you share it with the community :)
Reccomendation for better entries :
1) if the price hits the lower(or high) boundaries(LB or HB) zone after zone(hit LB or HB of RZ, then of OZ, then of GZ), it is a very good signal to either LONG, if price was hitting LBs , or SHORT, if hitting HBs .
2) Consider NOT to place trades when in MZ, as price in this zone gets tricky often enough. By the way, if you dont the see the harmonic MAs(which go with plot(ma1+(0.432*avg1)) ), then set the transparency of zone to 20% or a bit more and then it will be ok.
I will continue to develop the GNC and any help or feedback from you, guys, will be very helpful for me, so you welcome for any of those, but please be precise in your critics.
Thank you for using my stuff, hope you found it usefull. Good luck :)

God Number Channel V1 (GNC V1)Channel, made of 5 MAs, which a made this way: High of N-period SMA - Low of N-period SMA + X-period SMA (check the code), where N and X are defined by your input.
Main purpose: helps you understand in what range price can move.
WARNING!
HAS TO BE USED WITH OTHER INDICATORS TO HAVE MORE ACCURATE ENTRIES!!!
If the price is above or below the channel, it means that the movement is very strong and you count it as a trend, but be careful then the price returns to the channel, as correction will follow very soon. Use fib correction tool to understand the approximate depth of correction, works pretty good.
Recommendation: consider using the Vortex Indicator( len 21 and 14 are fine; for trend) and "Vumanchu Divergencies + B"(for anything, but calibrate for accuracy, otherwise there will be too much false signals). If you want to see more options where the price might go, just add new MA and add/substract to/from its value avg1*(any of fibonacci correction levels, I personally use 1.618 and 2.618 and for me it is ok): plot(show_ma1 ? ma1+( [ [ ]]]*avg1) : na, color = ma1_color, title="MA №1")
Recommendations and feedback are welcome(!)
Take your wins

Tesla CoilThis indicator reads the charts as frequency because the charts are just waves after all. This is an excellent tool for finding "Booms" and detecting dumps. Booms are found when all the frequencies pull under the red 20 line. Dumps are detected when all the lines drag themselves along the 20 line as seen is screenshots below.
Below is another 2 examples of a "boom". Everything sucks in before exploding out.
Below is an example of a dump:

BOSCILLATOR. A BOSS OSCILLATORI would like to first say I do not the indicator pieces. Would like to personally give thanks and credit to @MarkBench for coding this indicator and helping to get my vision for this system finally able to be published and used by anyone. I would also like the thank @lazy bear and @ChrisMoody for their bringing the Firefly oscillator and the SCHAFF TREND and the PPO price percentage oscillator to trading view. and @scilentor for his version of Godmode with LSMA . Thanks to @Shizaru for bringing Frama moving average (which we have adopted into the PPO as one of the base selections for the first time, as well as the ALMA ). Divergences have also been added. and components of the firefly have been removed such as the histogram. I have added two oscillators in the picture. The bottom is the standard settings. The above is how I prefer mine to look after tweaking the settings.
Before I get into explaining how its used. I want to say all the indicators are open and none privately owned or at least owned by indivduals who brought them to trading view. Any due permission is granted at my disclocsure. I also want to say this is not your typical mashup of indicators as the is a very clear way to view and use this specifically. Also I want to say original tools from their original scripts are also improved. For example the PPO being used we have added the FRAMA and ALMA moving average basis option which it did not have before. And now everything has clear divergences and some other minor changers. but here are the rules and examples.
THE BOSCILLATOR - A MULTI-LEVEL CONFLUENCE/CONFIRMATION FILTER VISUALIZATION
Some shorthand
(Main oscillator - firefly)
(background wave thing - PPO )
(the red vertical up and down line with red and green dots - STC )
(the blue, yellow and red dots - warning dots)
WHO IS THIS INDICATOR FOR? - This indicator itself is not meant to be a signal giver to buy or sell right now even though it could be and some of the original scripts are used as such. This indicator is actually meant to be a VISUAL CONFIRMATION & FILTER for trades taken in other methods outside of this indicator. What are some of those methods that may benefit from having this? Pivot point traders, FIB traders, Bollinger band traders, Moving average traders.. just to name a few. This indicator itself is meant to in a quick glance allow the trade to see the condition of many different elements outside of the main price and chart, and determine if that trade looks like it has too much risk, or if that trade looks suitable. It also provides a series of confirmations that could be used for adding to a position at different levels at the trade's discretion.
OPTIMAL CONDITIONS FOR CONSIDERING A SHORT = The PPO is orange/red + the STC is at the TOP + the Firefly is above the midline. The warning dots are being printed at the top. There is regular or hidden bearish divergence present.
OPTIMAL CONDITIONS FOR CONSIDERING A LONG = The PPO is light/dark green + the STC is at the BOTTOM + the Firefly is below the midline. The warning dots are being printed at the bottom. There is regular or hidden bullish divergence present.
Triggers for scaling/adding into your position = Keeping in mind that this oscillator on its own is not meant to be the sole reason for taking a trade, here are some triggers you will see for getting into position (preferably with the optimal conditions being met) The firefly flips from a green line into a red slide and vise versa. The firefly crosses the midline up or down. The STC begins going up/down and triggers a green or red dot while crossing one of the levels at 20 or 80. The warning dots being made begin to be printed lower/higher than the dot before last. The PPO shift from one color to the next in the favored direction of the trade you wish to make.
Signs for taking profit and protecting your trade = The Dots begin to print, the PPO changes colors at the top or bottom. the STC arrived are the top.
FILTER SITUATIONS TO AVOID TRADES = Wise to not take a trade if the PPO and the firefly do not agree. For example - if the PPO is showing green yet the firefly is still red may be an indication that it is getting a bit late for you to enter the trade. Same with opposing divergences and warning dots contradicting the trade you are looking at. The STC being already on the bottom or top may be a small indication that trade may already have been a little too ripe, but on its own is not always the case.
When selecting the PPO settings and moving average you are going to want it to be in favor of what you are trying to accomplish.IF you are one low time frames and trying to swing or scalp trade... chances are you want a reactive MA setting that iss responsive. Iwould recommend the HULL, ALMA, TEMA DEMA. For the Higher time frame the EMA or the T3 WDma can be wuite patient and helpful for a constant reminder of caution
Some notes - for the swing and scalp trading... in my experience the PPO moving average basis sees more responsive changes with the FRAMA , ALMA , HULL settings. for entering a trade, at least a couple of your triggers being present increases the success rate by a lot.
This chart illustrates the usefullness of having a Zero lag function for the firefly. The firefly should not be taken for signals or trades itself. However it is the most precise finder of divergences within the system. It is aways good to flip on and off zero lag just to take a quick look for divergences you might have mixed.
In this chart illustrates the general visual look and order of events to guide you along your way. Starts with the PPO turning green or red or orange which is potentially time to get out of your current trade. Then it switched colors when reversal begins and that is when you want to at the same time see the STC, the firefly, and lower caution dots coming in around the same area (highlighted in blue squares). Now near the end you see a red box. This is a filter aspect. The PPO is green, yet the others are saying down/short. This does not mean it must be a long, however it is great warning to maybe avoid getting to bearish for the downside in that time. You want the PPO and line up with the others and it should be visually apparent that they all want to go the same way.
Here is a list of some key elements (before changes this script made) of parts this oscillator includes. My original publication of my oscillation setup was blocked by the mods here.. this one however includes a large variety of items that have been altered from their original formats and a well-explained trading system to use it with.
// Firefly
Firefly Oscillator
// PPO
PPO PercentileRank Mkt Tops & Bottoms (@PuppyTherapy)
// Divergence
Divergence Indicator (any oscillator)
// Godmode
Godmode3.2+LSMA
// Schaff
Schaff Trend Cycle
// Frama
(FRAMA) Fractal Adaptive Moving Average

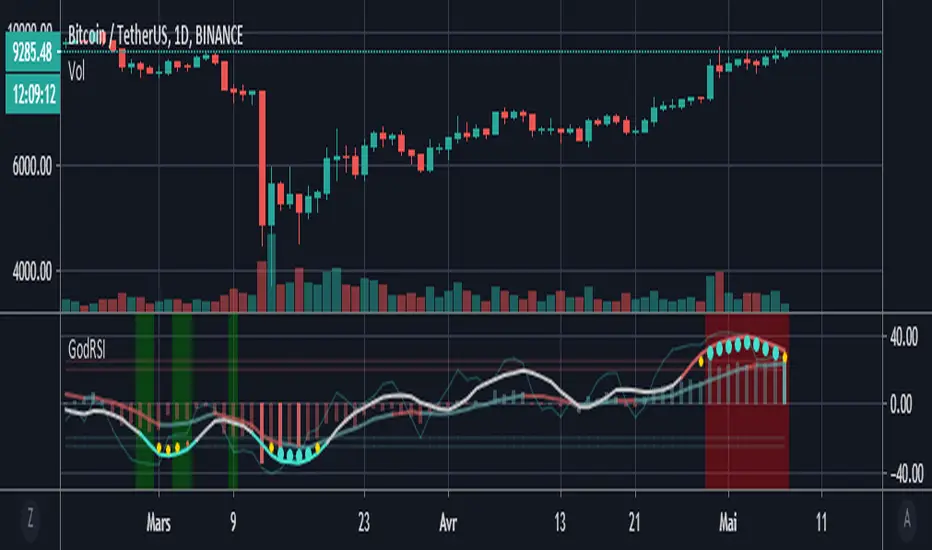
Godmode RSI with MFIBased on the Godmode indicators modified by LEGION, LAZYBEAR, Ni6HTH4wK, xSilas, oh92, sco77m4r7in and anise.
Big thanks to them.
Just an add on of the excellent script of anise.
I only added the possibility to chose the exchange and asset so that the multi exchange option can be used on other assets and the MFI's overbought and oversold highlights.
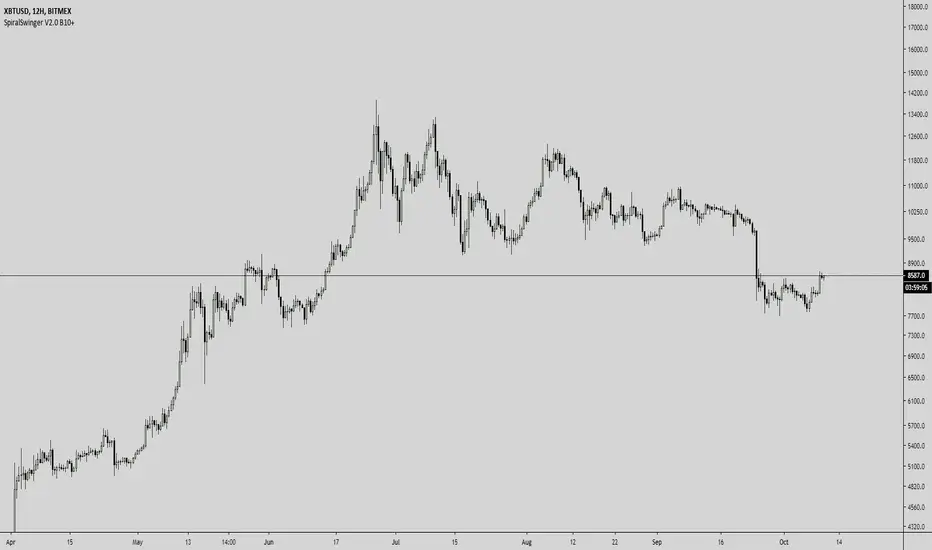
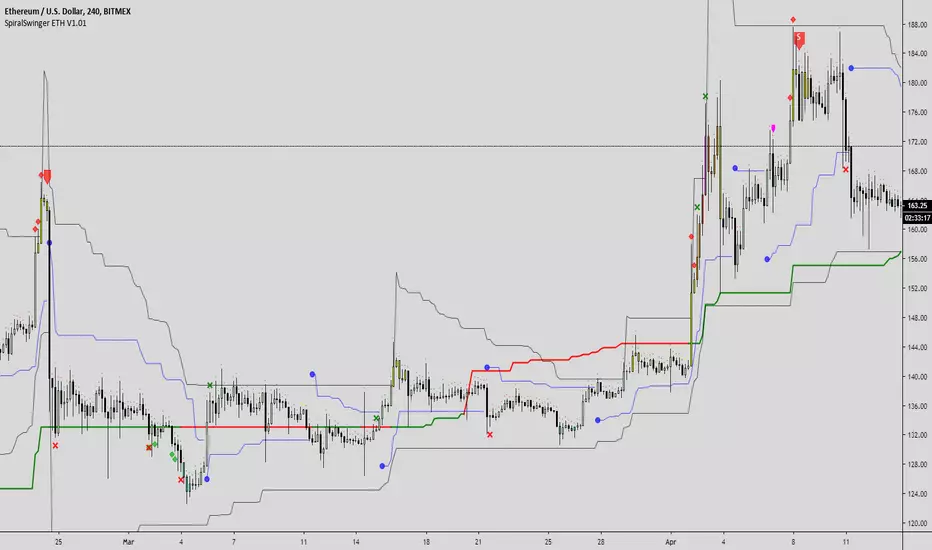
SpiralGrinder Ultimate Trading System SpiralGrinder Ultimate Trading System
SpiralGrinder Ultimate (SGU) is a unique type of Trading System dedicated for leverage-trading BTC on Bitmex platform. Since it's highly customized to give statistically reliable signals based exclusively on BTC/USD Perpetual Swaps BITMEX chart BITMEX:XBTUSD , using it with other BTC charts will give usable, but less reliable signals!
SpiralGrinder’s Ultimate first iteration was SpiralSwinger V1 indicator released in march 2019, since then much has been changed, different algos were developed and then thrown into the bin, until after 6 months of intensive work current version was developed, backtested on XBT/USD Perpetual Inverse Swap Contract chart from Bitmex exchange on whole chart history from late 2015 until January 2020, on these timeframes – 1d, 12h, 8h, 6h, 4h, 3h, 2h, 90m, 1h.
Indicator algo is based on idea of price being a so called "fractal" - when same price action patterns occur over and over from time to time on different timeframes be it 1D, 4h, 1h or even 15m! Every time a particular timeframe (TF) has suitable volatility and price action is exhibiting wave structure with distinct highs and lows there will be a situations when high probability trade setups are possible. To predict those recurrent situations SGU tracks more than 30 parameters (godmode oscillator and some it’s experimental derivatives, historical volatility coefficients, some time-based variables, ATR-based Trend lines, regular divergences… etc) comparing them against each other, so when “all stars are aligned” based on statistical model built into its algo and when price has enough potential to move in particular direction reaching some measured move target a SIGNAL to enter position is generated.
Theoretical True Winrate of this indicator is around 60%, while practical is somewhat under 50%. True Winrate is a percentage of trades that reached PREDICTED target be it 1R or 20R prediction, instead of just being a common winrate (used by most traders) - percentage of all profitable trades even though many of them didn’t reach initially predicted targets. True WinRate is tied to a signal generating algo implemented in SGU and cannot be changed unless a new more sophisticated algo is found by the developer of this indicator and is implemented in future updates!
Main User Interface of SGU consists of many elements that are developed to help manage trades more efficiently without any emotional impact on decision making process. Apart from obvious Long/Short signals there are also predicted targets that should be hit with some probability for every given signal, suggested stop loss levels corresponding to predicted RR. There are 4 ATR-based trendlines that help determine trend bias on current timeframe and to set intermediate take profit points on the way toward target, also there are indicators of regular divergences to show us weakness during uptrends and downtrends, also there are special warnings included when price closes behind particularly important ATR line with strength enough to continue further it’s movement in initial direction. Also there are 2 candle color-based systems available: one of monitoring how overbought or oversold is price on current TF, second is created to tell us overall trend sentiment - how strong is movement of price in particular direction.
Since price could move in the same fashion during prolonged periods of time there could be a particular TF when signals will be absent till price volatility and oscillator readings doesn’t change its character and become favorable (become synchronized with price action) for signals to be generated. That’s why this indicator should be monitored on multiple TFs at once – you’ll never know on which TF next signal will appear. There will be a multiple signals going on parallel at the SAME TIME, simultaneously in DIFFERENT DIRECTIONS: for example swing long trade based on signal from 12h TF, while having a scalp short at the same time based on 1h chart. Exploring this kind of optimized multi-tasking could be done only by splitting bankroll on multiple accounts registered on Bitmex platform.
Suggested timeframes to monitor for potential signals are empirically chosen that their round multiples should give 24H or 1440m=(24h x 60m) : 12h x 2 = 24h, 3h x 8 = 24h, 144m x 10 = 1440m=24h.
Therefore main timeframes are: 1D, 12h, 8h, 6h, 4h, 3h, 2h, 90m and 1h.
Additional timeframes to watch are: 288m, 144m, and 72m.
Timeframes under 1h aren’t tested yet, but could be traded with additional caution: 45m, 36m and 30m.
To track effectively all signals generated by SGU one should have at least PRO subscription plan paid on TradingView as this allows to use non-standard timeframes and maximum of 10 server-side alerts on price/indicators necessary to work with this indicator.
To do in near future: add volume weighted macd with custom settings as an additional confluence in algo to increase average win rate of signals.
Attention! Past performance of this indicator is not indicative of future results!
For those interested to dig deeper into logic behind using SGU a full 20-page pdf user manual is available for download here: drive.google.com
To gain free test access just write me a DM.

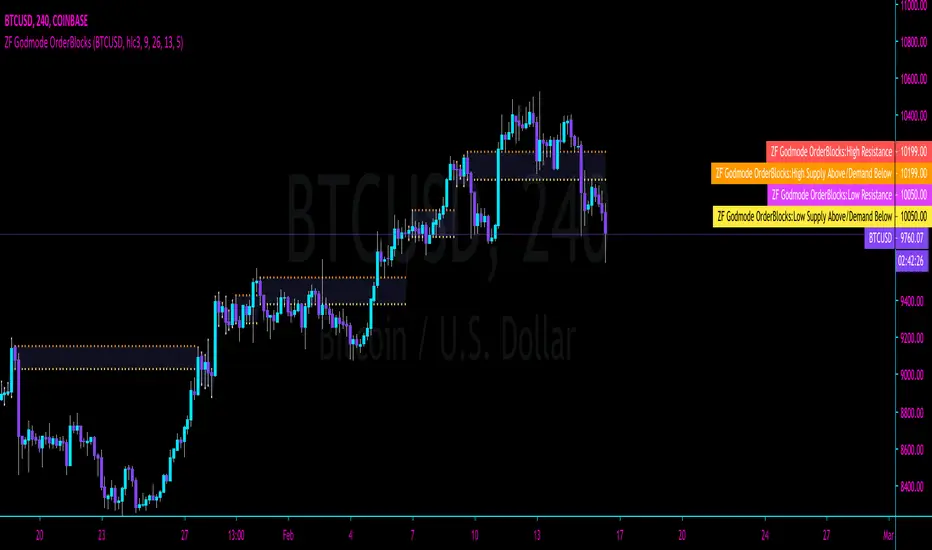
ZFelds' Godmode OrderBlocksPlots Orderblocks/Orderflow/Supply and Demand Levels based on Volume + EMA + RSI Levels.
When using this indicator, please make sure the "Benchmark" Ticker is set to the same chart/ticker you're working on.
The default Benchmark for this indicator is NAS100USD. If you are looking at ANY other chart, you will need to change the Benchmark from NAS100USD to the ticker you are using.
For instance, in this example - if you wanted to instead have the indicator plot OrderBlocks for BTCUSD, you would change the Benchmark setting from "NAS100USD" to "BTCUSD" as shown in the chart example.
Thanks for looking!
GODMODE trading suite Long = buy
Short = sell
Ema's and Sma's for support and resistance
Barcolors shows
Aqua and lime = strong signal (reversal point )
Fuchsia and red = mild signal (temporary reversal point)
Ema's available
55 (yellow)
99(aqua)
Sma's available
50 (red)
20 (green)

SpiralSwinger V2 by SpiralmanPre-release of Spiral Swinger V2 - a trading system based on godmode oscillator.
Please don't send requests yet, as it's in testing phase now, not for public use!
Free two week trial + user manual will be available after next update release.
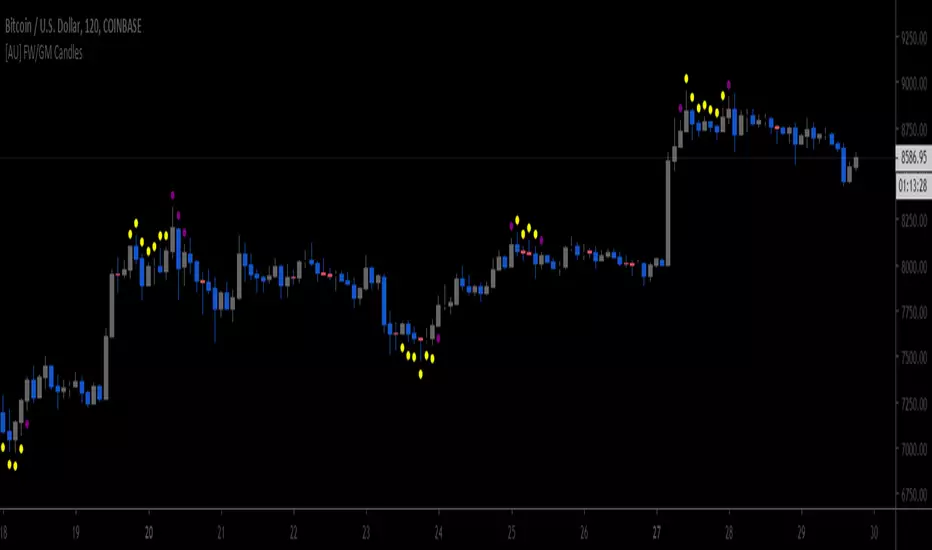
[AU] Waves+ Waves+ v0R7b
Plus version of Waves with components from both Waves Advanced and Mnemosyne. Essentially, Waves+ is highly configurable hybrid wavetrend oscillator and Fibonacci oscillator.
Slow wavetrend component replaced by Follower/Base from Mnemosyne indicator
TTM Squeeze Loose/Strict + Explosion Zones now enabled by default
Extreme Caution Fast Wavetrend Line, Fast wavetrend and Extreme Caution Fast WT cross signal now available
Disabled/removed to speed up script performance and load time: Divergence component, stoch k crossovers, T1 signals. Draw objects reduced from 89 to 64 to conform to Pinescript v4 requirements.
Large inactive code blocks stripped/removed to speed up performance and load time

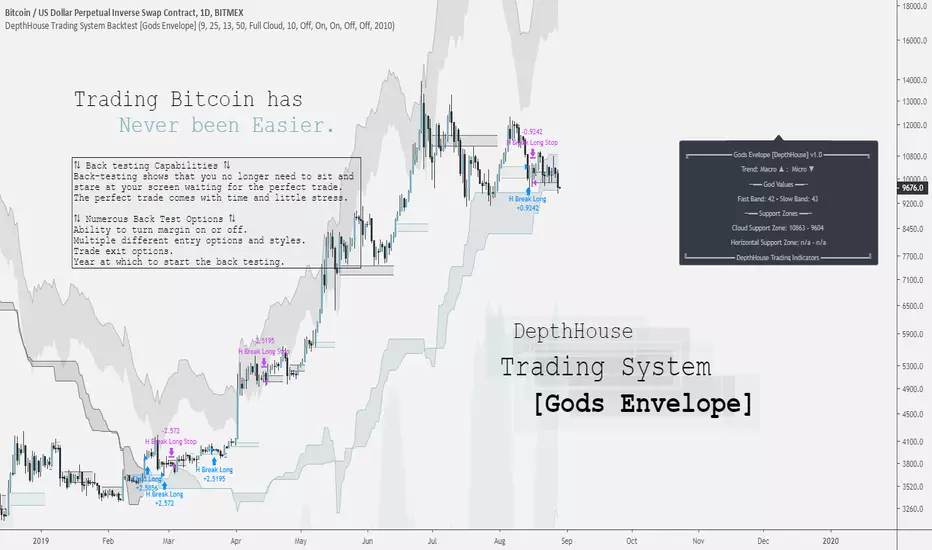
DepthHouse Trading System [Gods Envelope] Backtest StrategyCreated for Bitcoin!
*All testing has been done on the 1 Day time frame of BTC USD pairs.
Use at your own risk.
DepthHouse Trading System Basics
The Cloud:
The cloud is used in a very similar manner as the ichimoku cloud. A complete cross above or below the represents a macro trend change. The cloud then could be used as dynamic support and resistance zones.
By default there is no smoothing to the full cloud. If you wish to add smoothing, you can change the ‘Trend Base On’ option to ‘Modded Cloud Average’ to add price action and smoothing into the cloud’s calculations. The Modded Cloud can then be used in the same manner as the Full Cloud. Generally, the Full Cloud is more forgiving and has less Macro Trend changes. By default, this option is turned off. The support or resistance zone created will be shown on the info panel on the right.
Horizontal Levels:
A Horizonal zone is generated each time there is a micro level trend change. For example, as soon as a positive micro trend change occurs a green horizontal level will be plotted.
These levels then can be used as temporary support and resistance zones. The Horizontal Break Trading Strategy is entirely based on these levels. These levels are also shown on the info panel on the right.
The Envelope Itself: (by default this is off)
By selecting the Overbought and Oversold Ranges option, a cloud envelope will appear around the price action. This envelope represents the overbought and oversold ranges. If the price action should go into these zones, the info panel on the right will show ‘CAUTION’ beside the God Values as this signals that the pair is either overbought or oversold.
The God Values:
The God values are listed on the info panel on the right. These are the values created by the Godmode indicator. Generally, below 20 or above 80 it signals for caution as the price action has overextended itself.
The Back-Test Strategy Options:
⇅ - Child Fomo Positioning:
Child Fomo Positioning strategy is entirely based on the macro trend change with the center cloud. As soon as there is a complete candle close above or below the cloud and a trend change takes place. The back-test places a market order as soon as the next candle opens. By default, it then will not close this position until the price action fully crosses the cloud once again.
⇅ - Horizontal Break Trading:
Horizontal Break Trading Strategy is entirely based on the horizontal levels generated and the macro trend direction. For example, say the Macro Trend is up, and a green, positive horizontal level is formed. As soon as a complete candle closes above the upper level of the positive zone, a limit order is placed in hope that the price action comes back down and retests, filling the order. This long will not close then until a negative level is formed. As soon as a negative level is formed a stop/loss order is placed on the lower level of the horizontal support zone. It will then do the opposite in a bearish trend, and margin trading is turned on.
⇅ - Parent Positions :
Parent Positioning Strategy is based on the overall trend and the center cloud levels. This strategy has limit orders waiting on the level of the cloud that is closest to the price action. Therefore, using this strategy alone, the back-test system waits for the trend to be confirmed, and then follows the price action with limit orders waiting on the cloud to be retested. By default this order does not close until a Marco trend change occurs.
⇅ - Take 50% Partial Profits:
This options allows the back-test to take 50% profit or loss when one of the two options occur.
Horizontal Break: This would close 50% of the position in the same manner it would close a trade using the horizontal break trading system.
God Values: Once the price action enters the oversold or overbought clouds, it would then place a close order as soon as the price action exits the cloud.
⟲ - Backtest Year Start Date :
Start year of the back-testing. If set to ex. 2017, the back-test will not calculate any trades that took place before Jan. 1 of 2017.
⚖ - Margin Trading :
By default, margin trading is turned off. Simply switch this option to on the enable ‘Short Trading’ into the strategy back-test.
Notes: If you are back testing multiple strategies at the same time, you must increase the pyramiding to correspond to the number or strategies.
My Favorite Settings:
Margin = Off
Pyramiding = 2 [Settings → Properties → Pyramiding → 2 orders
Child Fomo Positioning = On
Horizontal Break Trading = On
Everything else off 😊
DISCLAIMER: Past performance does not guarantee future results.
Use at your own risk.

[AU] 5m BB SMA Dashboard Component5m BB SMA Dashboard Component v01
designed for use in a dashboard view using premium tradingview subscriptions to view 4x/6x/8x charts at once, 5m timeframe per ticker/chart
fast wave caution, sma cross, bollinger + bollinger breakout

Minimal Godmode 2.1// Acknowledgments:
// Original Godmode Authors:
// @Legion, @LazyBear, @Ni6HTH4wK, @xSilas
// Drop a line if you use or modify this code.
// Godmode 3.1.4: @SNOW_CITY
// Godmode 3.2: @sco77m4r7in and @oh92
// Godmode3.2+LSMA: @scilentor
// Godmode 4.0.0-4.0.1: @chrysopoetics
// Jurik Moving Average: @everget
// Constance Brown Composite Index RSI: @LazyBear
// Wavetrend Oscillator: @fskrypt
// TTM Squeeze: @Greeny
// True TSI/RSI: @cI8DH and @chrysopoetics
// Laguerre RSI (Self-Adjusting Alpha with Fractals Energy): @everget
// RSI Shaded: @mortdiggiddy
// Minimal Godmode v2.0:
// 6 BTC pairs/exchanges (instead of 11) to reduce loading time from the pinescript security() function
// Volume Composite for engine calculation
// TTM Squeeze on Wavetrend Signal
// Constance Brown Composite Index RSI (CBCI)
// TrueTSI (Godmode 4.0.0 implementation)
// Laguerre RSI (LRSI)
// Minimal Godmode v2.1:
// Removed TTM Squeeze and Volume Composite
// EMA for Wavetrend Signal
// Multi-exchange for BTC no longer the default
// mg engine toggle for CBCI, Laguerre RSI, and TTSI
// Wavetrend Histogram component toggle
SpiralSwinger ETHThis is the same swinger script based on multi-exchange algo of Godmode oscillator i made for BTC trading only. It's custom tweaked to be used for trading ETH/USD pair and ETH perpetual swaps on Bitmex. It doesn't work correctly on ETH/BTC pairs. Same rules apply for entry: after signal you enter position with half of the risk to be sure you are in a trade, then wait for pullback to average entry with other half of the risk. SL should be set to longest wick before signal. Trade should be managed on the same TF you received signal - take profit points and stop loss trailing are taken from current TF. In case you receive same signal for a same price region on higher TF but you are already in a position then switch managing of the trade to higher TF. Example: you recieved a short on 4H, then after a couple of hours you get another short but this time on 8H - switch to 8H chart and manage take profits and SL according to 8H. Best TF for using it is 4H, 6H, 8H, 12H. More documentation and FAQ to be shared later.
Minimal Godmode 2.0Second iteration of Minimal Godmode with in-line TTM Squeeze linked to godmode channel length, TTSI from godmode 4.0.0, and new LRSI + CBCI calculations for godmode engine.
Note: Like the original godmode, this indicator is designed specifically for use in trading BTC/XBT pairs.
Minimal Godmode 1.0// Acknowledgements:
// Original Godmode Authors:
// @Legion, @LazyBear, @Ni6HTH4wK, @xSilas
// Drop a line if you use or modify this code.
// Godmode 3.1.4: @SNOW_CITY
// Godmode 3.2: @sco77m4r7in and @oh92
// Godmode3.2+LSMA: @scilentor
// Godmode 4.0.0-4.0.1: @chrysopoetics
// Jurik Moving Average: @everget
// Minimal Godmode v1.0:
// Removed BITSTAMP:BTCUSD, added presets for 9-26-13 and 17-6-4, added more exchanges + USDT and USDC pairs to multi-exchange option
// JMA smoothing - more responsive + less lag than SMA at equivalent length settings
// Minor cosmetic changes to account for pinescript 3 transparency and z-order

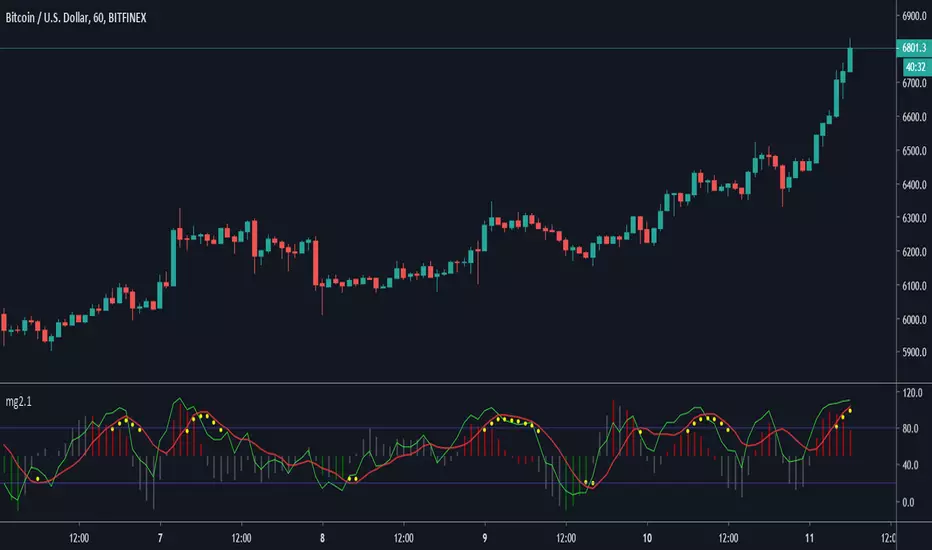
SpiralSwinger V1.0After 2 months of work i finally managed to complete a usable version of godmode-based signal indicator for BTC trading only - SpiralSwinger is dedicated for longer term trades as it works better on Hourly Timeframes. No repainting observed after candle close. All numerical settings are customized after fine tuning by me and are locked by purpose since i believe there are so many of variables that giving access to them will most probably spoil the algo.
It includes:
1. 3 categories of signals based on their possibility to work out and RR outcome - Safe, regular and risky entries.
2. Shows regular divergences between the last 60 candles.
3. Shows overbought/oversold levels by the means of 4color-coding scheme wich is handy for quick evaluating of buyer's/seller's strength.
4. Shows longterm godmode trend sentiment as color "snowflake" chars above candles.
5. Shows ADX-ATR based stop loss line which acts as a first take profit point when price crosses it.
6. Shows ATR based second take profit line which.
7. Shows signals for additional profit taking when price is observed to behave anomalous.
8. Alerts included: Long, Short, Set SL in Profit, Possible Signal Prediction warning, Take Profit
There are quite many aspects of using this indicator and will explain them later. For a time being it's access is restricted to a limited number of people i will invite to test it on a practice. When bugs will be found and removed, additional features added and all documentation written how to properly use it will start adding people. Thanks for patience and support.

Godmode StochasticGodmode Stochastic oscillator that can be used as alternative to Stoch RSI, since imho it better tracks price movements.
