Kozlod - Heikin-Ashi Bar Color Change StrategyYou can use this script to backtest Heikin-Ashi bar color change strategy.
You have to apply this script to usual candles and not Heikin-Ashi!!!
Background color indicates HA bar color. On change you'll see green/red arrows and alert will be fired.
Also you can find in the code calculations of all HA OHLC values.
Heikinashi

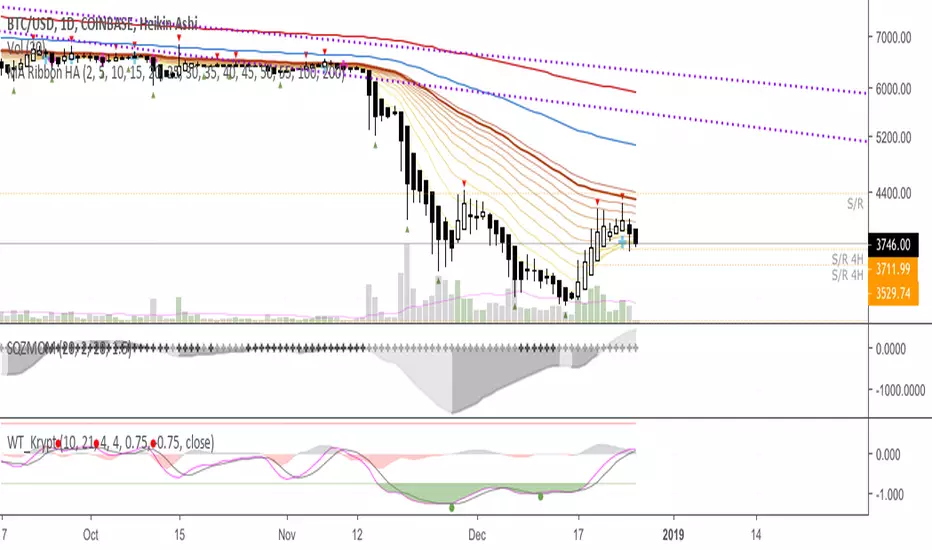
MA Ribbon HA* Inspired by Krypt's and Madrid's Ribbon
* Supplemental to bullish or bearish trend confirmations with Heikin Ashi candles (e.g. 10/20 MA cross)
* Default of: MA 5-55, 100 and 200
* Ability to switch between Simple vs Exponential MAs
You may switch color gradient by using this tool,
www.perbang.dk
Hope this helps. Please do let me know if you know how to script the wishlist below =)
Thanks!
---
Wishlist/to do next:
1. Be able to do this color change on counter-trend by implementing this script from Madrid's:
leadMAColor = change(ma05)>=0 and ma05>ma100 ? lime
: change(ma05)<0 and ma05>ma100 ? maroon
: change(ma05)<=0 and ma05=0 and ma05
change(ma)>=0 and ma05>maRef ? lime
: change(ma)<0 and ma05>maRef ? maroon
: change(ma)<=0 and ma05=0 and ma05
na(src ) ? na : src
...
price = dropn(src, dropCandles)
3. Be able to update line thickness of E/MA 10 & 20, as well as their colors.
4. A way to input two HEX colors and automatically update the ribbon lines to have those color gradient.
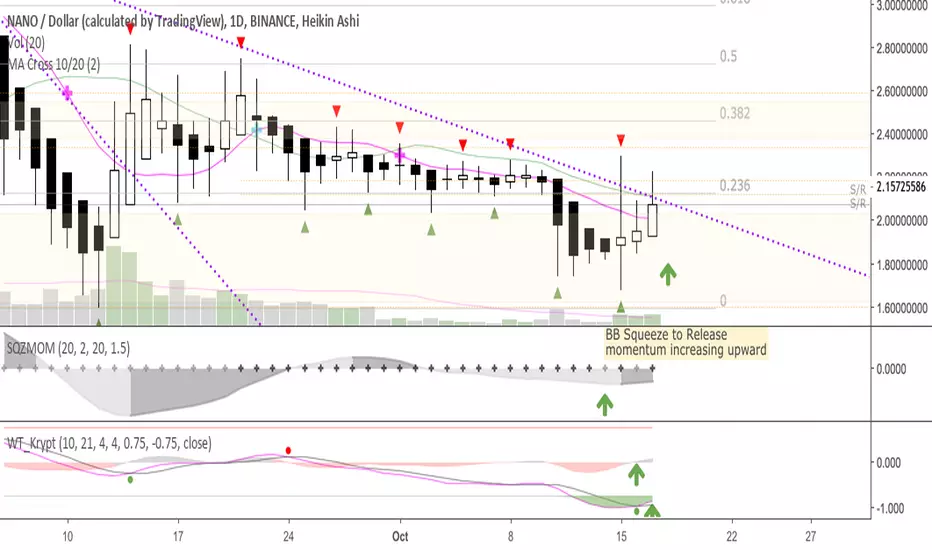
MA Cross 10/20This was originally derived from "MA Cross" indicator, though that one uses 9-21.
Simple 10day and 20day MA crossover indicator
* 10MA crosses from the bottom, goes up and above 20MA—we're bullish, look to long bullish signal candle
* 10MA crosses from the top, goes down and below 20MA—we're bearish, look to short bearish signal candle
Works well w/ Heikin Ashi candles
Kozlod - Heikin-Ashi Bar Color Change AlertsYou can use this script to setup alerts on Heikin-Ashi bar color change.
You have to apply this script to usual candles and not Heikin-Ashi!!!
Background color indicates HA bar color. On change you'll see green/red arrows and alert will be fired.
Also you can find in the code calculations of all HA OHLC values.

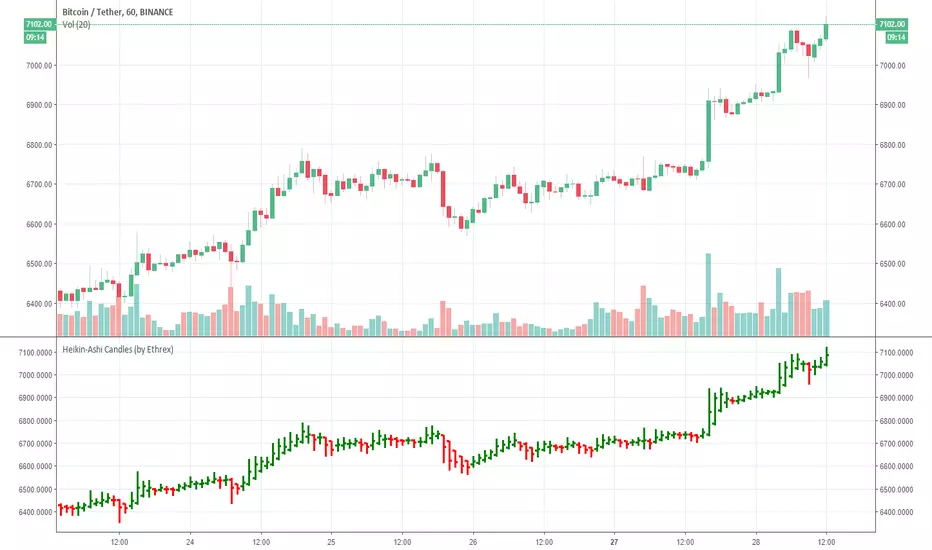
Heikin-Ashi Candles (by Ethrex)Allows to see how Heikin-Ashi candles are computed and see the bars side-by-side with normal prices.
quit your bullshit! Heikin-Ashi Backtest with Real Candle ValuesMade in a few minutes to debunk all the bullshit going around tradingview and everywhere about "heikin-ashi" being a holy grail trend indicator.
Do not be deceived.
Heikin-Ashi is a beautiful way to remove much of the noise in markets, and is light on the eyes. (nice and smooth!)
I personally use heikin-ashi as a way to remove a lot of the clutter in the markets, allowing me to trade with less emotion.
While heikin-ashi is a great way to visualize trends, it is NOT a good trend indicator because its displayed values do not align with actual trading values.
Therefore, entry and exit points for many of the ideas published about heikin-ashi for trade are inaccurate.
::: When Heikin-Ashi changes colour for x candles, a new trade is created on the open of the following real candle.
In practice, Heikin-Ashi is much closer to break even.
As tested, Heikin-Ashi trend trading works better on pairs that have clearer definitions of trends and are less often in consolidation. (ex. USDJPY)
Usage:
Switch to normal candlestick chart.
Features:
Change the period for new trades. (For example: x amount of red candles after a green candle to signify short trade)

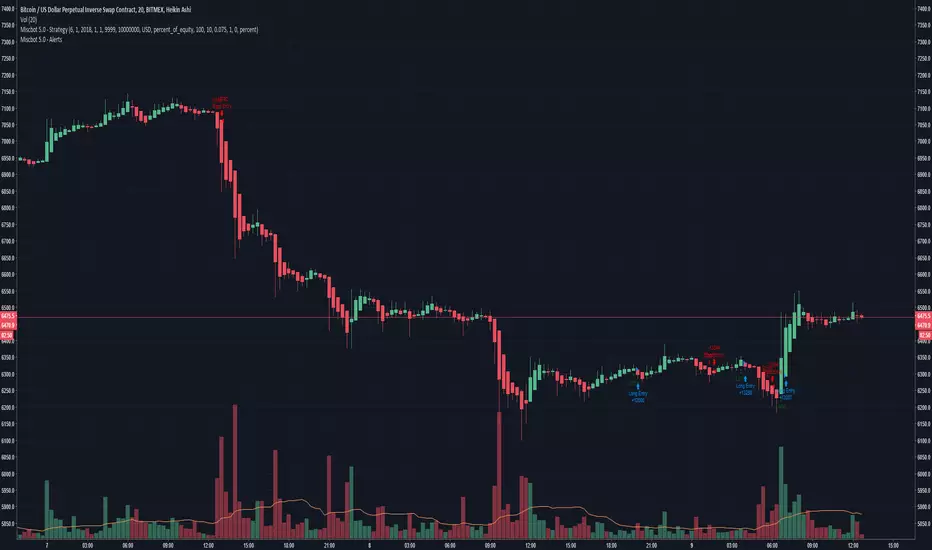
Miscbot 5.0 - StrategyA general strategy for BitMEX that uses a combination of indicators and filters to determine long and short zones.
Tested and coded for 20m. Use at your own risk. I take no responsibility for lost currency.
BitMex referral - 10% off fees: : www.bitmex.com
I have also converted the strategy to a bot that can be used with autoview to make the trades for you.
-Pinescript v3
-Heikin Ashi candles
-20m
Heikin Ashi Historical TF Developmental BarsAn improvement to the built-in security(heikinashi()...) method, this indicator plots Heikin Ashi (HA) candles for an input timeframe (TF) on an underlying regular candlestick chart of a shorter TF. The improvement is that it plots the value of each in-development HA bar as it would have appeared while still repainting, for each underlying chart bar. The last chart bar of each TF matches the value available from security() calls and from HA charts directly.
For best results, be sure to use a HA TF greater than chart TF (I prefer 1 minute unless longer history is required).
1 hour HA on 1 minute underlying price chart
4 hour HA on 1 minute underlying price chart
V3: Release.

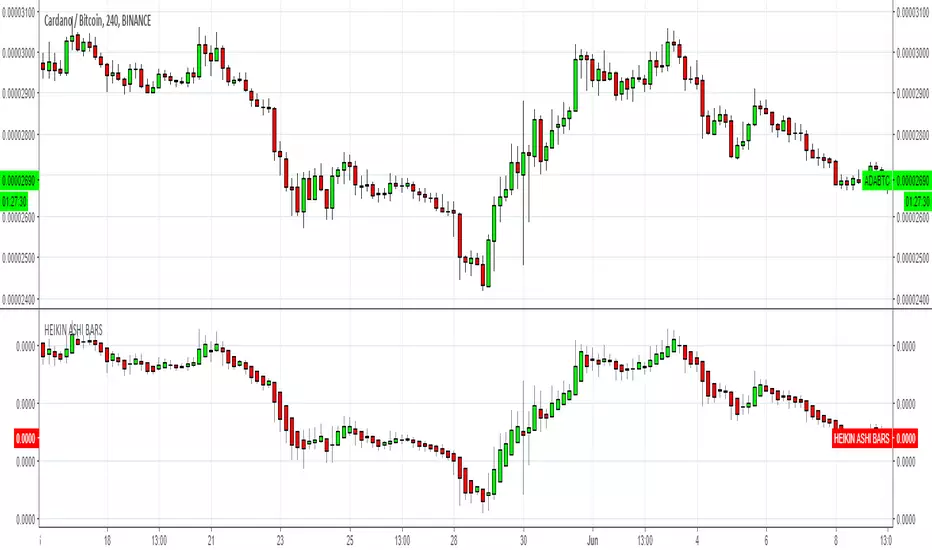
HEIKIN ASHI BARSSimple Heikin Ashi candlebars
Please consider a tip if you find this useful
BTC: 3FiBnveHo3YW6DSiPEmoCFCyCnsrWS3JBR
ETH: 0xac290B4A721f5ef75b0971F1102e01E1942A4578
Heikin Ashi Smoothed (yasinipek) by KIVANC fr3762Heikin Ashi Smoothed Strategy
A trend trading forex system composed of the Smoothed Heiken Ashi candlestick indicator and moving averages. It works best on the 1 hour charts and higher time frames.
buy when blue line crosses above red
conversely sell when red line crosses above blue
Author: Yasin İpek @yasinipek83 on twitter / www.yasinipek.com & KıvanÇ @fr3762 on twitter (tweets are only in TURKISH)

Heikinashi Simple BacktestV74: Strategy version of historical intra-bar long TF Heikin Ashi candlestick development analysis.

Heikin Ashi Historical TF Candles, with AlertsRunning on 1-minute regular candle chart, this indicator plots the HA candles of any timeframe, recalculating the in-process values of that candle during each minute of its life.
Also contains our AV trading signals, and data gap detection/trade prohibition.
V72: New indicator.

Modified Heikin Ashi CandlesThis study optionally modifies the Heikin Ashi (HA) open and HA close values.
HA open is traditionally equal to the mean of the previous HA candle's open and close values, but this modification shifts the HA open in the direction of a trend (more precisely, in the direction of and proportional to the 1-bar change in HA close).
HA close is traditionally equal to ohlc4, but this modification bases it on hlc3, improving dynamic sensitivity.
V17: Initial release.


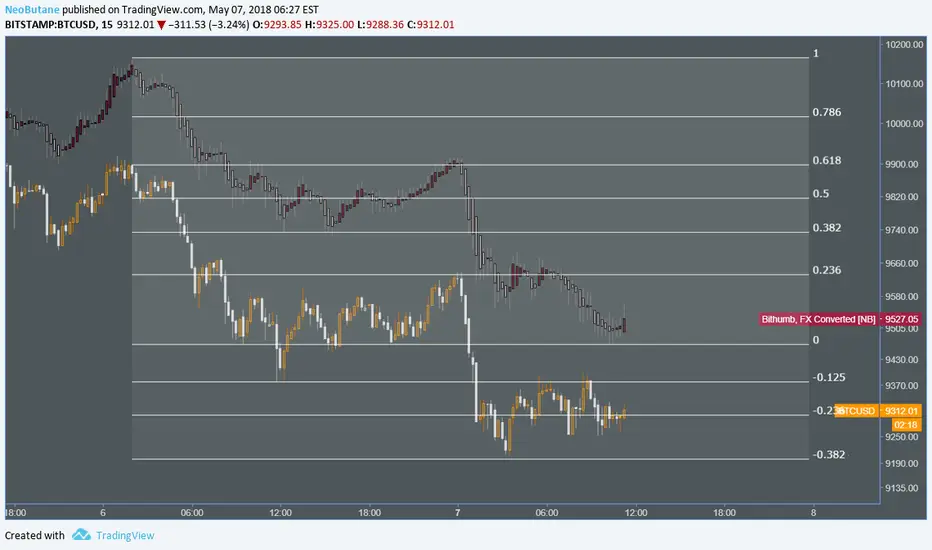
Bithumb BTCKRW, FX Converted [NeoButane]Uses live FX index. Index can be changed to your preferred currency.
Achmed: Heikinashi Open/CloseHeikinashi strategy that looks for large % changes between the open and close of a bar or the previous open and current close.
This strategy is published for customer verification and acceptance. As such, only the customer shall be granted access.
Features
Heikinashi based strategy that is run on a normal candle chart. This ensures accurate backtest results.
Heikinashi chart is plotted on a subplot
Inputs for defining different entry conditions
Switches to turn different entry criteria on / off
Trailing stop which trails the Heikinashi prices.
Trailing stop plotting on the subplot


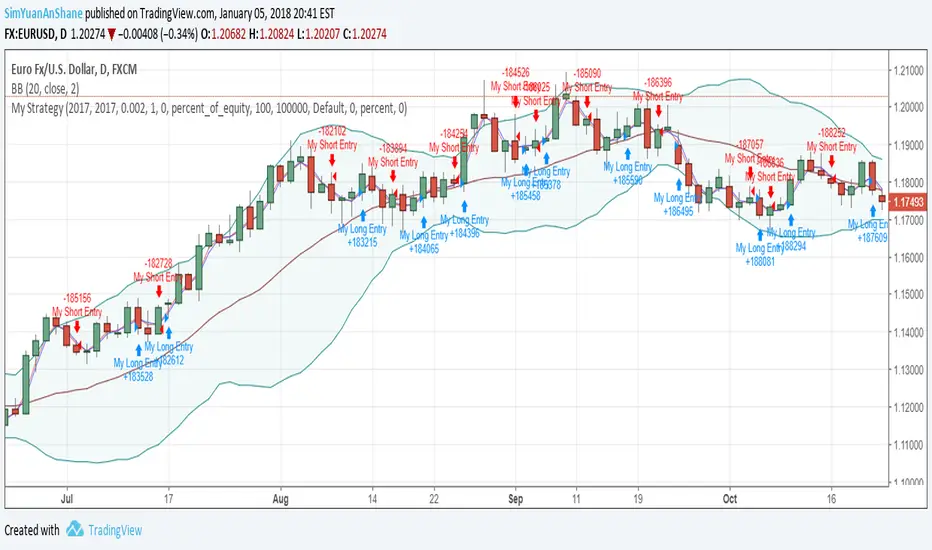
Trend following with HAThis is my first script and it is basically a MA crossover/under strategy that uses heikin ashi closing prices. I've also used limit orders based on HA opening prices of the previous day for entry which improves the performance. However, this impose a restriction when prices are moving too fast and the algo is unable to enter the trade, resulting in a bad position for a long period, which I believe is preventing this strategy from performing better. Will appreciate any comments/ suggestions to improve this (such as enter market prices the next day when failed to enter on HA price - not sure if this is possible) as I'm still starting out and will be more than happy to learn from the community here. Cheers!
CB SDB HK VOL IndicatorIndicator version of designed for use with independent automation solution.
Custom development published for customer verification and acceptance.
If you are interested in development services, please visit the backtest-rookies website or message me to find out more.

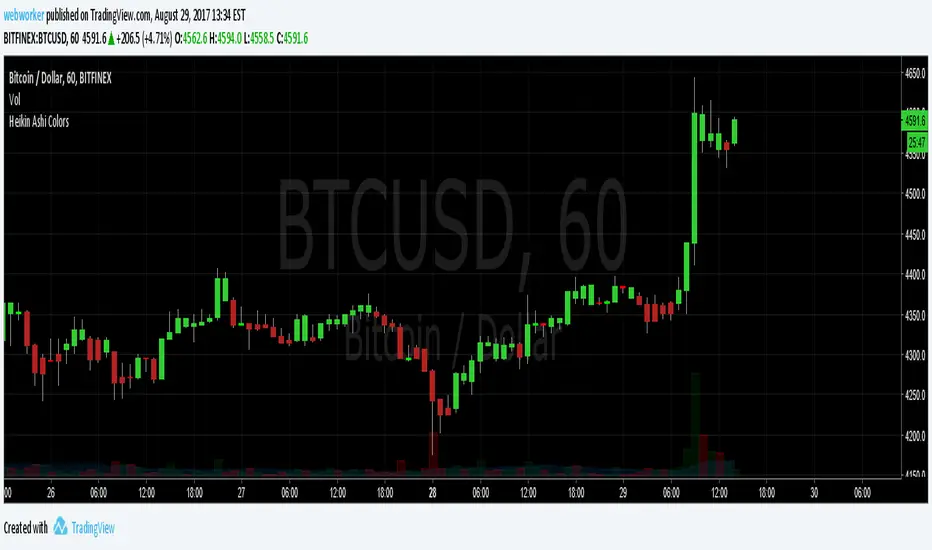
Heikin Ashi ColorsThis script simply changes the colors on your candle and hollow candle charts to Heikin Ashi style colors without changing the values of the bars.
Great for visualizing trends, but getting an accurate picture of prices!