Volume Momentum‴ | Volume Momentum Colored HistogramVolume Momentum‴ is a Volume Pressure indicator that allows you to have a better understanding and interpretation of its behavior once you are able to see it through an histrogram.
Notice that is histogram has intern bars that allows you to understand the forces of the pressure (positive or negative forces).
This indicator allows you to see the end of the highest price tick which allows you to sell right before price drop.
What is the best is that you can use it with any kind of graphic that it will always considere the real open, close, high and low trading values.
To have access to this indicator, please contact me at: contato @ moneywise . com . br
Believe me, this indicator will make your life much easier!
Histogram

BOSS Smooth Stochastic RSI Histogram Oscillator With Alerts THE BEST FOREX, BINARY OPTIONS, AND CRYPTO INDICATORS FOR TRADINGVIEW.COM
Our smooth stochastic rsi in column form with buy and sell alerts.

Combo Strategy 123 Reversal & (H-L)/C Histogram This is combo strategies for get
a cumulative signal. Result signal will return 1 if two strategies
is long, -1 if all strategies is short and 0 if signals of strategies is not equal.
First strategy
This System was created from the Book "How I Tripled My Money In The
Futures Market" by Ulf Jensen, Page 183. This is reverse type of strategies.
The strategy buys at market, if close price is higher than the previous close
during 2 days and the meaning of 9-days Stochastic Slow Oscillator is lower than 50.
The strategy sells at market, if close price is lower than the previous close price
during 2 days and the meaning of 9-days Stochastic Fast Oscillator is higher than 50.
Second strategy
This histogram displays (high-low)/close
Can be applied to any time frame.
WARNING:
- For purpose educate only
- This script to change bars colors.

4H MACD Histogram on 1HIndicator is designed for 1 hour time-frame and it shows the value of 4 hour MACD histogram

Absolute Strength HistogramThe Absolute Strength Histogram
Absolute Strength Histogram is composed of two separate signals - Bulls and Bears. Both signals are plotted on the same graph. By doing so we can see the strength of the buyers and sellers in comparison to one another. When the Bulls Signal is above the Bears Signal, the histogram is blue and the market tends to be trending up (go long). When the Bears Signal is above the Bulls Signal, the Histogram turns red and the market tends to be trending down (go short).
There are two methods for calculation, the RSI and the Stochastic, and both have their merits.
There are also several smoothing algorithms added that you can select from the drop-down. Note that higher smoothing will notify you of trend changes later. Lower smoothing will give you quicker signals at the cost of more errors (false signals or noise).
Happy Trading :)

MACD - Baby WhaleI spiced the standard MACD indicator up a bit to make it more visible.
When using the MACD:
1. Never go short when the MACD lines are in the negative.
2. Never go long when the MACD lines are in the positive.
3. Always wait for an uptick / downtick on the histogram before you start your trade.
The MACD Histogram can also show you Divergence.
When the price goes up but the Histogram can't make new highs, it might be a good time to think about shorting.
If you want access, just send a message please.
Much love from Baby Whale!!
🙏❤️🐳

Top 10 Forex Swing Screener V 1.0
Top 10 Forex Swing Screener
Options:
Left-bars and Right-bars look back to find Top | Bottom point.
Set Alarm: After add script on your chart, click on add alarm and select the scrip name below your chart symbol, then select alarm you need and add.
Guide for colors and shapes:
Green: Price Cross Over high swing.
Red: Price Cross Under low swing.
Orange: Price Cross Over low swing or Price Cross Under high swing.
Green Triangle Up: pivot High in symbol.
Red Triangle Down: pivot Low in symbol.
Note: The script operates independently of the chart you in. for use this script, you can favorite it and then apply to any chart.

DiNapoli MACD (DEMA)DiNapoli MACD (DEMA) is a custom indicator used in the context of identifying the position of strong hands.
This version of the indicator includes the following features :
Show/Hide the Oscillation Lines
Highlight Cross with Signal Line
Show Zero Line
Show Divergences (experimental)
For convenience it also includes Custom Alerts . Now it is possible to get alerts on:
Alert on MACD Cycle Shift
Bullish MACD Signal
Bearish MACD Signal
Possible Regular Divergence
Possible Regular Bullish Divergence
Possible Regular Bearish Divergence
This indicator is meant to be used by professional traders.
If you would like to subscribe , please send me a private message.

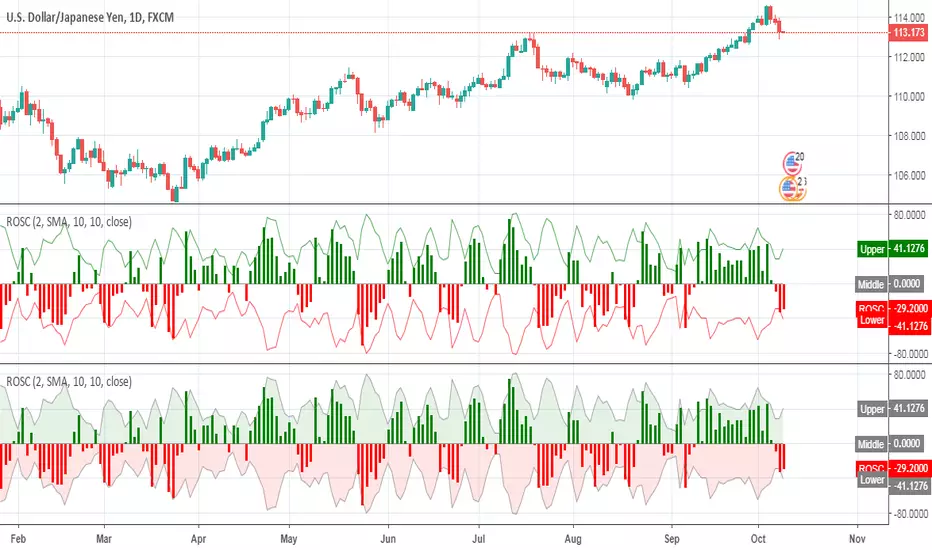
Rainbow OscillatorRainbow Oscillator script.
This indicator was developed and described by Dr. Mel Widner (Stocks & Commodities V.15:7: Rainbow Charts).
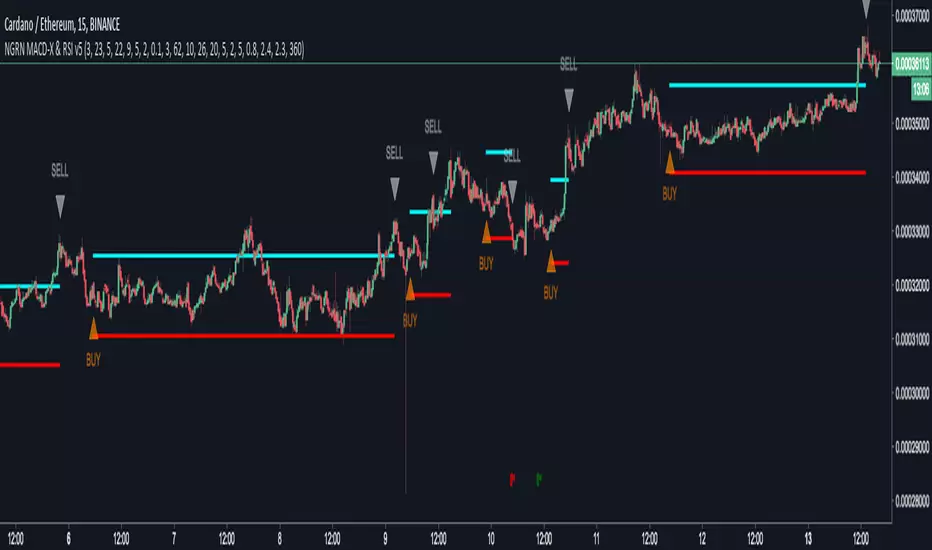
NGRN MACD-X & RSI v5MACD-X, RSI & Volume Indicator & Alerts Study - Version 5
Overview
This study and it's associated strategy were modeled after the famous Philakone described algorithms on his now defunct instructional video series.
This indicator allows for full customisation of parameters and interaction between three indicators that allow users to shape their trading methods to their desired goals.
This associated strategy also allows users to backtest the study alerts script and find the best settings towards that end.
MACD + RSI + VOLUME - are of the most powerful and widely usded indicators, MACD/Histogram crosses, coupled with RSI & Volume increases/decreases will detects areas of deeply oversold / overbought and buys/sells on the reversal
Features
Full customisation - All parameters are open for customising to allow the trader to build their own strategy and adapt from market to market.
Clean/Simple UI - Facilitating ease of use.
Enable Buying OR Selling, - or have them both active at the same time.
Toggle off and on ALTERNATING Buy and Sell feature (pyramiding) - to allow for consecutive DCA style buys or SCALING out of an entry (partial sell).
Customizable Stop-Loss plot - to enable users to create a STOP-LOSS alert option or other alert(s) based on the plot location. See settings screenshot.
Toggle Auto Stop-Loss sell option - to enable users choose whether or not to automatically issue a sell signal when close crosses stop loss plot, or choose to toggle off if not profitable.
Customizable Take-Profit plot - to enable users to create a TAKE-PROFIT alert option or other alert(s) based on the plot location.
Study and associated Strategy - to use the TradingView ‘Strategy Tester’ back-testing features to find the best alert settings for specific coins in bear, bull and sideways markets.
Changes Version 5
Added STOP-LOSS time-out period where users may specify a duration of trading pause time after a stop-loss has been triggered. A value of zero disables the feature. Time out start is indicated by a red flag icon and resumption is indicated with a green flag.
Settings
SCREENSHOT LINKS:
BUY SETTINGS: prntscr.com
SELL SETTINGS: prntscr.com
Access
For a 4 DAYS TRAIL, sign up as an Explorer subscriber @ Patreon page: www.patreon.com
Full Access is 0.25 ETH , one time fee for LIFETIME access to the STUDY indicator, STRATEGY and future updates as well as support and SETTINGS for various markets on the Binance Exchange.
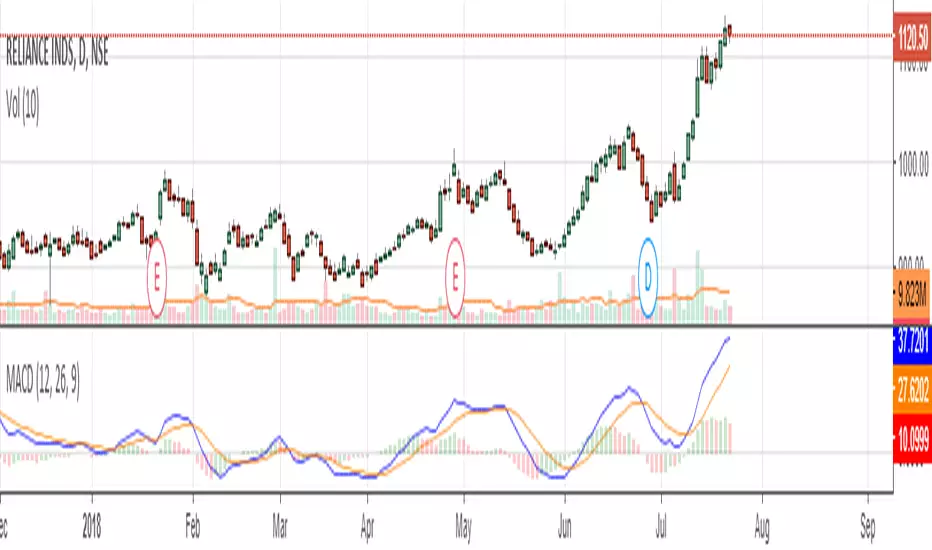
Moving Average Convergence/Divergence LineMACD Line instead of MACD histogram or area. This gives more opportunities to catch divergences.
I showed regular MACD Histogram on top and then this indicator on bottom and showed with the red and green lines where you could catch multiple bearish and bullish divergences using this indicator vs a regular MACD histogram.
Send me a private message to join my trading group.
Thank you.


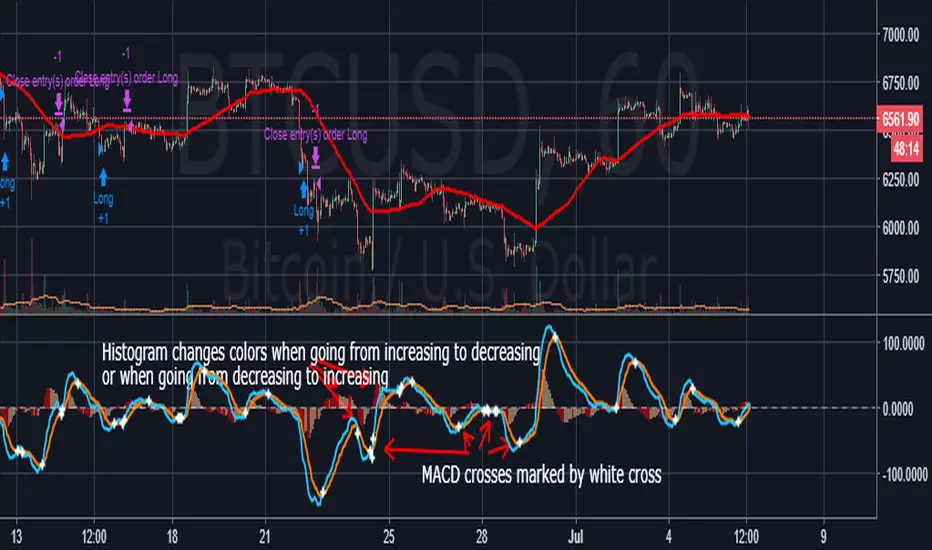
Better MACD with clearer cross and histogram signalsSimple but much needed visual improvements to the default MACD script. First, every time the MACD and signal cross, a white cross is placed on he chart, which lets you quickly identify the crosses. Second, whenever the histogram goes from increasing to decreasing or from increasing to decreasing, a color change occurs. Colors can be customized under "Style" tab under settings.
Efmus System : 10 indicators in 1
10 indicators in 1
MACD
RSI
PIVOT weekly:best
200 sma
100 sma
75 ema
55 ema
50 sma
20 ema
Golden EMA Crossover 13/48 based on tests Results of 1750 Moving Average Crossovers :
etfhq.com

Laguerre PPO 4C4 Colored Laguerre PPO
lime = positive rising
green = positive descending
red = positive descending
maroon = positive rising
Enjoy :)
www.tradingview.com(PPO)
The Laguerre Filter is a smoothing filter based on Laguerre polynomials.

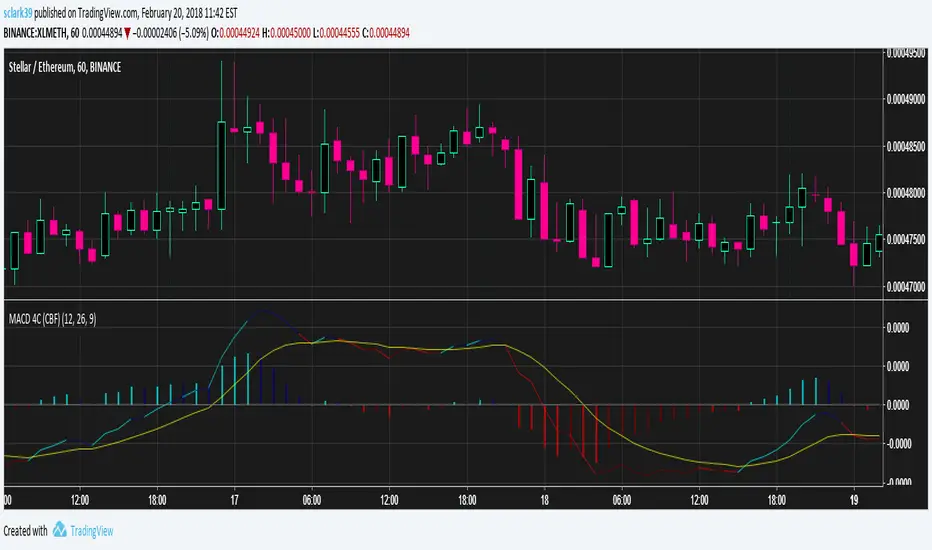
MACD (4 Color, Color-Blind Friendly)Working MACD Histogram which colors bars based on the slope from the previous. The default colors will work for both Deuteranopia and Protonopia color-blind people but can be modified.
There is a bug with 'MACD 4C' by vkno422 + signal line - squattter and 'MACD for colour blind people' by cfhrtd in that it draws the MACD line itself as a histogram, rather than drawing an MACD histogram (which is the MACD line - signal line).
Bad indicators that this should replace:
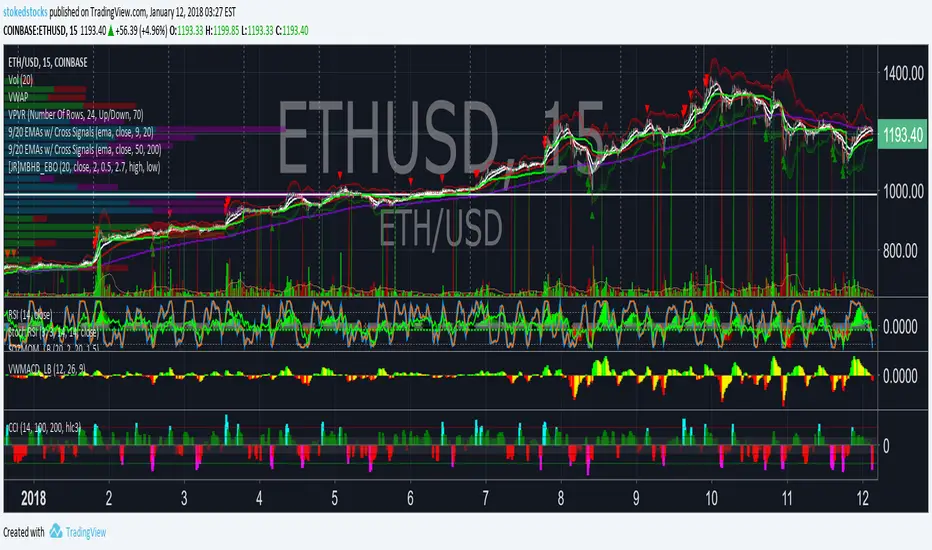
CCI Histogram w/ Color STOKEDSTOCKSCCI Histogram w/ Color Has EMA option to calculate CCI STOKEDSTOCKS
Finds oversold and Overbought conditions
Price and EMA Difference Customizable [Requested script]
Easy options, you can toggle the lines and other things. Even turn of the histogram.

TRIX Histogram R1-12 by JustUncleLCreated by request.
Description:
This study is an implementation of the Standard TRIX indicator (a momentum oscillator), shown in coloured histogram format by default, with optional Bar colouring of TRIX zero cross overs. Other options include showing TRIX as a line graph instead of histogram and an optional TRIX signal line with difference histogram (to highlight signal line crosses).
References:
forex-indicators.net
"TRIX MA" by munkeefonix

Pine Script Tutorial #4Welcome to Pine Script Tutorial #4
This is more complex than the previous 3 tutorials. This one builds upon the first 3 tutorials.
What does this code do?: It plots on a histogram (at the bottom), the difference between closest round number and the close. So for example 84 -close = 16 pips. It shows the 16 pips on the histogram.
First off, it is actually Two studies on this graph, not one. I wanted the histogram at the bottom and round number indicator to overlay on the graph. There is no code within Pine Script that lets you do that within one script.
Secondly, there is no code that lets you spit out number on the graph, that is why I used histogram, initially I wanted it to tell me 16 pips in writing but no way of doing that.
In order to replicate the graph you have to first plot the rounding formula as overlay. Thean take out the overlay and plot te histogram.
I got the rounding formula from one of the coders here and simplified it. Just search round.
Hope this helps,
Feel free to comment.

Bill Williams Divergent BarsBill William Bull/Bear divergent bars
See: Book, Trading Chaos by Bill Williams
Coded by polyclick
A bullish (green) divergent bar, signals a trend switch from bear -> bull
-> The current bar has a lower low than the previous bar, but closes in the upper half of the candle.
-> This means the bulls are pushing from below and are trying to take over, potentially resulting in a trend switch to bullish.
-> We also check if this bar is below the three alligator lines to avoid false positives.
A bearish (red) divergent bar, signals a trend switch from bull -> bear
-> The current bar has a higher high than the previous bar, but closes in the lower half of the candle.
-> This means the bears are pushing the price down and are taking over, potentially resulting in a trend switch to bearish.
-> We also check if this bar is above the three alligator lines to avoid false positives.
Best used in combination with the Bill Williams Alligator indicator.
