Stochastic HistogramLast Edited: 5/19/16
Description:
This is a basic Stochastic histogram that essentially shows when the indicator
is either above or below the 50 level. Colors can be customized to your liking.
Length and smoothing factor can be adjusted as well. Defaults are 14 (Length)
and 3 (Smoothing Factor).
NOTE: The above chart contains the built-in stochastic indicator for comparison.
Histogram

Patrick's Buy/Sell HistogramSimply look for a 12 point long bar and that's a perfect time to buy the security

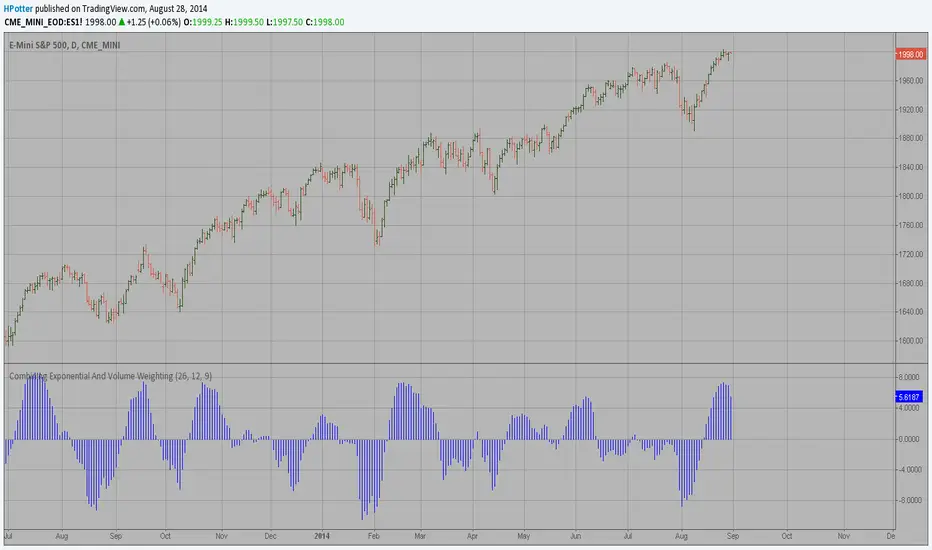
The Volume-Weighted MACD HistogramThe related article is copyrighted material from Stocks & Commodities 2009 Oct
Momentum HistogramThis creates a replica of relative distance from the moving averages, a good way to measure the strength, divergences etc.... short, mid and long term waves.
List of All my Indicators - www.tradingview.com
