[DisDev] Market Maker | Technical Time AnalysisThis indicator has three main components: Days of Week Separators , User-Customized Reminder Notes , and Projected Lines . Each component is explained and demonstrated how it could be used as a trading tool.
The basis of this indicator is to analyze past price movements and then project them as a reminder for traders that previously, at that particular time, there was a price increase/decrease.
1) Vertical lines and labels separate days of the week.
a. The vertical lines allow you to quickly see what day of the week the price movement occurred. For example, if a notable price move happens on Monday, you can use the “Reminder Notes” input to enter a note directly on the chart, as explained below.
b. You can select different colors and styles for the lines or background.
2) Vertical lines can be customized to be displayed in the past and future.
a. This allows you to select a specific time when price has increased/decreased, see how often this has occurred, then notate it as a reminder in the future.
3) User-customized reminder notes for future projected lines.
a. This allows you to input notes to be displayed with the future projected lines.
b. Example: You notice that at 06:45, there had previously been significant price action. Your notes can be updated directly on the chart to remind you of them just before 06:45 on the following days.
Below is the indicator in full use.
You can adjust each line's style, width, color, and reminder notes.
Historical

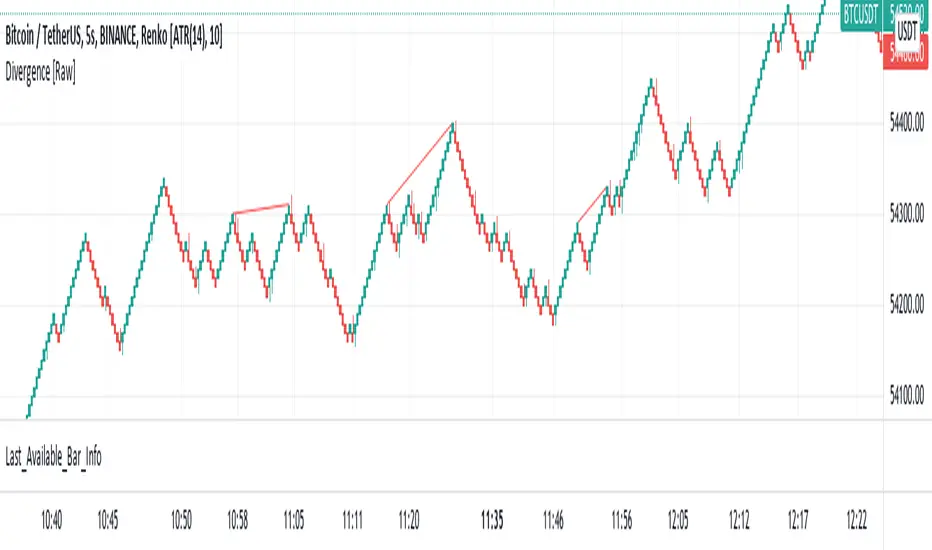
Last Available Bar InfoLibrary "Last_Available_Bar_Info"
getLastBarTimeStamp()
getAvailableBars()
This simple library is built with an aim of getting the last available bar information for the chart. This returns a constant value that doesn't change on bar change.
For backtesting with accurate results on non standard charts, it will be helpful. (Especially if you are using non standard charts like Renko Chart).
Methods
getLastBarTimeStamp()
: Returns Timestamp of the last available bar (Constant)
getAvailableBars()
:Returns Number of Available Bars on the chart (Constant)
Example
import paragjyoti2012/Last_Available_Bar_Info/v1 as LastBarInfo
last_bar_timestamp=LastBarInfo.getLastBarTimeStamp()
no_of_bars=LastBarInfo.getAvailableBars()
If you are using Renko Charts, for backtesting, it's necesary to filter out the historical bars that are not of this timeframe.
In Renko charts, once the available bars of the current timeframe (based on your Tradingview active plan) are exhausted,
previous bars are filled in with historical bars of higher timeframe. Which is detrimental for backtesting, and it leads to unrealistic results.
To get the actual number of bars available of that timeframe, you should use this security function to get the timestamp for the last (real) bar available.
tf=timeframe.period
real_available_bars = request.security(syminfo.ticker, tf , LastBarInfo.getAvailableBars() , lookahead = barmerge.lookahead_off)
last_available_bar_timestamp = request.security(syminfo.ticker, tf , LastBarInfo.getLastBarTimeStamp() , lookahead = barmerge.lookahead_off)
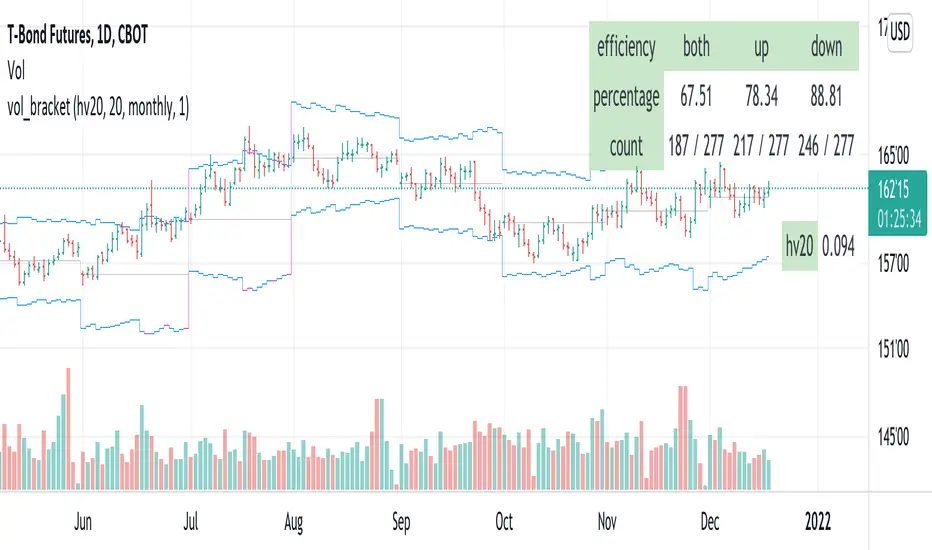
vol_bracketThis simple script shows an "N" standard deviation volatility bracket, anchored at the opening price of the current month, week, or quarter. This anchor is meant to coincide roughly with the expiration of options issued at the same interval. You can choose between a manually-entered IV or the hv30 volatility model.
Unlike my previous scripts, which all show the volatility bracket as a rolling figure, the anchor helps to visualize the volatility estimate in relation to price as it ranges over the (approximate) lifetime of a single, real contract.
vol_rangesThis script shows three measures of volatility:
historical (hv): realized volatility of the recent past
median (mv): a long run average of realized volatility
implied (iv): a user-defined volatility
Historical and median volatility are based on the EWMA, rather than standard deviation, method of calculating volatility. Since Tradingview's built in ema function uses a window, the "window" parameter determines how much historical data is used to calculate these volatility measures. E.g. 30 on a daily chart means the previous 30 days.
The plots above and below historical candles show past projections based on these measures. The "periods to expiration" dictates how far the projection extends. At 30 periods to expiration (default), the plot will indicate the one standard deviation range from 30 periods ago. This is calculated by multiplying the volatility measure by the square root of time. For example, if the historical volatility (hv) was 20% and the window is 30, then the plot is drawn over: close * 1.2 * sqrt(30/252).
At the most recent candle, this same calculation is simply drawn as a line projecting into the future.
This script is intended to be used with a particular options contract in mind. For example, if the option expires in 15 days and has an implied volatility of 25%, choose 15 for the window and 25 for the implied volatility options. The ranges drawn will reflect the two standard deviation range both in the future (lines) and at any point in the past (plots) for HV (blue), MV (red), and IV (grey).

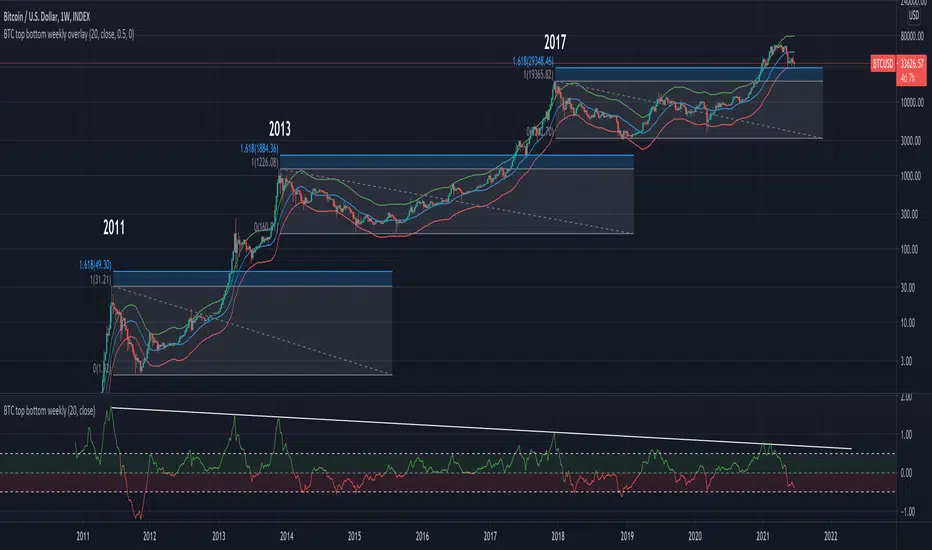
BTC top bottom weekly oscillatorThis indicator is based on the 20 weekly simple moving average and it could be used to help finding potential tops and bottoms on a weekly BTC chart.
This version uses an "oscillator" presentation, it fluctuates around the value zero.
The indicator plots 0 when the close price is near the 20 weekly moving average.
If it's below 0 it reflects the price being below the 20 weekly moving average, and opposite for above.
IT's possible to see how many times the price has hit the 0.5 coef support. In one case it hit 0.6 showing that the 0.5 support can be broken.
The indicator is calculated as Log(close / sma(close))
Instructions:
- Use with the symbol INDEX:BTCUSD so you can see the price since 2010
- Set the timeframe to weekly
Optionals:
- change the coef to 0.6 for a more conservative bottom
- change the coef to 0.4 for a more conservative top

BTC top bottom weekly bandsThis indicator is based on the 20 weekly simple moving average and it could be used to help finding potential tops and bottoms on a weekly BTC chart.
When using the provided "coef" parameter set to the default of 0.5 it shows how most bottoms since 2013 have hit the lower band of this indicator.
The lower band is calculated as exp(coef) * sma(close)
Instructions:
- Use with the symbol INDEX:BTCUSD so you can see the price since 2010
- Set the timeframe to weekly
- Use logarithmic chart (toggle "log" on)
Optionals:
- change the coef to 0.6 for a more conservative bottom
- change the coef to 0.4 for a more conservative top
The Amplifier - Two Day Historical Bitcoin Volatility PlotThe 3rd piece to the other two pieces to our CoT study. This is the Amplifier, which turns select signals into 'Super' Buys/Sells
The other two being the 'Bitcoin Insider CoT Delta', and the on chart Price indicator most will have, if no others the 'Hunt Bitcoin CoT Buy/Sell Signals' that will indicate the key signals, ave 4 a year on the chart as they occur.
Why Bother another CoT signal?
Its different & focused on the Insider's.
Performance -
This Indicator provided a
1. Signal 1 = 26th March 2019 = SUPER LONG at $4,500 that saw a near $14,000 run up
2. Signal 2 = 18th & 24th June 2019 = SHORT at the second & final level $11,700 after repeated attempts & failure in the $13K range, the mini Echo Bitcoin Bull of 2019
3. Signal 3 = 17th December 2019 = LONG $6,900, Bitcoin rallied to Mid $10,500's
4. Signal 4 = 18th Feb 2020 = SUPER SHORT from $9,700's to a final extreme Low of $3,000, calling the CV-19 collapse
5. Signal 5 = 17th March 2020 = LONG from $5,400 no closure point yet
6. Signal 6 = 29th June 2020 = SUPER LONG reiterate from $10,700 no closure sell signal yet
7. Signal 7 = 17th May 2020 = LONG another accumulate LONG with no sell signal yet generated at Post H&S's low of $33,000
Note - This indicator only commences March 2019, as Bitcoin futures were a recent introduction and needed to settle for 6 months in both use and data, no signals were meaningful prior & data was light.
What is Provided. - Please note the need to also add the Hunt Bitcoin Historical Volatility Indicator for full understanding.
We provide 3 things with the 3 indicators.
'Insider' indications from Largest players in the futures market.
1. Bitcoin Macro Buy Signals.
a) The Bitcoin Commitment of Traders results see us focus solely on Largest 4 Short Open Interest & Largest 4 Long Open Interest aspects of the CoT Release data.
When the difference - is tight, a kind of pinch, these have been great Buy signals in Bitcoin.
We call this difference the Delta & When Delta is 5% or less Bitcoin is a Buy.
2. Bitcoin Macro Sells.
a) A sell signal is Triggered in Bitcoin at any point the Largest 4 short OI > or = to 70
3. AMPLIFIER Trade signals 'Super' Longs or Shorts -
Extreme low volatility events leads to highly impulsive & volatile subsequent moves, if either of 1 or 2 above occur, combined with extreme low volatility
a 'Super Long' or 'SUPER SELL' is generated. In the case of the short side, given Bitcoins general expansive and MACRO Bull trend since inception, we seek an additional component
that is an extreme differential/Delta reading between 4 biggest Longs & Shorts OI.
Namely CoT Delta also must be > 47.5%
We also have a Cautionary level, where it is not necessarily a good idea to accumulate Bitcon, as a better opportunity lower may avail itself, see conditions below.
So the required logic explicitly stated below for all Signals.
1. Long - Hunt Bitcoin CoT Delta < or = 5
2. SUPER Long - Hunt Bitcoin CoT Delta < or = 5; and 2 Day Historical Bitcoin Volatility = or < 20
3. Short - Largest 4 Sellers OI = or > 70
4. SUPER Short - Largest 4 Sellers OI = or > 70; AND..
Hunt Bitcoin CoT Delta = or > 47.5 AND 2 Day Historical BTC Volatility = or < 20
5. Caution - Largest 4 Sellers OI = or > 67.5 AND Hunt Bitcoin CoT Delta = or > 45
WARNING SEE Notes Below
Note 1 - = Largest 4 Open Interest Shorts
Note 2 - = Largest 4 Open Interest Longs
Note 3 - = Hunt Cot Delta = (Largest 4 sellers OI) -( Largest 4 Buyers OI)
Caution = Avoid new Bitcoin Accumulation Right Now, A sell signal might follow Enter on next Long
Note 4 - The Hunt Bitcoin COT Delta signal is a Largest 'Insider' Tracking tool based on a segment of Commitment of Traders data on Bitcoin Futures, released once a week on a Friday.
It is a Macro Timeframe signal , and should not be used for Day trading and Short Timeframe analysis , Entries may be optimised after a Hunt Bitcoin CoT Signal is generated by separate shorter Timeframe analysis.
Note 5 - The Historical Bitcoin Volatility is an additional 'Amplifier' component to the 'Hunt Bitcoin Cot Delta' Insider Signal
Note 6 - The Historical Bitcoin Volatility criteria varies by timeframe, the above levels are those applying on a Two Day TF Chart, select this custom timeframe in Trading View.
if additional criteria are met for LONG & SHORT insider signals, they may become 'Super Longs/Shorts', see conditions box above.

Relative Historical Volatility MCMRelative Historical Volatility
Historical Volatility is relative to it's doubled lookback period of the historical volatility to calculate relative historical volatility.
Including a standard deviation to calculate the volatility value itself is useless. It filters out 32% of the most volatile movements of the asset that you are observing.
Example of RHV:
Period of Volatility Value (POVV) : 10
Relative Historical Volatility : POVV / POVV*2
Historical Volatility of past 10 Bars is compared to the historical volatility of the bast 20 bars to show real growth/decrease of volatility relative to the time of the performing asset.
Comparing historical volatility to the current bar includes much more noise, the relative historical volatility can be perceived as a smoothed historical volatility ind.
Marginal notes:
Added standard deviations adjusted to the relative volatility value to predict probable future volatility of the stock.

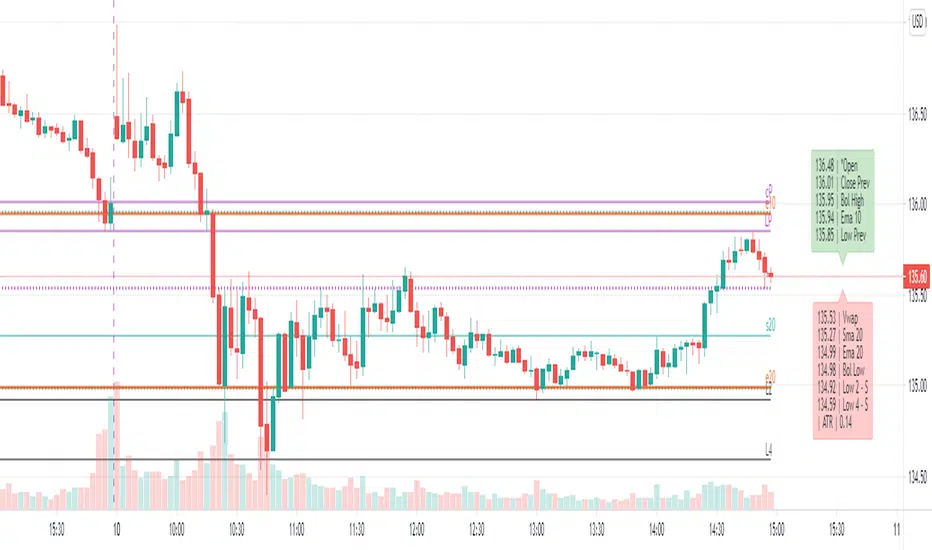
Dynamic levels from higher TF: EMA, SMA, OHLC, Bollinger, Vwap[ AR ] iLevels - indicator is intended for displaying important levels from a current and higher timeframe.
The indicator hides levels if they are far from the current price . The concealment range is based on the ATR * multiplier value. This keeps the graph clean and not shrinking .
Available levels:
- EMA - 5, 10, 20, 50, 100, 200, 300, 400, 500, 1000, 2000
- SMA - 20, 50, 100, 200
- Current day - Open/High/Low/Close
- Prev day - Open/High/Low/Close
- Prev days - Historical Open/High/Low/Close
- Vwap
- Local Bollinger - upper and lower channel boundaries from current timeframe
--- Detailed description ---
Why do you need an indicator?
The indicator is designed to display the most important levels from the current and upper time frames, which are support/resistance for the price. You do not need to constantly search for the level on the upper time frame and track it on the current one. For ease of understanding, here we will assume that the main time frame is one minute, and the upper one is daily, and we are trading intraday. Of course the indicator works on any time-frame. And the most convenient moment is that the indicator automatically hides and shows levels near the current price so that the chart does not shrink (does not increase along the vertical axis). An important point - the level is calculated for the current bar, i.e. 20 bars ago most likely it was not at this value (but you can see it through the market simulation). This means that the levels move with the price change and they are always horizontal for the current bar, and not historical in general.
Benefits
Automatic hiding of levels depending on ATR
Levels from the current time frame: Bollinger, Vwap
Levels from the upper time frame: Open/High/Low/Close of the current day and Open/High/Low/Close of the previous day
Levels from the upper time frame: popular EMAs, popular EMA fibonacci, popular SMA, previous historical High/Low, if the price did not touch them
Table (summary) with levels for quick orientation
When hovering over a table/level, a tooltip appears in%
Everything can customized. Levels, colors, styles, hints - you can customize everything and make a dream indicator.
Available levels
EMA and SMA
A whole set of popular EMAs from the higher time frame: 5, 10, 20, 50, 100, 200, 300, 400, 500, 1000, 2000. Fibonacci EMAs: 13, 34, 55, 89, 144, 233
In our basic example, we add the EMA from the daily chart to the minute chart:
SMA added only the most popular: 20, 50, 100, 200
Vwap and Bollinger Bands from the current time frame
Open/High/Low/Close of the current and previous day (bar)
Open/High/Low/Close of the current (example: Current Open) and the previous bar (example: Prev Open) are requested from the higher time frame. If we use the indicator on the data of the daily chart, then we get the open/close/min/max levels of the current and the previous day. These are the usual Pivot levels that can be used as support/resistance:
Historical Open/High/Low/Close
These are the Open/High/Low/Close values of 50+ previous bars from the upper time frame. Marked as o3 (the Open value of the 3rd bar back), H55 (the High value of the 55th bar back), etc. They serve as excellent support/resistance levels, you just need to look at the upper chart to determine the significance of this level
In our example with a one-minute chart and an upper daily time frame, we can, for example, see the exact values of the historical maximum resistance or some significant support at the close of the gap.
By default, only High and Low are enabled, as they are the most significant. The summary hint contains a letter after the level - R or S, respectively, this is resistance or support.
Another good example of historical levels. On the left chart there is a daily time frame, on the right is a minute with an indicator. The indicator accurately shows the nearest historical support Low 14, 19 and 54. On the left I have highlighted them for clarity:
Lines and labels
The line is the "level". The line is the ray. It starts from the last bar and goes to the left. Since this is a ray, looking at the historical data (rewinding the chart back), it will not rescale and collapse the chart.
Label is the abbreviated name of the level, for example V (Vwap), e50 (EMA 50), or H17 (High 17). The title has been abbreviated so as not to clutter up the graph. When you hover the mouse, a tooltip appears with the full name of the level, the price and the difference in % to this level from the current price.
Settings
The indicator is very flexible and you can customize it absolutely for any needs and tasks.
Higher time frame
This is the timeframe from where the indicator requests data for most levels.
You can use different variations: minute/day, day/week, etc.
Atr Multiplier
This is the setting that allows you to decrease/increase the number of displayed levels.
It's simple - a “space” is created near the price above and below. If the level falls into this “space”, then it is displayed.
The space above is calculated as:
Price + (ATR * AtrMultiplier) and below as: Price - (ATR * AtrMultiplier)
While on the minute chart, it is optimal to use the value up to 10, on the hourly chart - up to 2-3, on the daily chart - 0.5, etc.
Line Right Shift, Label Right Shift
How many bars the levels and labels above them move from the last bar. If Line Right Shift is set to negative, the line will start at this point and go to the right side of the chart.
Show Lines ?, Show Labels?
Need to show lines or labels above them? You can turn off one option and use only the other - lines without labels or vice versa.
Show Summary table?
Summary table is a table of data that conveniently displays the full name of the levels and the price. Hover displays a tooltip with levels as a percentage.
To maximize the acceleration of the trader, the following has been done:
Levels sorted by price
The table is split in two. Green table above - levels are more expensive than the current price (possible resistance). Red table below - levels are cheaper than the current price (possible support)
Distance between tables = ATR. We quickly and easily understand the value of ATR by looking at this distance. You can compare it with the nearest bars, which will give good information.
Show ATR in Summary?
In the lower table showing the value of the current ATR. Convenient, no additional indicator needed.
Always show in Summary
A list of levels that must always be displayed on the table, even if they are far away and have not appeared. The short names of the levels are specified, separated by commas. My basic set is Open, Vwap, EMA 10, EMA 20, Bollinger High, Bollinger Low.
Always show Levels
What levels should be displayed, even if they are far away. Bollinger channels are my choice. You can add Vwap, but in some cases it will compress the graph a lot, so Vwap is only in Summary by default.
Hide labels
In order not to clutter up the graph, you can remove some of the labels. For example, Bollinger Bands have their own style and are perceived visually - a mark above the level is not needed. You can add Vwap.
Replace labels on *
Which labels need to be replaced with an asterisk so as not to clog the graph. For example, this is Vwap, which has its own style. You can hover over the star and get a tooltip for the price.
Replace ALL labels on *
You can massively replace all tags with asterisks and get information when you hover over them.
Show Prevs Open/High/Low/Close?
4 settings that allow you to show historical levels. The labels are o12, H4, L72, c8. By default, only High and Low are enabled due to their significance.
Max Prev Days - how many bars back to get historical levels. Limited by TradingView's abilities and you can get about 50-100 bars back.
Current/Prev Open/High/Low/Close?
8 settings for displaying 8 levels of the current and previous day, which are important boundaries for the price. Current Close is disabled by default, as this is the current price level and is highlighted in TradingView.
Vwap?, Local Bollinger?, Sma ?, Ema?
Vwap level, Bollinger channels and a complete list of available Ema/Sma.
The most popular ones are enabled by default.
Color/Style/Width
Visual settings for lines. All lines are divided into 7 groups. Styles are customizable for the group as a whole.
Life hacks
You can add the indicator multiple times to the chart and set each copy to different time frames. For example, you have a minute chart. You add the indicator 3 times and set each indicator to daily, hourly and 15 minute time frames. Next, you set up the styles and colors for the lines on each indicator so that you can easily distinguish them from each other. Thus, you will not miss a single important level when trading intraday.
Known Issues
The main problem is overlapping of labels and levels. Overlapping labels is difficult to solve, but work is underway.
A side issue is the visual styles of levels and labels. The main goal is to create well-visually perceptible lines so that they can be instantly identified without reading the mark. We need to create a good color scheme for the level groups.
How can the community help and improve the indicator?
Suggest ideas.
Please, write them in the comments. Suggest edits to existing functionality. Suggest solutions to problems, new features, etc.
I believe that the community's suggestions for improvement can bring the indicator to perfection.
Thanks you!
HV/IV Options Indicator - Muthu SThis HV/IV indicator helps you to select an opt Option Strategy. It creates 5 areas & each area defines the present status of the option premium, which varies from Very Low to Very High. From the bottom, (Option Premium is)
Area 1. Very Low
Area 2. Low
Area 3. Fair
Area 4. High
Area 5. Very High
Find which area, current Implied Volatility (User Input) belongs in & choose the option strategy accordingly. Implied Volatility is marked in Black colour circles.
Kindly note, Prior knowledge of Options, Volatility (Historical & Implied) is mandatory to use this indicator. This is shared for education purpose only.

Realized Variables for Options ComparisonThese variables can be used in comparison with the implied volatility of options.
Variables:
Realized Volatility
mathematical notation lowercase 'sigma'
Realized Variance
mathematical notation lowercase 'sigma' squared
Realized Beta
mathematical notation lowercase 'beta'
Timeframes:
Yearly = 250 or 365
Quarterly = 50 or 90
Monthly = 20 or 30
Important Note:
Options Contract Expiry = barmerge.lookahead_on
"Merge strategy for the requested data position. Requested barset is merged with current barset in the order of sorting bars by their opening time. This merge strategy can lead to undesirable effect of getting data from "future" on calculation on history. This is unacceptable in backtesting strategies, but can be useful in indicators."
[ All other timeframes barmerge.lookahead is disabled.

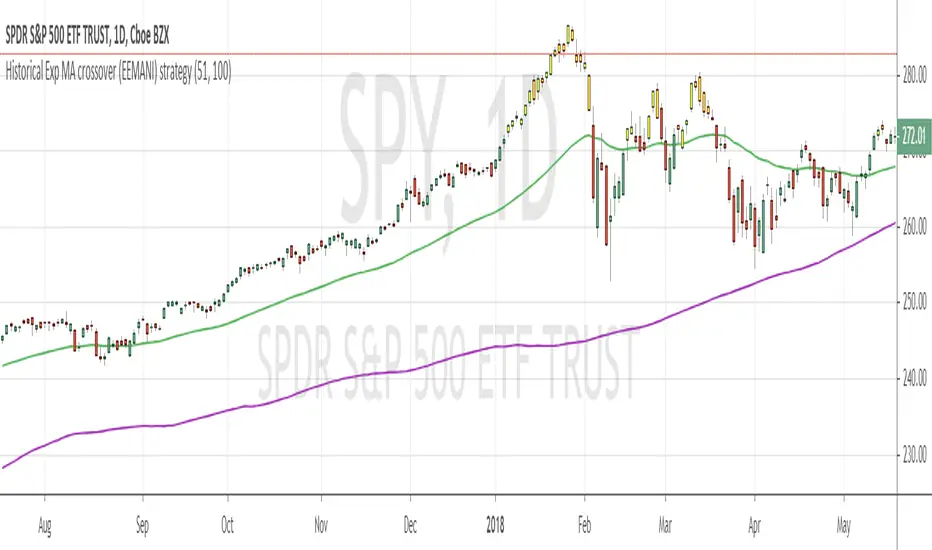
Historical Exp MA crossover (EEMANI) strategyThis strategy is based on exponential moving average.
I was doing some research on when price extended too far from moving averages / exponential moving averages , ended up with this idea.
LONG RULE
when Exponential MA cross over the historical Exponential MA
EXIT RULE
when Exponential MA cross down the historical Exponential MA
Take Profit
if you check take profit parameter , strategy marks the bars in yellow color when it reaches 30% profit
Example:
I have tested this strategy with SPY , which showed best results with Exp MA = 51 and Historical Exp MA = 100
which has 71% win ratio and High profit factor low max draw down . especially Max Loss on any taken trade is less than 5%
Though price movement looks ugly on the chart , ultimately trade closes with decent profit / minimal loss
Note : past performance is not necessarily indicative of future results, please do your research and back test
HV/IV Options IndicatorThe Options HV/IV indicator helps in comparing the Scripts Historic Volatility with Implied Volatility (provided by user). The Indicator creates 5 zones, starting from the bottom
Zone 1 - Very Cheap
Zone 2 - Cheap
Zone 3 - Fair
Zone 4 - Expensive
Zone 5 - Very Expensive
The location of the Implied Volatility (Blue line) in the corresponding zone helps in understanding the options pricing as very cheap, cheap, fair, expensive or very expensive. This analysis helps in choosing the correct option strategy when planning options trades.
Use the link below to obtain access to this indicator.

Historical Volatility Percentile + SMAHistorical Volatility Percentile tells you the percentage of the days from the past year (252 trading days) that have lower volatility than the current volatility.
I included a simple moving average as a signal line to show you how volatile the stock is at the moment.
I have included simple colors to let you know when to enter or exit a position.
Buy when price higher than EMA & historical volatility higher than SMA
Sell when price lower than EMA & historical volatility higher than SMA
Please let me know if you would like me to publish any other indicators! I always love to hear from you guys.

Alpha-Decreasing Exponential Moving AverageThe alpha parameter of this moving average decreases with every new bar on the chart, so it will become more slowly and slowly in course of time. Can act like additional support/resistance line but works in an acceptable way on weekly and monthly timeframes only.

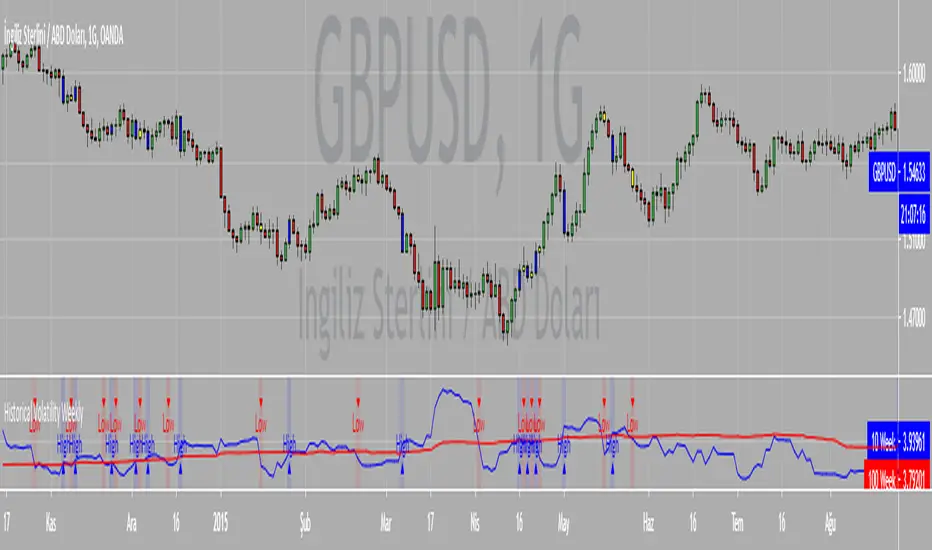

Wyckoff Historical VolatilityHi all this is a Historical volatility script that someone on youtube posted, his channel is Trade With Trend he is a very good trader, this script is mainly designed to work with the wyckoff method, im unsure if it works for any other trading style, this was designed mainly for swing trading if you do work with wyckoff method you should try it and check his video on his channel called: How To Use Wyckoff Trading Method For Price Action Trading - Swing Trading Strategies 🔥🔥
---i only compiled this--- for people that had no clue how to find it or how to do it just like i had a few hours ago i don't think anyone will use this but if you are searching for it feel free to use it.

Security() Correction - Realtime vs. Historical BarsProblem
Pine's implementation of the security() function behaves differently in realtime vs. historical bars. Specifically, for historical bars, calling security() for a time frame (TF) larger/slower than the current chart's TF will return information about the last completed bar of the higher TF. However, for realtime bars (i.e. if you allow the chart to continue to plot in realtime), security() returns information about the presently in-progress bar of the higher TF. Clearly, this leads to discontinuity that is arbitrarily dependent upon when the user last loaded or refreshed the chart.
Solution
Fortunately, after understanding the problem, solving it is trivial: use security() normally for historical bars, but switch to explicitly requesting prior candle bars once the indicator is operating on realtime bars. I leave the source open here for any to use as they see fit. For testing, I include an input to allow switching back and forth between standard and corrected behavior.
Figure 1 displays the standard behavior we see in security() calls, and Figure 2 displays the behavior after my correction:
Figure 1: Typical security() behavior in Pine
Figure 2: Corrected security() behavior, forcing historical and realtime bars to refer to the same higher TF bar offset.
I publish this mostly as a reminder to myself, so I will not forget and then have to figure it out again next time it comes up in my scripting.
V21: Initial release.

Return to the Mean OscillatorThe Return to the Mean Oscillator shows the spread between the selected mean study and the actual close in price.
In this first version, I'm including the All-Time Historical Mean, which is the evolution of the mean value of that asset since its inception.
By using this indicator we are able to see if a particular market is trading above/below historical mean value.
The Mean value equals zero in the oscillator scale.
Therefore, we can use this indicator to clearly identify 'Return to the Mean' moves.
Note: Tradingview limits the number of candles we can use on each time frame.
Depending on the deepness of historical data, it is possible that the mean value could miss old data and therefore plot different levels for each timeframe.
That is especially true for markets with a long history or when we calculate it for intraday time frames.
In case of doubt, refer to the mean value at higher time frames.

Return to the MeanThe Return to the Mean plots reference values that price action tends to revisit each cycle.
In this first version, I'm including the All-Time Historical Mean, which is the evolution of the mean value of that asset since its inception.
By using this indicator we are able to see if a particular market is trading above/below historical mean value.
Moreover, we can use this indicator to anticipate powerful 'Return to the Mean' moves.
In addition to the All-Time Historical Mean, I'm planning to add alternative 'return to the mean' studies to this indicator.
Note: Tradingview limits the number of candles we can use on each time frame.
Depending on the deepness of historical data, it is possible that the mean value could miss old data and therefore plot different levels for each timeframe.
That is especially true for markets with long history or when we calculate it for intraday time frames.
In case of doubt, refer to the mean value at higher time frames.

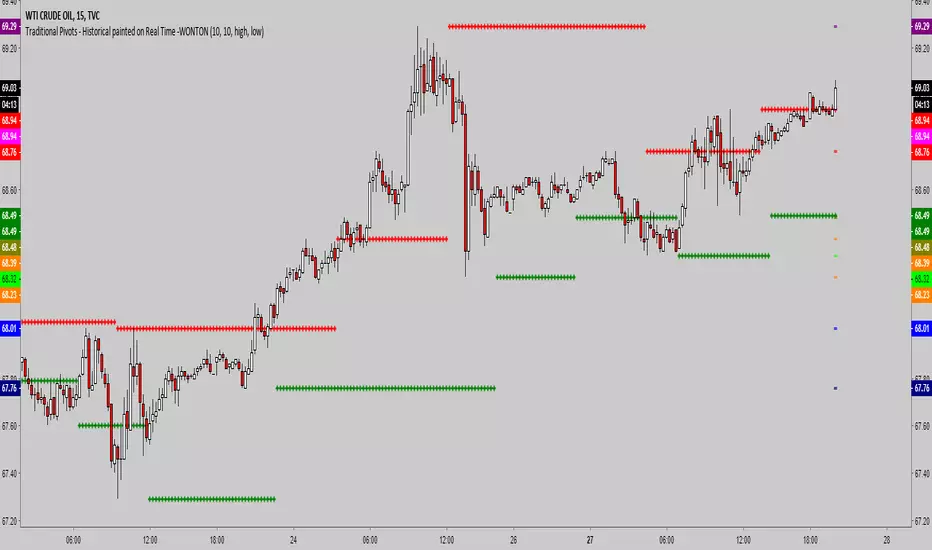
Traditional Pivots - Historical painted on Real Time -WONTONSimple script which allows you:
- to set left bars, right bars to determine high and low pivots (default is 10)
- set the source, default is High for High Pivot and Low for Low Pivot, but it can be modified
- see the last 5 high and low pivots organized and sorted by price
- pivots are standard
A few notes
- TV is quirky on loop time outs, you may have to hide and show the indicator multiple times to eliminate an error if you encounter it
- The historic pivots are sorted by price and will only display as long as you have the chart open, it will begin displaying on the first real time bar
- Leave the chart open for a while and the historic pivot lines will build
- The actual pivots are also shown for reference in history
Heikin Ashi Historical TF Developmental BarsAn improvement to the built-in security(heikinashi()...) method, this indicator plots Heikin Ashi (HA) candles for an input timeframe (TF) on an underlying regular candlestick chart of a shorter TF. The improvement is that it plots the value of each in-development HA bar as it would have appeared while still repainting, for each underlying chart bar. The last chart bar of each TF matches the value available from security() calls and from HA charts directly.
For best results, be sure to use a HA TF greater than chart TF (I prefer 1 minute unless longer history is required).
1 hour HA on 1 minute underlying price chart
4 hour HA on 1 minute underlying price chart
V3: Release.
