Ichimoku Horizon MTFIchimoku Horizon MTF — Multi-TimeFrame Ichimoku with auto-map
Overview
Ichimoku Horizon MTF plots classic Ichimoku on your current chart timeframe and projects up to three higher timeframes (TF1 / TF2 / TF3) onto the same chart. The goal is to keep one clean chart while still seeing higher-timeframe Ichimoku context (for example Daily / Weekly / Monthly).
On the screen, you typically see:
– the full Ichimoku set for your chart timeframe (Tenkan, Kijun, Kumo, Chikou),
– the same structure projected from TF1–TF3, each with its own colour family,
– an optional Kumo Midline (extra line, not part of original Ichimoku, used as a visual helper),
– and an optional TF banner showing which higher timeframes are currently mapped.
And optionally: A Kumo Midline (midpoint between SSA and SSB)
Kumo Midline (non-original Ichimoku addition)
The Kumo Midline is a personal addition.
It is not part of the original Ichimoku.
It is provided for informational and visual purposes only, as a helper to read the centre of the cloud.
It is calculated as the simple average of the two cloud boundaries:
Midline= SSA + SSB / 2
You can turn it ON/OFF globally, and also separately for each timeframe (Chart / TF1 / TF2 / TF3). The same logic (including the optional Midline) is applied to TF1 / TF2 / TF3 and projected onto your main chart.
Auto-map & timeframe presets
You control how TF1 / TF2 / TF3 are selected using two mechanisms:
Auto-map TF from chart (ON/OFF)
When ON, the script automatically chooses a profile based on your chart timeframe
(Scalp / Intraday / Swing / Long Term / Investment / Macro).
TF1 / TF2 / TF3 are always higher than the chart timeframe, with a consistent progression.
Preset Time Frame (when Auto-map = OFF)
When OFF, you choose a fixed preset, for example:
Scalp S — 1m / 5m / 15m
Intraday L — 1H / 4H / 1D
Swing — 1D / 1W / 1M
Investment — 1M / 3M / 6M
Macro — 3M / 6M / 12M
If you choose Custom, you manually set TF1 / TF2 / TF3 using the three “Timeframe selection” inputs in the TF1 / TF2 / TF3 sections.
This allows you to switch quickly between scalp / intraday / swing / macro profiles without editing any code.
TF banner (legend) & display options
The indicator includes an optional TF banner (a small panel) that acts as a timeframe legend:
Shows the active profile name (Scalp, Intraday M, Intraday XL, Swing, Long Term, Macro, Custom). Displays the three mapped timeframes (TF1 / TF2 / TF3) in short form (5m, 1H, 4H, 1D, 1W, 1M, etc.). Shows “TK / KJ” with small coloured squares for Tenkan and Kijun for each TF, matching the line colours on the chart.
You can control:
Show / hide the banner.
Position: Top / Bottom, Left / Center / Right.
Text colour, background, text size.
Each block (Chart, TF1, TF2, TF3) also has its own toggles for:
Tenkan
Kijun
Chikō
SSA
SSB
Kumo fill
Kumo Midline
This lets you keep only what you really need (for example: just HTF Kijun + HTF Kumo).
Colour design
Special care has been taken with the colour design:
Each timeframe uses its own colour family
(for example: warm colours for the chart timeframe, green for TF1, blue for TF2, neutral/grey for TF3), so the chart stays readable even when all TFs are displayed at once.Kumo fills are semi-transparent to provide context without hiding price action. Defaults are tuned for light charts, and every colour can be customised if you prefer another palette.
Built-in alerts
The script includes a small set of ready-to-use alerts, controlled by:
A global “Enable alerts” switch
A built-in cooldown to avoid alert spam
Available conditions (on the chart timeframe):
TK > KJ (UP) – Tenkan crosses above Kijun (filtered by a bullish HTF bias).
TK < KJ (DOWN) – Tenkan crosses below Kijun (filtered by a bearish HTF bias).
Kumo Breakout (UP) – Close breaks above the cloud (with bullish HTF filter).
Kumo Breakout (DOWN) – Close breaks below the cloud (with bearish HTF filter).
All TF Bullish – Chart + TF1 + TF2 + TF3 all have Tenkan > Kijun (full bullish alignment).
All TF Bearish – Chart + TF1 + TF2 + TF3 all have Tenkan < Kijun (full bearish alignment).
HTF Confirms (BULL) – Bullish TK cross on the chart timeframe, with HTF support and price above the cloud.
HTF Confirms (BEAR) – Bearish TK cross on the chart timeframe, with HTF confirmation and price below the cloud.
To use them:
Add an alert on the indicator,
Choose one of these conditions,
Use “Once per bar close” for cleaner signals.
No-repaint logic
Higher-timeframe data is fetched using request.security() with:
barmerge.gaps_off
barmerge.lookahead_off
This means:
No artificial lookahead,
No repainting,
Apart from the normal forward shift of the Ichimoku cloud, which is how standard Ichimoku works by design.
If the chart get “stuck on the left”
stuck on the left side, or misaligned. If you see the TF banner or right-side labels not updating correctly: Clear the TradingView app cache (or restart the app / browser)
Reload the chart. This usually forces TradingView to redraw all tables and labels correctly and fixes the display issue.
Disclaimer
This script is provided for educational and informational purposes only.
It does not constitute financial or investment advice and should not be used as a standalone signal provider.
Always do your own analysis and use proper risk management before taking any trade.
Thanks for using Ichimoku Horizon MTF.
Ichimokuchart

Dynamic Support|Resistance SSA & SSBHello, traders. I offer you an indicator to complement the Ichimoku Kinho Hyo trading system. This indicator determines possible dynamic resistance and support levels based on pivots and end points of the Senkou Span A and Senkou Span B lines.
You determine the pivots yourself, choosing how many bars back to look for HIGH and LOW.
Attention! Unlike the classical theory of Goichi Hosoda: the levels are dynamic, that is, they change values with each new bar!
Also added is the MTF function for displaying levels from different time frames.
Goichi Hosoda TheoryGreetings to traders. I offer you an indicator for trading according to the Ichimoku Kinho Hyo trading system. This indicator determines possible time cycles of price reversal and expected asset price values based on the theory of waves and time cycles by Goichi Hosoda.
The indicator contains classic price levels N, V, E and NT, and is supplemented with intermediate levels V+E, V+N, N+NT and x2, x3, x4 for levels V and E, which are used in cases where the wave does not contain corrections and there is no possibility to update the impulse-corrective wave.
A function for counting bars from points A B and C has also been added.

Ichimoku Score Indicator [tanayroy]The Ichimoku Cloud is a comprehensive indicator that provides a clear view of market states through five key components. By analyzing the interaction between these components and the asset's price, traders can gain insights into trend direction, momentum, and potential reversals.
Introducing the Ichimoku Score System
I have developed a scoring system that quantifies these interactions, offering an objective method to evaluate market conditions. The score is calculated based on the relative positioning of Ichimoku components, with adjustable weightings via user input.
Scoring Criteria
Each component contributes to the overall score as follows:
Price vs. Cloud (Kumo) & Other Components
Price vs. Kumo → 2 Points
Price vs. Kumo Shadow → 0.5 Points
Tenkan vs. Kijun
Tenkan vs. Kijun → 2 Points
Tenkan vs. Kumo → 0.5 Points
Kijun vs. Kumo → 0.5 Points
Tenkan Slope → 0.5 Points
Kijun Slope → 0.5 Points
Chikou Span Interactions
Price vs. Chikou → 2 Points
Chikou vs. Kumo → 0.5 Points
Chikou Consolidation → 0.5 Points
Senkou Span Analysis
Senkou A vs. Senkou B → 2 Points
Senkou Slope → 0.5 Points
Price vs. Key Levels
Price vs. Tenkan → 2 Points
Price vs. Kijun → 2 Points
Interpreting the Score
The aggregate score functions as an oscillator, fluctuating between a range of ±16.0.
A higher score indicates strong bullish momentum.
A lower score suggests bearish market conditions.
To enhance readability and smooth fluctuations, a 9-period SMA is applied to the score.
Application in Algorithmic Trading
This scoring system helps integrate Ichimoku Cloud principles into algorithmic trading strategies by providing a structured and quantifiable method for assessing market conditions.
Would love to hear your feedback! 🚀 Let me know how this system works for you.

Divergence-Weighted clouds V 1.0Comprehensive Introduction to Divergence-Weighted Clouds V 1.0 (DW)
In financial markets, the analysis of volume and price plays a fundamental role in identifying trends, reversals, and making trading decisions. Volume indicates the level of market interest and liquidity focused on an asset, while price reflects changes in supply and demand. Alongside these two elements, market volatility, support and resistance levels, and cash flow are also critical factors that help analysts form a comprehensive view of the market. The Divergence-Weighted Clouds V 1.0 (DW) indicator is designed to simultaneously analyze these fundamental elements and other important market dynamics. To achieve this, it utilizes data generated from 13 distinct indicators, each measuring specific aspects of the market:
Trend and Momentum: Analyzing the direction and strength of price movements.
Volume and Cash Flow: Understanding the inflow and outflow of capital in the market.
Oscillators: Identifying overbought and oversold conditions.
Support and Resistance Levels: Highlighting key price levels.
The Core Challenge: Standardizing Diverse Data
The primary challenge lies in the fact that the outputs of these indicators differ significantly in scale and meaning. For example:
Volume often generates very large values (e.g., millions of shares).
Oscillators provide data within fixed ranges (e.g., 0 to 100).
Price-based metrics may vary in entirely different scales (e.g., tens or hundreds of units).
These differences make direct comparison of the data impractical. The DW indicator resolves this challenge through an advanced mathematical methodology:
Normalization and Hierarchical Evaluation:
To standardize the data, a process called hierarchical EMA evaluation is employed. Initially, the raw outputs of each indicator are computed over different timeframes using Exponential Moving Averages (EMA) based on prime-number intervals.
Hierarchical Scoring:
A pyramid-like structure is used to evaluate the performance of each indicator. This method examines the relationships and distances between EMAs for each indicator and assigns a numerical score.
Final Integration and Aggregation:
The scores of all 13 indicators are then mathematically aggregated into a single number. This final value represents the overall market performance at that moment, enabling a unified interpretation of volume, price, and volatility.
-------------------------------------------------------------------------------------------------
Indicators Used in DW
To achieve this comprehensive analysis, DW leverages 13 carefully selected indicators, each offering unique insights into market dynamics:
Trend and Momentum
- ALMA (Arnaud Legoux Moving Average): Reduces lag for faster trend identification.
- Aroon Up: Analyzes the stability of uptrends.
- ADX (Average Directional Index): Measures the strength of a trend.
Volume and Cash Flow
- CMF (Chaikin Money Flow): Identifies cash flow based on price and volume.
- EFI (Elder’s Force Index): Evaluates the strength of price changes alongside volume.
- Volume Delta: Tracks the balance between buying and selling pressure.
- Raw Volume: Analyzes unprocessed volume data.
Oscillators
- Fisher Transform: Normalizes data to detect price reversals.
- MFI (Money Flow Index): Identifies overbought and oversold levels.
Support, Resistance, and Price Dynamics
- Ichimoku Lines (Tenkan-sen & Kijun-sen): Analyzes support and resistance levels.
- McGinley Dynamic: Minimizes errors caused by rapid price movements.
- Price Hierarchy: Evaluates the relative position of prices across timeframes.
-------------------------------------------------------------------------------------------------
Example: Hierarchical Scoring for Price Analysis
To illustrate how the DW indicator processes data, let’s take the price as an example and analyze it using the first four prime numbers (2, 3, 5, and 7) as intervals for Exponential Moving Averages (EMAs). This example will demonstrate how the indicator evaluates price relationships and assigns a hierarchical score.
Step-by-Step Calculation:
1. Raw Data:
Let’s assume the closing prices for a specific asset over recent days are as follows:
Day 1: 100
Day 2: 102
Day 3: 101
Day 4: 104
Day 5: 103
Day 6: 105
Day 7: 106
2. Calculate EMAs for Prime Number Intervals:
Using the prime-number intervals (2, 3, 5, 7), we calculate the EMAs for these timeframes:
EMA(2): Averages the last 2 closing prices equal to 105.33
EMA(3): Averages the last 3 closing prices equal to 104.25
EMA(5): Averages the last 5 closing prices equal to 103.17
EMA(7): Averages the last 7 closing prices equal to 102.67
3. Compare EMAs Hierarchically:
To assign a score, the relationships between the EMAs are analyzed hierarchically. We evaluate whether each smaller EMA is greater or less than the larger ones:
Compare EMA(2) to EMA(3), EMA(5), and EMA(7):
EMA(2) > EMA(3):105.33>104.25 => +1
EMA(2) > EMA(5): 105.33>103.17 => +1
EMA(2) > EMA(7): 105.33 > 102.67 => +1
Compare EMA(3) to EMA(5) and EMA(7):
EMA(3) > EMA(5) : 104.25>103.17 => +1
EMA(3) > EMA(7):104.25 >102.67 => +1
Compare EMA(5) to EMA(7):
EMA(5) > EMA(7):103.17>102.67 => +1
Assign a Score:
Each positive comparison adds +1 to the score. In this example:
Total Score for Price = 1+1+1+1+1+1+1=6
-------------------------------------------------------------------------------------------------
Logic Behind Scoring:
The score reflects the "steepness" or "hierarchy" of price movement across different timeframes:
A higher score indicates that shorter EMAs are consistently above longer ones, signaling a strong upward trend.
A lower score or negative values would indicate the opposite (e.g., short-term prices lagging behind long-term averages, signaling weakness or potential reversal).
This method ensures that even complex data points (like price, volume, or oscillators) can be distilled into a single, comparable numerical value. When repeated across all 13 indicators, it enables the DW indicator to create a unified, normalized score that represents the overall market condition.
-------------------------------------------------------------------------------------------------
Settings and Customization in Divergence-Weighted Clouds V 1.0 (DW)
The Divergence-Weighted Clouds V 1.0 (DW) indicator provides extensive customization options to empower traders to fine-tune the analysis according to their specific needs and trading strategies. Each of the 13 indicators is fully customizable through the settings menu, allowing adjustments to parameters such as lookback periods, sensitivity, and calculation methods. This flexibility ensures that DW can adapt seamlessly to a wide range of market conditions and asset classes.
Key Features of the Settings Menu
1. Global Settings:
Lookback Periods: Define the timeframe for data aggregation and analysis across all indicators.
Normalization Settings: Adjust parameters to refine the process of scaling diverse outputs to a comparable range.
Divergence Sensitivity: Control the weight given to indicators deviating from the average, enabling a focus on outliers or broader trends.
2. Indicator-Specific Settings:
Each of the 13 indicators has its own dedicated section in the settings menu for precise customization. Examples include:
ALMA (Arnaud Legoux Moving Average):
Window Size: Set the number of bars used for calculating the average.
Offset: Control the sensitivity of trend detection.
Sigma: Adjust the smoothing factor for the calculation.
Aroon Up:
Length: Modify the lookback period for identifying highs and evaluating uptrends.
ADX (Average Directional Index):
DI Length: Specify the period for calculating directional indicators (DI).
ADX Smoothing: Adjust the smoothing period for trend strength analysis.
3. Oscillator Settings:
Fisher Transform:
Length: Customize the period for normalization and detecting reversals.
Money Flow Index (MFI):
Length: Set the timeframe for analyzing overbought and oversold conditions.
4. Volume and Cash Flow Settings:
Chaikin Money Flow (CMF):
Length: Define the period for analyzing cash flow based on price and volume.
Volume Delta:
Timeframe: Select a custom timeframe for analyzing buying and selling pressure.
5. Support and Resistance Settings:
In the Support and Resistance category of the DW indicator, we address the logic behind four components:
McGinley Dynamic
Price Hierarchy
Base Line
Conversion Line
The settings structure for this section primarily focuses on McGinley Dynamic, while the other three elements—Price Hierarchy, Base Line, and Conversion Line—operate based on predefined values derived from the mathematical structure and logic of the DW indicator. Let’s explore this in detail:
McGinley Dynamic
Length: The only customizable setting in this category. Users can adjust the length parameter to tailor the responsiveness of the McGinley Dynamic to different market conditions. McGinley Dynamic adapts dynamically to the speed of price changes, reducing lag and minimizing false signals. Its flexibility allows it to serve as both a trendline and a support/resistance guide.
Price Hierarchy
The Price Hierarchy component in DW leverages a pyramid structure and triangular scoring based on prime-number intervals (e.g., 2, 3, 5, 7). This methodology ensures a mathematically robust framework for evaluating the relative position of prices across multiple timeframes.
Why No Settings for Price Hierarchy?
The unique properties of prime numbers make them ideal for constructing this hierarchical scoring system. Changing these intervals would compromise the integrity of the calculations, as they are specifically designed to ensure precision and consistency. Therefore, no customization is allowed for this component in the settings menu.
Conversion Line and Base Line
The Conversion Line (Tenkan-sen) and Base Line (Kijun-sen) are integral components derived from DW’s scoring methodology and represent short-term and medium-term equilibrium levels, respectively. These lines are calculated using the Ichimoku framework, which provides a reliable and well-recognized mathematical basis:
Conversion Line: The average of the highest high and lowest low over a fixed period of 9 bars.
Base Line: The average of the highest high and lowest low over a fixed period of 26 bars./list]
Both lines are utilized in DW as part of the 13 generated indicator variables to assess market equilibrium.
Why Default Values for Conversion and Base Lines?
These values are fixed to the default Ichimoku parameters to:
- Ensure consistency with the broader Ichimoku logic for users familiar with its methodology.
- Prevent confusion in the settings menu, as customization of these parameters is unnecessary for DW’s scoring system.
Important Note: While these lines are derived using Ichimoku logic, they are not standalone Ichimoku components but are embedded into DW’s mathematical structure. In the next section, we will elaborate on how the Ichimoku framework is employed for the graphical visualization of DW’s calculations.
Displaying the Results of 13 Indicator Integration in DW Indicator
The Divergence-Weighted Clouds V 1.0 (DW) employs a rigorous methodology to integrate 13 distinct indicators into a single, normalized output. Here's how the process works, followed by an explanation of the visualization strategy leveraging Ichimoku logic.
Simultaneous Evaluation of 13 Indicators
1. Mathematical Integration Logic:
Normalization: The outputs of all 13 indicators (e.g., ALMA, ADX, CMF) are normalized into comparable ranges, ensuring compatibility despite their diverse scales.
Hierarchical Scoring with Prime Intervals: For each indicator, Exponential Moving Averages (EMAs) are calculated using prime-number intervals (e.g., 2, 3, 5, 7). These EMAs are evaluated through a triangular scoring system, creating individual scores for each indicator.
Divergence Weighting: Indicators showing significant divergence from group averages are given higher weights, amplifying their influence on the final score.
2. Unified Score Calculation:
The normalized and weighted outputs of all 13 indicators are aggregated into a single score.
This score represents the overall behavior of the market, based on the simultaneous evaluation of trend, volume, oscillators, and price metrics.
------------------------------------------------------------------------------------------
Challenge of Visualizing Results
The next challenge lies in effectively visualizing the score to make it actionable for traders. The DW indicator resolves this challenge by leveraging the Ichimoku framework.
Why Ichimoku for Visualization?
The Ichimoku system is known for its clear and predictive visualization capabilities, making it ideal for representing DW’s complex calculations:
1. Cloud-Based Display: Ichimoku Clouds (Kumo) are intuitive for identifying equilibrium zones and future price movements.
2. Projection Ability: The forward-projected Leading Spans (Senkou A and B) provide predictive insights based on past and current data.
3. Trader Familiarity: Ichimoku is widely recognized, reducing the learning curve for users.
Implementation of Ichimoku Logic
1. Mapping Score to Price:
The score is normalized and mapped to price using a scale factor, ensuring alignment with price data while preserving DW’s analytical integrity.
2. Ichimoku Cloud Lines:
Conversion Line (Tenkan-sen): Short-term equilibrium based on the score, calculated using a 9-period high-low average.
Base Line (Kijun-sen): Medium-term equilibrium calculated using a 26-period high-low average.
Leading Spans (Senkou A & B):
- Senkou A: Average of the Conversion and Base Lines.
- Senkou B: High-low average over a 52-period window.
Lagging Span (Chikou): Unlike traditional Ichimoku, DW’s Lagging Span reflects the Nebula Score shifted backward, providing a historical perspective on combined indicator behavior
3. Cloud Dynamics:
The Kumo Cloud is filled based on the relative position of Senkou A and Senkou B, using color shading to distinguish bullish and bearish conditions.
------------------------------------------------------------------------------------------
Customization in Computational Settings
The core computational components of DW allow some customization for sensitivity adjustments:
Divergence Sensitivity: Controls the weight assigned to indicators with higher divergence.
Volatility Normalization: Adjusts the lookback period for volatility adjustments, refining the Nebula Score scaling.
------------------------------------------------------------------------------------------
Advantages of Using Ichimoku Logic
1. Predictive Visualization:
The forward-projected cloud provides actionable insights for identifying trends and reversals earlier than traditional Ichimoku.
2. Aligned Lagging Span:
DW’s Lagging Span represents the normalized evaluation of all 13 indicators, offering a unique perspective beyond just closing price.
3. Intuitive Interpretation:
Traders familiar with Ichimoku can easily interpret DW’s outputs, making it accessible and effective.
Conclusion
By combining rigorous mathematical evaluation with Ichimoku’s visualization strengths, DW provides traders with a clear, actionable representation of market conditions. This ensures that the complex integration of 13 indicators is not only analytically robust but also visually intuitive.
------------------------------------------------------------------------------------------
Comparison Between Divergence-Weighted Clouds V 1.0 (DW) and Traditional Ichimoku: NVIDIA 4H Chart
The chart showcases a side-by-side comparison of the Divergence-Weighted Clouds V 1.0 (DW) indicator (on the left) and the Traditional Ichimoku indicator (on the right). This comparison highlights the differences in how the two indicators interpret market trends and project equilibrium zones using their respective methodologies.
Key Observations and Insights
1. Base and Conversion Line Movements:
On Thursday, November 21, 2024, 17:30, in the DW indicator (left chart), the Base Line crosses above the Conversion Line, signaling a shift in medium-term equilibrium relative to short-term equilibrium.
On the Traditional Ichimoku (right chart), this crossover is not reflected until Monday, November 25, 2024, 17:30, occurring 4 days later.
Significance:
The DW indicator identifies the crossover and equilibrium shift significantly earlier due to its ability to process and normalize data from 13 distinct indicators.
This predictive capability provides traders with earlier insights, enabling them to anticipate changes and adjust their strategies proactively.
2. Cloud Dynamics and Leading Spans:
In both charts, the cloud (Kumo) represents the equilibrium and potential support/resistance zones.
The DW indicator’s Leading Span A and Leading Span B react faster to market changes, creating a more responsive and forward-looking cloud compared to the traditional Ichimoku.
Example:
On the DW chart (left), the cloud begins shifting to reflect the crossover earlier, signaling potential future support/resistance levels.
In the Ichimoku chart (right), the cloud reacts more slowly, lagging behind the DW indicator.
3. Lagging Span (Chikou Line):
In the DW indicator, the Lagging Span is based on the normalized output of the 13 indicators, reflecting their aggregated behavior rather than just the closing price shifted backward as in the traditional Ichimoku.
This provides a unique perspective on past market strength, aligning the Lagging Span more closely with the overall market condition derived from DW’s computations.
4. Price Alignment:
In the DW indicator, all normalized scores and values are mapped to align with price action, ensuring that the visualization remains intuitive while incorporating complex calculations.
------------------------------------------------------------------------------------------
Advantages of DW Over Traditional Ichimoku
1.Earlier Signal Detection:
As demonstrated by the Base and Conversion Line crossover, DW detects changes in market equilibrium 4 days earlier, giving traders a significant advantage in anticipating price movements.
2. Enhanced Predictive Power:
The Leading Spans in DW’s cloud react faster, providing clearer forward-looking support and resistance zones compared to the traditional Ichimoku.
3. Comprehensive Data Integration:
While the Ichimoku relies solely on price-based calculations, DW integrates outputs from 13 distinct indicators, offering a more robust and comprehensive analysis of market conditions.
4. Alignment with Market Behavior:
The DW Lagging Span reflects the aggregated score of multiple indicators, aligning more closely with overall market sentiment and providing a deeper context than the price-based Lagging Span in Ichimoku.
------------------------------------------------------------------------------------------
Final Note
The chart comparison illustrates how the Divergence-Weighted Clouds V 1.0 (DW) indicator outperforms traditional Ichimoku in terms of signal responsiveness and predictive accuracy. By combining the mathematical rigor of DW’s calculations with the visual clarity of Ichimoku, traders gain a powerful tool for analyzing market trends and making informed decisions.
Look at the DW chart (left) to see how early signals and cloud adjustments provide actionable insights compared to the slower reactions of the Traditional Ichimoku chart (right).

Atareum Volume Ichimuku CandleAVIC (Atareum Volume Ichimoku Candles) is clearly an awesome indicator that is based on Ichimoku concepts by combination with volume. This is a new approach of volume candles that is combined with Ichimoku concepts and creates such a powerful tool to trace the market and assists traders to make better decisions, truly.
Concept:
Using Ichimoku leading periods and calculations on redesigning new candles in combination with volume, that makes unique reform candles on Tenkansen movement, but these new candles clearly omit noises in combination with volume, and then the new redesigned system of cloud calculations builds, new series of data for Senko Span A and Senko Span B which is so odd in first view, because they will barely ever cross each other, but they show very more informative and useful.
Parameters:
Section 1 : Candle colour setting for flourishing just as you desire !
Section 2 : Defining Periods of standard Ichimoku and source of candle data in combination with determining the smoothing type of moving averages and signal period.
Section 3 : Select using Heikin Ashi based candles alongside with redesigned cloud calculation type and three additional moving averages which can plot on each newly generated candles and standard candles on a chart with the type mode defined in the previous section.
Note: if you want to omit any or all of these moving averages, you can use 0 in period, instead of selecting "None" in the plot moving option!
Usage :
Overall:
Regardless of the additional moving averages which will lead to so many situations of market according to their types and designs, that is four different period for new redesign AVIC and three period for standard chart. You can easily select periods and type for these moving averages. Also, do not forget that signal moving averages is shown only on AVIC chart and have two different colour for upward and downward trends. Other moving averages are plot by just one single colour.
Cloud levels are so important because AVIC candles show respect to them and when they break the clouds upward or downward it's surly beginning of a trend that is may last long. Also when cloud levels flatten, it is determining a support or resistance according to up cloud or down cloud nature and as long as they will continue or repeated periodically on same level of AVIC chart, it will implement their weakness or strength.
Support and Resistance:
Any flattens of cloud up or down level means the support or resistance level due to its nature, but important thing is how long the cloud lasts flatten or how many times repeated in the same level in AVIC chart.
For plotting the support or resistance you should trace first candle of start of flattens in standard chart just like following picture.
Divergence:
All Higher high or Lower low of standard chart has its reflect in AVIC chart but there is secret in it, It is named divergence. When standard chart price candles generating lower low but the AVIC chart candles do not cross the bottom, it means we will spike high as soon as AVIC candle chart complete its divergence. You can see perfect example in following picture.
Cloud level Ends
When cloud down level become flattens and cloud up level start a bull run it means we will face a great up trend movement but as soon as cloud down level starts to move up it mean we are going to finish the bull run and maybe it goes with consolidation phase or reversal phase. This reaction is exactly happen in vice versa for bear run trend. You can see both examples in following pictures.
Note: if we face end of bull run and cloud down level make a U turn shape upside down it means we will have reversal phase even not too long but it is sharp and fast reversal. If cloud down level just turn right slightly, it means we should have consolidation phase, mostly or we can continue the last trend slightly. All these situations can happen in vice versa bear run. You can see example in following picture.
Signals:
Long but risky:
You can go long when AVIC candles are green and be in position as long as they are not change in colour.
Long and safe :
You can go long when AVIC candles cross up cloud down level and be in position as long as AVIC candles cross down cloud up level.
Long and sure:
You can go long when AVIC candles cross up cloud up level and be in position as long as AVIC candles cross down cloud down level.
Short but risky:
You can go short when AVIC candles are red and be in position as long as they are not change in colour.
Short and safe :
You can go short when AVIC candles cross down cloud up level and be in position as long as AVIC candles cross up cloud down level.
Short and sure:
You can go short when AVIC candles cross down cloud down level and be in position as long as AVIC candles cross up cloud up level.
Notice : Candles with large body are so strong but if a body candle is weak or flatten it may a signal of changing colour and direction, especially when using Heikin Ashi type.
It is the result of many years of experience in markets and there are so many details about this AVIC chart which I am in the experiment phase to publish in the future, so please help me with your ideas and do not hesitate to comment and inform me any suggestions or criticism.

Ichimoku Cloud with MACD and Trailing Stop Loss (by Coinrule)The Ichimoku Cloud is a collection of technical indicators that show support and resistance levels, as well as momentum and trend direction. It does this by taking multiple averages and plotting them on a chart. It also uses these figures to compute a “cloud” that attempts to forecast where the price may find support or resistance in the future.
The Ichimoku Cloud was developed by Goichi Hosoda, a Japanese journalist, and published in the late 1960s. It provides more data points than the standard candlestick chart. While it seems complicated at first glance, those familiar with how to read the charts often find it easy to understand with well-defined trading signals.
The Ichimoku Cloud is composed of five lines or calculations, two of which comprise a cloud where the difference between the two lines is shaded in.
The lines include a nine-period average, a 26-period average, an average of those two averages, a 52-period average, and a lagging closing price line.
The cloud is a key part of the indicator. When the price is below the cloud, the trend is down. When the price is above the cloud, the trend is up.
The above trend signals are strengthened if the cloud is moving in the same direction as the price. For example, during an uptrend, the top of the cloud is moving up, or during a downtrend, the bottom of the cloud is moving down.
The MACD is a trend following momentum indicator and provides identification of short-term trend direction. In this variation it utilises the 12-period as the fast and 26-period as the slow length EMAs, with signal smoothing set at 9.
This strategy combines the Ichimoku Cloud with the MACD indicator to better enter trades.
Long/Exit orders are placed when three basic signals are triggered.
Long Position:
Tenkan-Sen is above the Kijun-Sen
Chikou-Span is above the close of 26 bars ago
Close is above the Kumo Cloud
MACD line crosses over the signal line
Exit Position:
Price increases 3% trailing
Price decreases 3% trailing
The script is backtested from 1 June 2022 and provides good returns.
The strategy assumes each order is using 30% of the available coins to make the results more realistic and to simulate you only ran this strategy on 30% of your holdings. A trading fee of 0.1% is also taken into account and is aligned to the base fee applied on Binance.

Ichimoku MA Up & DownIchimoku and MA use the default.
It is repainted because it uses a moving average line.
A marker is only true if it was created after the candle closed.
The principle is too simple.
Please enjoy using it.
- Up : Conversion Line > MA #1 and Base Line > MA #2
It is an uptrend. The short-term moving average should be above the conversion line. And the long-term should be above the Base Line.
- Down : Conversion Line < MA #1 and Base Line < MA #2
It's a downtrend. The short-term moving average should be below the conversion line. And the long-term should be below the Base Line.
You can get better results if you use a momentum indicator like RSI.
Thank you.

SuperIchi StrategyTRADE CONDITIONS
Long entry:
Tenkan-Sen is above Kijun-Sen (blue line above red line)
Price closes above both Tenkan-Sen and Kijun-Sen (price closes above both blue and red lines)
Tenkan-Sen and Kijun-Sen is above Senkou Span (both blue and red lines are above cloud)
Senkou Span is green (cloud is green)
Price pulled back and closed below both Tenkan-Sen and Kijun-Sen within last X (configurable in settings) candles (price pulled back below blue and red lines)
Short entry:
Tenkan-Sen is below Kijun-Sen (blue line below red line)
Price closes below both Tenkan-Sen and Kijun-Sen (price closes below both blue and red lines)
Tenkan-Sen and Kijun-Sen is below Senkou Span (both blue and red lines are below cloud)
Senkou Span is red (cloud is red)
Price pulled back and closed above both Tenkan-Sen and Kijun-Sen within last X (configurable in settings) candles (price pulled back above blue and red lines)
Risk management:
Each trade risks 2% of account (configurable in settings)
SL size determined by swing low/high of previous X candles (configurable in settings) or using the ATR override (configurable in settings) where the max of swing high/low or ATR value will be used to calculate SL
TP is calculated by Risk:Reward ratio (configurable in settings)
TIPS
Timeframe: I have found best results running on anything 5M and above
CREDITS
SuperIchi by LuxAlgo

MTF Ichimoku Analysis[tanayroy]Ichimoku can state market conditions better than any indicator or group of indicators(My own perspective). Ichimoku works seamlessly in different timeframes. Analysis of Ichimoku in different timeframes can give you the bigger picture of the market.
This indicator analyzes six different timeframes with Ichimoku in depth. Default timeframes are 5M, 30M, 60M, D, W, and M. You can change the default timeframes from the setting.
As we are dealing with many relations, we can define the relationship with a simple score to get the trend strength.
Ichimoku Analysis:
Relationship of Price(P) with Ichimoku indicators: Here we are analyzing the current price and Ichimoku indicators. The position of price with respect to Ichimoku indicators states the market condition clearly.
Price(P) and Kumo(C): P > C = Bullish (↑). P < C = Bearish (↓). P <> C = consolidation or no trend(↔). Score: ±2
Price(P) and Tenkan Sen(T): P >= T = Bullish (↑). P < T = Bearish (↓). Score: ±0.5
Price(P) and Kijun Sen(K): P >= K = Bullish (↑). P < T = Bearish (↓). Score: ±0.5
Price(26 bars ago) and Chiku(L): L >= P(26) = Bullish (↑). L < P(26) = Bearish (↓). Score: ±0.5
Tenkan Sen and Kijun Sen Relation. Tenkan Sen depicts short-term trends and Kijun depicts mid-term trends. So this relationship is important for analyzing the current trend of the market.
Tenkan Sen(T) and Kijun Sen(K): T >= K = Bullish (↑). T < K = Bearish (↓). Score: ±2
Direction of Ichimoku indicators.
The direction of Ichimoku indicators helps us to understand the trend strength.
Tenkan Sen's(T) direction: Upward slope = Bullish (↑). Downward slope = Bearish (↓). Flat=consolidation or no trend(↔). Score: ±0.5
Kijun Sen's(K) direction: Upward slope = Bullish (↑). Downward slope = Bearish (↓). Flat=consolidation or no trend(↔). Score: ±0.5
Senkou A(A) direction: Upward slope = Bullish (↑). Downward slope = Bearish (↓). Flat=consolidation or no trend(↔). Score: ±0.5
Senkou B(A) direction: Upward slope = Bullish (↑). Downward slope = Bearish (↓). Flat=consolidation or no trend(↔). Score: ±0.5
Cloud and other Ichimoku indicators:
Kumo or Cloud is very important in the Ichimoku system. Analyzing its relation with other indicators is important to detect the overall market condition.
Kumo(C) and Tenkan Sen(T): T >= C = Bullish (↑). T < C = Bearish (↓). T <> C = consolidation or no trend(↔). Score: ±0.5
Kumo(C) and Kijun Sen(K): K >= C = Bullish (↑). K < C = Bearish (↓). K <> C = consolidation or no trend(↔). Score: ±0.5
Kumo(C) and Chiku(L): L >= C = Bullish (↑). L < C = Bearish (↓). L <> C = consolidation or no trend(↔). Score: ±0.5
Kumo(C) Shadow: By analyzing the last 252 bars(you can change this option) we are analyzing the Kumo shadow behind the current price. If Kumo shadow is present behind the price, trend strength will be weakened. Score: ±0.5
Kumo(C) Future (Senkou A(A) and Senkou B(B)): A >= B = Bullish (↑). A < B = Bearish (↓). Score: ±0.5
Chiku(L) Analysis:
Vertical and Horizontal Chiku analysis will tell us about the possible consolidation of the price.
Chiku Vertical: if the price consolidates for the next 5 bars(You can change this option) will it run into the price. Please remember we are placing the current price 26 bars ago and we are interested to see the current price in open space for a clear trend. Score: ±0.5
Chikou Horizontal: If Chiku is in open space (Not running into the price), we want to review Chiku vertically i.e how much percentage of fall or rise of the current price can cause Chiku to run into the price.
So, the maximum trend score is ±10.5.
Ichimoku signals:
We know, that the crossover of Ichimoku indicators provides important signals. In this section, you can see all the crossover i.e when they happened (Bars ago)
Distance between price and Tenkan Sen and Kijun Sen: We know, the price come back to Tenkan/Kijun if it goes far away from Tenkan/Kijun. So it is important to note the distance between Tenkan and Price.
Please note that this indicator is not a strategy or buy/sell signal. It just shows you the picture of Ichimoku in multiple timeframes. I am working on some strategies of Ichimoku and will publish the same when my research is complete.
If you want to analyze Ichimoku in a single timeframe, please review the following indicator.
To maintain the table size you can use the shorthand notation from the setting.
Table with detailed analysis:
Table with shorthand notation:
Please comment if you want any clarification or found any bugs to report.

MZ Adaptive Ichimoku Cloud (Volume, Volatility, Chikou Filter) This study is a functional enhancement to conventionally used Ichimoku Clouds . It uses particular effective adaptive parameters (Relative Volume Strength Index (MZ RVSI ), Volatility and Chikou Backward Trend Filter) to adapt dynamic lengths for Kijun-sen, Tenkan-sen, Senkou-span and Chikou .
This study uses complete available Ichimoku Clouds trading methodology to provide trade confirmations. Its still in experimental phase so will be updated accordingly.
ADAPTIVE LENGTH PARAMETERS
Relative Volume Strength Index (MZ RVSI )
For adaptive length, I tried using Volume and for this purpose I used my Relative Volume Strength Index " RVSI " indicator. RVSI is the best way to detect if Volume is going for a breakout or not and based on that indication length changes.
RVSI breaking above provided value would indicate Volume breakout and hence dynamic length would accordingly make Ichimoku Clouds more over-fitted to better act as support and resistance . Similar case would happen if Volume goes down and dynamic length becomes more under-fit.
Original RVSI Library and study can be found here:
Volatility
Average true range is used as volatility measurement and detection tool. Dual ATR condition would decide over-fitting or under-fitting of curve.
Chikou Backward Trend Filter
Chikou is basically close value of ticker offset to close and it is a good for indicating if close value has crossed potential Support/Resistance zone from past. Chikou is usually used with 26 period.
Chikou filter uses a lookback length calculated from provided lookback percentage and checks if trend was bullish or bearish within that lookback period.
Original Chikou Filter library and study can be found here:
ADAPTIVE ICHIMOKU CLOUD
Tenkan-Sen (Conversion Line)
Tenkan-sen is a moving average that is calculated by taking the average of the high and the low for the last nine periods conventionally but in this study its length is dynamically adapted based on Volume, Volatility and Chikou filter. Default adaption range is set to 9-30 which I found universally applicable to almost every market on all time-frames.
Kijun-Sen (Base Line)
The Kijun-Sen is usually considered a support/resistance line which also acts as an indicator of price movements in the future and takes a longer period into consideration, usually 26 periods compared to Tenkan-Sen’s nine periods is used conventionally. In this study, its length is set to vary in range of 20-60 based on adaptive parameters.
Senkou-Span (Leading Span)
Senkou-Span A : Senkou Span A is the average of the highs and lows of Tenkan-Sen and Kijun-Sen so it automatically adapts accroding to dynamic lengths of Tenkan and Kijun.
Senkou-Span B : Senkou Span B is usually calculated by averaging highs and lows of the past 52 periods and plotting it 26 points to the right but this study uses adaptive parameters to adapt its dynamic length in range of 50-120 which makes Kumo (Ichimoku Cloud) a better area for support and resistance. I don’t consider its necessary to adapt Kumo’s displacement to the right, so I used conventional 26 period as offset.
Chikou -Span (Lagging Span)
The Chikou Span, also known as the lagging span is formed by taking the price source and offsetting it back 26 periods to the left but I used adaptive length in range 26-50 which makes this tool a better option to check for Chikou -Price cross check in wide range.
TRADE SIGNALS & CONFIRMATIONS
Volume : RVSI used to detect volume breakout about given point. By default, On Balance Volume based RVSI is selected for all dynamic length adaption and also for trade confirmations.
Cross(Tenkan,Kijun) : Easiest way to detect trend as if Tenkan is above Kijun then market is uptrend and vice versa.
Volatility : High volatility is a good way to confirm if price is on the move or not.
Tenkan = Kijun : Because of a wide range of Tenkan and Kijun length; their value can become equal before reversal.
Chikou > Source : A very conventional way to detect price momentum as if Chikou is above price then market is in uptrend and vice versa.
Chikou Momentum : Another simpler way to represent Chikou > Source as if momentum of price source is uptrend then price will tend to follow.
Source > Kumo : Using the best tool of Ichimoku Clouds i.e. Kumo. If price crosses both Senkou-Span A & B then market has broken potential resistance leading to a good uptrend and vice versa.
Source > Tenkan : Better way to detect price trend in short term.
Chikou Backward Trend Filter : Different from Chikou >Source in a way that Chikou filter makes sure that price crosses highest/lowest within defined period.
CHARTING
Bars Coloring : Bars coloring is set as following :
src > tenkan-Sen and src > kijun-Sen : Strong uptrend detection and shown by green bars.
src < tenkan-Sen and src < kijun-Sen : Strong downtrend detection and shown by green bars.
src > tenkan-Sen and src < kijun-Sen : Better way to detect bottom reversals as if price comes above tenkan but remains below kijun; that’s early signs of recovery. Light red bars are used for this by default.
src < tenkan-Sen and src > kijun-Sen : Better way to detect top reversals as if price comes below tenkan but remains above kijun; that’s early signs of losing potential in uptrend. Dark Grey bars are used for this by default.
Kumo Coloring : Following steps are used to derive Kumo’s dynamic color:
Average of Senkou-span A and B is calculated.
RSI with 14 period of that average is calculated.
Gradient color based on calculated RSI values with 0-100 range is derived which is final Kumo color.
Chikou Span Coloring : Dynamic coloring from Chikou Filter is used as Indicator’s Chikou ’s color.
Signals Overlay : Red and Green small triangles are used as signals overlay.

Ichimoku Cloud MasterIchimoku Cloud Master aims to provide the ichimoku trader with easy alert functionality to not miss out on valuable trade setups. The key purpose of this script is to better visualise crucial moments in Ichimoku trading. These alerts should not be used for botting in my opinion as they always need a human to confirm the ichimoku market structure. For example, is the Kijun-Sen flat and too far away from price? A good ichimoku trader will not enter at such a point in time.
Explanation of script:
Chikou(lagging span): pink line, this is price plotted 26 bars ago. People ignore the power of this it is crucial to see how chikou behaves towards past price action as seen in the chart below where we got an entry at red arrow because chikou bounced from past fractal bottom.
Kijun-Sen(base line): Black line or color coded line. This is the equilibrium of last 26 candles. To me this is the most important line in the system as it attracts price.
Kijun = (Highest high of 26 periods + Lowest low of 26 periods) ÷ 2
Tenkan-Sen(conversion line): Blue line. This is the equilibrium of last 9 candles. In a strong uptrend price stays above this line.
Tenkan = (Highest high of 9 periods + Lowest low of 9 periods) ÷ 2
Senkou A (Leading span A)= Pink cloud line, this is the average of the 2 components projected 26 bars in the future.
Senkou A = (Tenkan + Kijun) ÷ 2
Senkou B (Leading span B) = Green cloud line, this is the 52 day equilibrium projected 26 bars in the future.
Senkou B = (Highest high of prior 52 periods + Lowest low of prior 52 periods) ÷ 2
Notice how the distance between Chikou and the cloud is also 52 bars. This is all part of Hosoda's numbers which I am not going to explain here.
Fractals: These are the black triangles you find at key turning point. If you want to know how they work reseach williams fractals. I've used fractals with a period of 9 as it is an ichimoku number. These fractals are useful when working with ichimoku wave theory. Again I will not explain that here but in further education
Fractal Support: Ability to extend lines from the fractals which can be used as an entry/exit mechanism in your trading. For example wait for tenkan to cross kijun and then enter on fractal breakout.
Signals:
Crossing of Chikou (lagging span) with past Kijun-Sen: this will color code the Bars / Kijun-Sen (you can turn this off in options)
The script also has a signal for this, this will be the green and purple diamonds. Where green is bullish and purple is bearish.
wy is this important?
When current price plotted 26 candles back (chikou) crosses over the past equilibrium (kijun-sen) this usualy means price has moved past resistance levels where sellers come in. This indicates a switch in market structure and price is bullish from this point, this is the same in the other direction.
Kumo Twist: when the kumo cloud (future) has a crossover from for example green to red (bull to bear). The script plots these using the colored cross symbols as seen in the picture above. A chikou cross + a Kumo twist at same bar of next to eachother below the cloud can be a great entry sign: this would be an entry after cross in the chart above.
Kijun Bounce: when in an uptrend the price retraces back to Kijun-Sen and starts to go back up. These are marked by the yellow circles as seen in chart below:
low below Kijun-Sen and close above it
Strong Trend: when Tenkan is above Kijun, price above cloud, future cloud green, chikou above close, chikou above Kijun we establish a strong bullish trend. For bearish the exact opposite. The script has a function to send an alert at the start of such trends and to plot them with small colored circles above the bars.
Customisation:
I've added options to disable specific aspects of the indicator for those traders who do not want to use all aspects of the indicator. In the customisation tab I've given each part a clear title so you can use your own colors/shapes.
The perfect entry?
Further info:
Look into my education pane, I will be adding education in the future. The chance of me making a more advanced version of the script including line forecasting etc is rather high so watch out for that.
For those who want to master this system I recommend reading the book:
How to make money with the ichimoku system by Balkrishna M. Sadekar
Or the originals books by Hosoda the inventor of Ichimoku if you can get your hands on them and can read Japanese.
Almost all info about the ichimoku system you find on the internet will lose you money because they reduce the system to simple signals that do not generate money.
I will be providing educational material on tradingview using this indicator.

ChikouLibrary "Chikou"
This library contains Chikou Filter function to enhances functionality of Chikou-Span from Ichimoku Cloud using a simple trend filter.
Chikou is basically close value of ticker offset to close and it is a good for indicating if close value has crossed potential Support/Resistance zone from past. Chikou is usually used with 26 period.
Chikou filter uses a lookback length calculated from provided lookback percentage and checks if trend was bullish or bearish within that lookback period.
Bullish : Trend is bullish if Chikou span is above high values of all candles within defined lookback period. Bull color shows bullish trend .
Bearish : Trend is bearish if Chikou span is below low values of all candles within defined lookback period. This is indicated by Bearish color.
Reversal / Choppiness : Reversal color indicates that Chikou are swinging around candles within defined lookback period which is an indication of consolidation or trend reversal.
chikou(src, len, perc, _high, _low, bull_col, bear_col, r_col) Chikou Filter for Ichimoku Cloud with Color and Signal Output
Parameters:
src : Price Source (better to use (OHLC4+high+low/3 instead of default close value)
len : Chikou Legth (displaced source value)
perc : Percentage lookback period for Chikou Filter with defined how much candels of total length should be considered for backward filteration
_high : Ticker High Value
_low : Ticker Low Value
bull_col : Color to be returned if source value is greater than all candels within provided lookback percentage.
bear_col : Color to be returned if source value is lower than all candels within provided lookback percentage.
r_col : Color to be returned if source value is swinging around candles within defined lookback period which is an indication of consolidation or trend reversal.
Returns: Color based on trend. 'bull_col' if trend is bullish, 'bear_col' if trend is bearish. 'r_col' if no prominent trend. Integer Signal is also returned as 1 for Bullish, -1 for Bearish and 0 for no prominent trend.

Ichimoku ScreenerChecks the status of Ichimoku Cloud for 30 coins/stocks.
It may take several seconds ( around 30 sec ) to load.

Ichimoku BarsThis script follows off the principles of the Ichimoku Cloud indicator. The green zones display optimal time to buy according to the Ichimoku model. The red zones show optimal time to sell according to the Ichimoku model inverse. The yellow zones show where the conversion line meets the base line (potential up or down movement at this point). Feel free to contact me to fix any problems or add additional info.
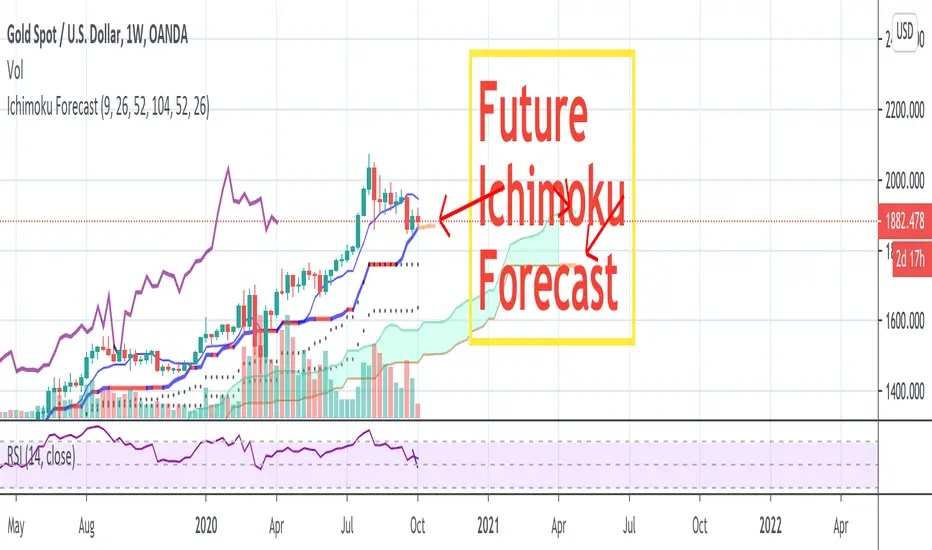
Ichimoku Cloud ForecastUsing doubled crypto settings, forecast Tenkan and Kijun lines, assuming price remains neutral (constant).
Tenkan - 14 periods
Kijun - 20 periods

Future Ichimoku Forecast by AP +3FUTURE ICHIMOKU FORECAST by AP Demo+3
Hi every Ichimoku Users,
Ichimoku is one of my favorite indicators, it helps me define market trends, find entry and follow. But sometime, I must predict how its lines (clouds, tenkan, kijun) will go? by handmade with lot of try and time!
Are you agree with me?
In order to forecast future Ichimoku to help your trade more easy and profitable, I create the FUTURE ICHIMOKU FORECAST by AP Demo+3 indicator free for everyone.
FUTURE ICHIMOKU FORECAST strengths:
- Forecast future +3 candles will make clouds, tenkan, kijun go!
- Help you indentify easy trend when clouds change, kijun go up or down!
- Flexible to change colors, displacement, hide/show lines in its.
- Flexible and good for every timeframe: W, D, 4H, 1H and shorter.
- Flexible and good for every currencies, gold , future and more.
Ichimoku Signal GeneratorThis indicator uses the standard concepts of the Ichimoku Cloud. The indicator features a fully customisable set of Ichimoku lines: Tenkan Sen, Kijun Sen, Senkou Span A & B, Kumo, Chikou Span. Besides this the Indicator also features the ability to show and hide entry signals for various entry criteria for the Ichimoku indicator:
Signal 1 - Chikou crossing Kijun - The indicator will place an arrow in the direction of the trade that is suggested by this signal.
Signal 2 - Heikin Ashi Candle closing above the Kumo - This seems to filter out a lot of bad signal versus basing the signal on price closing above the Kumo alone.
Signal 3 - Price crossing the Kijun Sen in relation to the Kumo - This signal has received the most work - It generates a signal in the suggested direction of the particular condition being met i.e. price crosses below the Kijun indicates a sell and vice versa, but it also factors in where the cross happens in relation to the Kumo cloud. These signals can be switched on or off based on weak(longs below the cloud or shorts above the cloud), neutral (long or short when inside the cloud) or strong (long above the cloud or short below the cloud).
Examples of each of the different Signal 3 indicators can be seen in the screenshot. Pale/white signals are weak, yellow are neutral & green/red are strong.
Further features (only available on Signal 3 at present: entry, stop loss and take profit levels. These are determined based on the ATR periods setting and ATR Multiplier for Stop Loss - specifying an ATR period of 10 and multiplier of 2 will result in stop loss signal being shown as 2xATR(10) above or below the entry based on whether you are shown a long or short signal. For Take Profits you can specify a Risk:Reward multiplier. By default this is set to 2:1 (or 2). This takes the distance from the stop market to the entry and multiplies it by the multiplier and then indicates a signal where you "could" exit. For the risk averse trader that want some instant gratification when they hit 1:1, the indicator will show you exactly where 1:1 is. You can then follow whatever risk management strategy you wish to - personally I find this a point at which I breakeven my stop and take half the profits (now I can't lose!) :)
The indicator follows some basic Ichimoku trading rules - not all signals will result in a winning trade (this is NOT the holy grail and doesn't claim to be) - you should always follow you own risk management strategy. You should also couple this with additional analysis to try to qualify the entry signal i.e. "does this signal and direction correlate with what the higher timeframes are telling me?".
One last feature I added - mores for psychological reasons was to only show signals for the time window I would actually be trading. I hate seeing that I missed a signal when I wasn't online - and this doesn't set me up mentally for trading well. So if there was an opportunity when I would not be trading - it is matter under the bridge! It is gone and I don't want to see it as I would not have been there to take it. This trading window can be specified using the start and end times - the setting mentions EST - however you should relate them to the exchange time for the provider of the price feed - some providers may use a different timezone to others i.e. UTC vs EST.
Wish you the best of luck!
Please provide any constructive feedback as I would love to feature further enhancements to this indicator if it helps users.
Cracking Cryptocurrency - IchimokuCracking Cryptocurrency Ichimoku
The Ichimoku Cloud is designed to measure both momentum and trend. This script is optimized for **Cryptocurrency** by default but the settings can easily be adjusted from the Input Window to trade on any asset.
The core of the Ichimoku Strategy can be broken down into two facets, depending on whether you prefer to trade short-term or long-term. The Ichimoku is a trending indicator by default, it will not catch bottoms or tops. It is a momentum indicator .
Features & Functions
Multiple Time Frames Feature: With this feature, you can view the Ichimoku of a different time frame than you are currently viewing. This is very useful for looking at daily support and resistance (Kumo, Chikou) but wishing to trade a different strategy (Price Action, Moving Averages, etc.) on a lower time frame.
Short-Term Strategy
Revolves around Tenkan and Kijun crosses. Should the Tenkan crossover the Kijun, that is a bullish indication, and a signal to buy or go long.
Conversely, should the Tenkan crossunder the Kijun that is a bearish indication, and a signal to sell or go short.
In the settings, you can choose to plot Tenkan/Kijun crosses. With this option selected, several things will occur when Tenkan/Kijun crosses happen.
1. The current bar will change colors depending on whether the signal is a buy or a sell. Buy = Aqua, Sell = Fuchsia
2. A dot will appear on the Tenkan. Buy = Green, Sell = Red
3. A label will appear above or below bar indicating the correct decision. Buy = Buy, Sell = Sell.
Long-Term Strategy
Revolves around price closing above or below the Kumo Cloud itself. Should price close above a bearish Kumo Cloud, that is a bullish indication, and a signal to buy or go long.
Conversely, should price close below a bullish Kumo Cloud, that is a bearish indication, and a signal to sell or go short.
In either case, it's important to understand what the cloud breaks are representing. They are representing a potential shift in the dominant trend. Ichimoku attempts to identify when that shift happens, so we can get on the side of the emerging trend.
In the settings, you can choose to plot Kumo Cloud Breaks. With this option selected, several things will occur when Kumo Cloud breaks happen.
1. The current bar will change colors depending on whether the signal was a buy or a sell. Buy = Aqua, Sell = Fuchsia
2. A label will appear above or below bar indicating the correct decision. Buy = Buy, Sell = Sell.
---
Please note, that the Kumo Cloud Breaks indicate stronger signals, and thus more weight should be given to them than TK Crosses. However, depending on what time frame you are trading on, Kumo Cloud breaks are a rarer occurrence than TK Crosses.
---
Additional Features
---
The Chikou (Lagging) Spam is run through a Zero Lag filter. The reason for this is aesthetic. The smoothing can be disabled in the input windows.
The purpose of the Chikou Span is to identify Support and Resistance.
If you have any questions, success or failure stories, or seek advice feel free to send me a private message here on Trading View. Trade safely.

Ichimoku with Correct DisplacementThe default Ichimoku Cloud by TradingView is strange. The kumo is only displaced 25 periods forward, and the chikou is displaced 25 periods back. This is because TradingView had the correct value for displacement (26), but they decided to subtract this displacement by 1 when actually drawing the kumo and add 1 when drawing the chikou. This script fixes this and allows for easier customization of each line in the Ichimoku.

MTF Ichimoku CloudIchimoku Cloud , Multiple Time Frames, based on the script : MTF Selection Framework functions (PineCoders)
Possible display:
- four differents Ichimoku
- Tenkan, Kijun, Chikou and Kumo (monochrome or not)
- labels : offset from line, color if you change style and with/without abbreviation
Time Frames :
- 1m
- 3m
- 5m
- 15m
- 30m
- 45m
- 1h
- 2h
- 3h
- 4h
- Daily
- Weekly
- Monthly

bg_Ichimoku_AlertsVersion 1.0
This script is a version of the Ichimoku Cloud indicator, which has its default settings optimized for Cryptocurrency trading. (20 Period Tenkan, 60 Period Kijun, 120 Period Senkou A, 30 Period Senkou B, 30 Period Offset/Displacement).
This script contains shape-plots and alert conditions for the following events:
- Bullish Entry into Red Kumo Cloud (Long Signal)
- Bearish Entry into Green Kumo Cloud (Short Signal)
- Edge-To-Edge(E2E) Completion on either type of Cloud (Possible Reversal Signal)
- Red & Green Kumo Cloud Breakout (Long or Continuing Long Signal)
- Kumo Cloud Support Breakdown, Top and Bottom of Cloud (Short Signal)
- Kumo Cloud Potential Bounce and Rejection
- Tenkan/Kijun Crossup/Down
Some things to note:
- Using short timeframes can cause certain alerts to fire many times, such as an E2E detection in a very thin cloud, or short/breakout when price is back-and-fourth at the edge of a cloud.
- The shapes are mostly there to provide a way to backtest when alerts would be triggered. They can be turned off in the settings if they become obnoxious and fill the screen with clutter.
At the time of releasing this script, the strategy version of this is still in development, but should be similarly released relatively soon. This indicator version of the script is intended for alerts, notifications, bot calls, and just general visual analysis of price action.
Thanks,
Bryan

UTG - Unimoku- This Script is based around Ichimoku , it allows you to quick select the different common (and uncommon) Ichi settings that are based around Regulated and Cryptocurrency markets.
- It will push signals/alerts based on data that it is pulling from the chart currently displayed on the screen.
- It will display
- Kumo Twists
- Kumo Crosses
- Visual Indicators based on candle structure inside clouds
