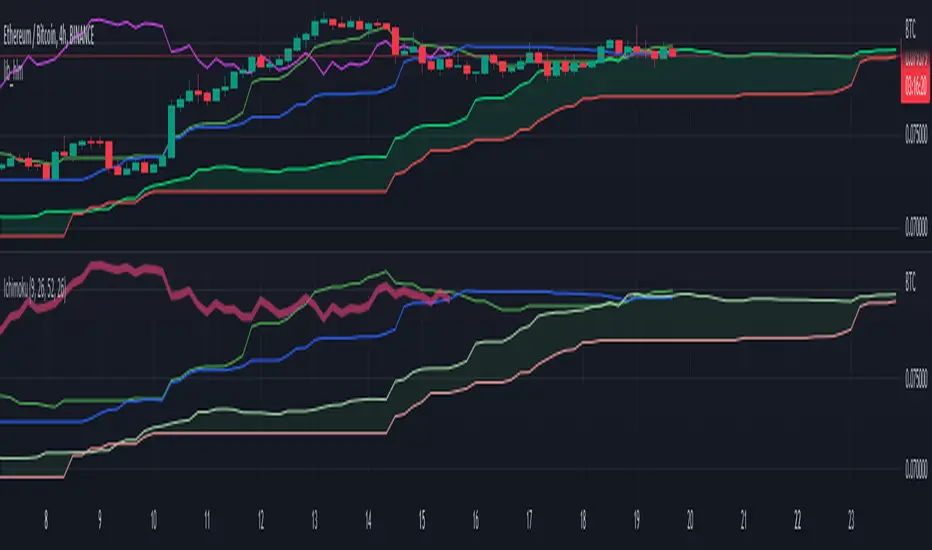
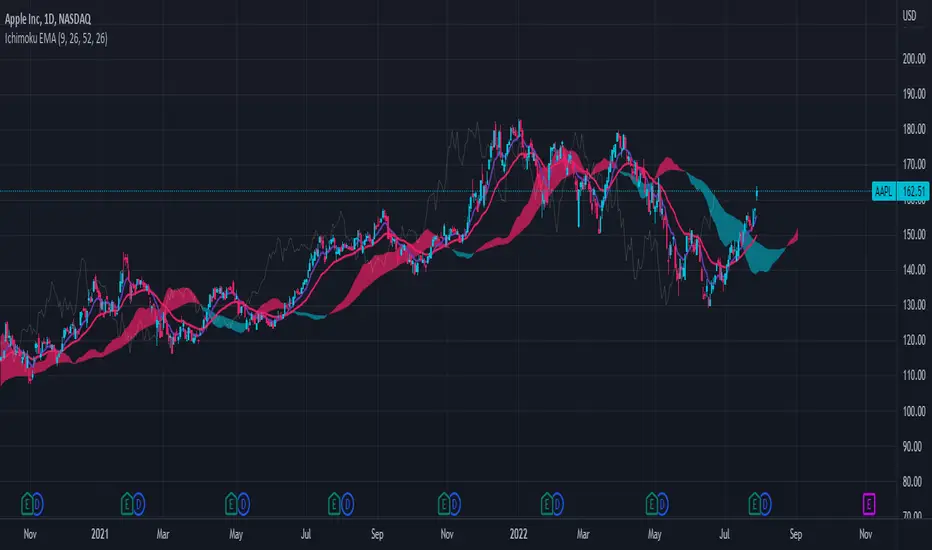
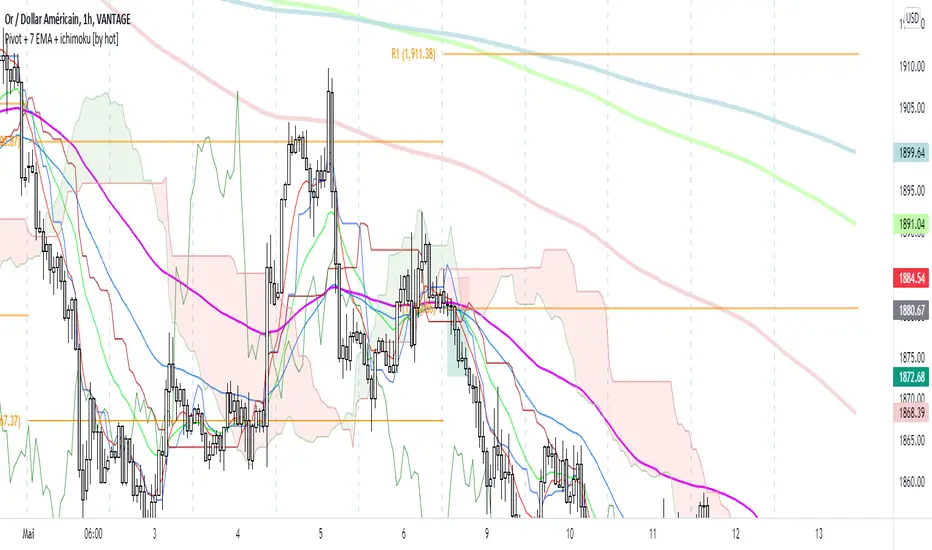
Ichimoku Box by TradictorzThis is just a "helping tool" for those who knows ichimoku as well and is the first interactive box tool because of Pine v5 ability based on input time which confirmed by users.
HOW-TO:
This tool works and draw boxes automatically based on HH (HigherHigh) and LL (LowerLow) candles on previous 26 candle bars, You have to put your start time on ichimoku CROSS (BasedLine & ConversionLine) which will give you two boxes based on 26 bar periods target. if the price passes through the HH 26 periods bar candles then you have to use the upper box as a target, if the price passes through the LL 26 periods bar candles then you have to use the lower box as a target.in the setting menu you can choose how many boxes will show you for upper or lower targets and also the ability of selecting to show ichimoku lines , clouds and crossess added in the menu setting.
Feel free to use it and enjoy it.
Ichimoku Cloud
Trailing Stoploss Bottom ActivationThe Basics
The indicator is visible on the chart as circles above and below the bar.
It will trigger an alert when the current price goes below, the low of the previous candle.
Or an alert when current price goes above, the high of the previous candle.
The indicator can be used as a trailing stoploss for (DCA/ TV) bots.
The distance between the circles and candlesticks can be adjusted. If the user prefers to set an alert e.g. a few ticks lower than the candle bottom.
What Makes It Different
The user can preset the price (of the asset e.g. BTC), where it will start looking for the condition: current price is below previous candle low (when in long position). Current price is above previous candle high (when short).
Example
In the chart above MATIC/BUSD the user has drawn a blue line at 1.70. Since there is where he expects resistance.
The user has a long position (bought at the green arrow.) The user wants to start trailing at price 1.70.
The alert will only trigger when the following conditions are met:
Condition 1 - Crossed 1.70
Condition 2 - Current candle price is below previous candle low.
In the chart above price crossed above 1.70 on 26th Oct. Current candle price (at that moment) went below previous candle low on 27th Oct, indicated with a red arrow. Here the alert will go off at 1.659 BUSD (indicated in pink).
It ignores the other two lows, indicated with orange arrows. Because condition 1 is not met.
It is possible to use multiple time frames at the same time. Some time frames might not be available depending on your Tradingview subscription.
Final Words
Disclaimer: Please use it with care and at own risk. The owner of this indicator is not liable for any financial losses.
Past performance is no guarantee of future returns.
Supertrend NinjaSupertrend Ninja
The Basics
The Supertrend Ninja is a trend-following indicator. The indicator is optimised for daily, 2 days and 3 days candlesticks and can be used on varying trending markets.
Supertrend Ninja using 2 days candlesticks only gave 7 bullish signals in 2020 and 2 in 2021 for Bitcoin/USDT (based on Binance charts). Greatly reducing false signals. It can be used on lower time frames as well, although you will encounter more noise.
This indicator could be used as a compass for DCA or TV bots as well.
What To Look For
When the background of the candlestick closes green with an upwards pointing pink arrow. It indicates a possible bullish (up)trend. To enter a trade its best to place an order a few ticks above the candle high. This way we only enter a position, when there is trend continuation.
When the background of the candlestick closes red with a downwards pointing black arrow. It indicates a possible bearish (down)trend. To enter a trade its best to place an order a few ticks below the candle low.
Exits can be determined by Fibonacci extensions, orderblocks or other resistances to name a few. Or exit the trade when the opposite background color appears.
Final words
Disclaimer: Please use it with care and at own risk. The owner of this indicator is not liable for any financial losses.
Past performance is no guarantee of future returns.
Ichimoku ScreenerChecks the status of Ichimoku Cloud for 30 coins/stocks.
It may take several seconds ( around 30 sec ) to load.
Ichimoku+Based on the ichimoku cloud system, this indicator gives two presets: Standard (9/26/52/26) and Crypto (20/60/120/30).
This also shows on a chart where Tenkan-Kijun cross happens and when a Kumo Twist happens.
Ichimoku w/Heikin-Ashi Ichimoku w/Heikin-Ashi displays the Heikin-Ashi and leading lagging span of Ichimoku Kinko Hyo.
If you change to Heikin-Ashi as it is, the basis of the calculation of Ichimoku will also use the Heikin-Ashi, so after displaying the Heikin-Ashi independently, then the calculation uses the original candlestick.
Initially, two candlesticks are displayed so that you can switch between candlesticks and Heikin-Ashi. If you uncheck the standard candlesticks check box to hide them, only Heikin-Ashi will be displayed.
In addition, the lagging span is displayed as the leading lagging span in order to align the viewpoint to one current place.
一目均衡表の遅行スパンを先行させ、平均足を表示させる指標です。
標準のまま平均足に変更すると均衡表の計算のベースも平均足を使ってしまうため、平均足を独立して表示させた上で計算は元のローソク足を使用しています。
ローソク足と平均足を切り替えられるように、最初は2つのローソク足が表示されますが、標準のローソク足のチェックボックスを外して非表示とすれば平均足のみの表示となります。
また視点を現在の1箇所に揃えるために遅行スパンを先行遅行スパンとして表示しています。
QaSH DCA Ichimoku Cloud
This powerful script takes the classic Ichimoku Cloud strategy and revitalizes it by allowing the user to make multiple DCA orders on each trade. Spreading your entry through DCA orders allows you to give the entry point room to breathe, and average down your position as the volatility momentarily pulls price against you. Both long and short positions are possible, each limited to a maximum of 5 DCA orders per trade.
When the Ichimoku cloud is showing bullish direction, only long trades will be allowed. During bearish direction, short trades will be allowed.
Two additional multi-timeframe EMA's can be added and used as filters for the long and short entries.
If you like you can use as little as one entry order per trade:
Or you can use up to a maximum of 5 DCA orders
Volume Based Ichimoku CloudIntroduction
This release focuses primarily on a volume-based Donchian. For some time I was looking for a volume-based Donchian, not finding anything that satisfied me I tried to apply one, and then I applied it to Ichimoku.
I found advantages especially in the lateralization phase, where the integration with the volume filters some false signals.
I have added some features:
- Check the conditions of buy/sell of classic Ichimoku
- Verified reverse buy/sell condition
- Alerts
- Entrance package
- possibility to choose the type of Donchian to use (classic, volume-based)
Settings
There are the classic parameters of Ichimoku, for scalping, I use setting like(6-17-34-17 or 5-14-28-14), the new parameters are:
Donchian Type : Classic / Volume Based
Show Condition : it shows green/red square on the bottom when all the conditions of Ichimoku are satisfied, without the checkmark the inputs or the alarms will not work for this type of signal
Show Reversal : it shows yellow/purple triangle on the bottom when all during short/long state condition of Ichimoku Tenkan cross the Kijun, without the checkmark the inputs or the alarms will not work for this type of signal
Trades Framework
Show Trade Lines : show the lines for Entry Point, TP1, TP2, SL
Per n Bars : For how many bars the sending lines will be drawn
Enter Gap : It's the gap, in percentage, from the last candle low/high. For example, the entry point will be set 0.1% higher than the last high of the candle, in a long situation, or 0.1% lower than the last low of the candle in a short situation.
Take Profit 1 : It's the gap, in percentage, from the entry point. For example, the first take profit will be set 0.5% higher/lower than the entry point.
Take Profit 2 : It's the gap, in percentage, from the entry point. For example, the second take profit will be set 0.5% higher/lower than the entry point.
Stop Loss : It's the gap, in percentage, from the entry point. For example, the stop loss will be set 0.5% higher/lower than the entry point.
How to use
The use will be like that for the classic Ichimoku, the combination with a volatility indicator or the volume analysis will certainly help to reduce false signals and therefore to select only the most profitable signals.
Remember that every statistical indicator is just a tool, it needs to be understood to be used at its best, otherwise, it is just a colored line in a colored graph.
Ichimoku StrategyThis is an automated Ichimoku Cloud system.
If you're interested in this script with alerts so you can fully automate your Ichimoku Cloud trading, please send me a PM @idonthodl
Buy signal when these three conditions are true:
1. Conversion line goes above the base line
2. Price is above the cloud
3. Lagging span is above price
Stop loss when:
Price goes below the breakout candle
Take profit when:
1. Conversion line goes below the base line again
Scalping IchimokuBased on the Ichimoku Cloud indicator, the Scalping Ichimoku is a strategy applied in a simple form.
How the strategy works?
The indicator will watch two filters from the Ichimoku Cloud indicator. The first one is when the price crosses the cloud (over or under). The second filter is when the conversion line crosses the baseline (over or under). When both filters happen, no matter the order or when the indicator will print an arrow signal.
Buy Signal
A buy signal, or arrow up, will appear when the price crosses over the cloud and when the conversion line crosses over the baseline.
Sell Signal
A sell signal, or arrow down, will appear when the price crosses under the cloud and the conversion line crosses under the baseline.
Exit Points
Show Exit Spots enabled. The indicator will print possible exit spots for the last entry, based on the cross from conversion with baseline. In case the cross is against the latest entry signal, it will show an "X"
One Signal At Time
The indicator will print only one signal in a single direction. It will never print the same signal as the last signal
Exit and Entry Spot At The Same Candle
In the chart, when the entry spot and an exit spot appear in the same candle, the exit spot will appear with a different color. This means that the entry spot is more accurate.
This strategy was designed for scalping, no matter the time frame or market, but it may work for swing traders as well.
Ichimoku (Cloud + Box + Prediction)In addition to Ichimoku, this indicator includes Ichimoku boxes and Ichimoku prediction indicators.
You can select the base candle with the mouse and drag it and drop.
Three boxes are drawn with periods 9, 26 and 52 and it is possible to change periods.
Prediction boxes can be drawn on the right side of the candle for the three mentioned periods .
Target prices can be shown in the borders and centers of boxes.
It is possible to change the thickness and color of the boxes.
Three boxes can also be seen in the last candle of the chart.
Ichimoku lines including Tenkansen, Kijunsen, Senko, Chikou, Quality and Kumo Cloud can be displayed on the chart.
The points corresponding to each Ichimoku line represent the value of different lines in the base candle
The crossing points of the Tenkansen and Kijunsen lines can be displayed in the chart
Predictions of the amount of Tenkansen and Kijunsen in future candles can be seen on the chart.
Ichimoku CrossThis is a trend analysis indicator based on Ichimoku
this indicator splits the chart into :
"Buy Phase" where KijunSen > TenkanSen with "Green color"
"Sell Phase" where KijunSen < TenkanSen with "Red color"
"Cross Phase" where KijunSen = TenkanSen
Close of each candle above or below KijunSen and TenkanSen determine the strength of the trend
and is shown by 3 different green colors for Bullish Trends and 3 different red colors for Bearish Trends .
ICHIMOKU Crypto Swing AlertThis is a crypto swing alert for the strategy with the same name designed for timeframes bigger than 1h.
The main components are
ICHOMOKU
KDJ
Average High
Average Low
Rules for entry
For long: we have the ichimoku crosses between tenkan and baselines, we have a rising kdj line and at the same time we have a increase in the average high
For short: we have the ichimoku crosses between tenkan and baselines, we have a falling kdj line and at the same time we have an increase in the average low
Rules for exit
We exit when we have inverse conditions than the initial ones used for entry.
Caution
This strategy does not use a risk management, so be careful with it !
If you have any questions let me know !
Ichimoku RONINA Full version of Ichimoku Kinko Hyo with many features ...
Features :
- Ichimoku Default Lines
- Settings for Shift all of Ichimoku Lines
- 52, 103, 108, 216 Periods Line
- Future TenkanSen, Kijunsen & Kumo Clouds
- 9/26/52 Cycle Counter
- Optimized for Pine Script 5
9Week_CandleThe 9-week candle is a candlestick writing method introduced in "Ichimoku Kinko Hyo, Weekly”, which creates positive and negative candles at the closing price of the current week and the opening price of 9 weeks ago to know the current state of the market. By combining the period of the basic numerical value of 9 as one candlestick, it becomes easier to grasp the direction and time relationship.
By default, the upper and lower shadows are displayed, but if you set the shadow color to the same as the background color in the settings, you can display the positive and negative of only the body.
I also created a 3-day candle based on the same method, so please use it as well.
9週足は「一目均衡表週間編」で発表されたローソク足の書き方で、当週の終値と9週前の始値で陽線・陰線を作成し、相場の現在性を知ろうとするものです。9という基本数値の期間を1本のローソク足としてまとめることで方向性と時間関係が把握しやすくなります。
デフォルトでは上ヒゲと下ヒゲが表示されていますが、設定でヒゲの色を背景色と同じにすれば実体のみの陰陽表示が可能です。
同じ考え方で3日足も作成しましたので、併せてご利用ください。
TK Cross and Kumo Twist AlertBased on the ichimoku cloud system, this shows on a chart where Tenkan-Kijun cross happens and when a Kumo Twist happens.
Six Factors Ichimoku 1.0This strategy has the purpose to help dummies to get experienced when trade with Crypocurrencies, using the Ichimoku indicator
The following script shows an strategy based on Ichimoku indicator. Taking into account the theoretical concepts of the Ichimoku Kinko Hyo, are defined six (6) factors to open position and two (2) factors to close it. According to the author of the book, in which is based the script, it is stablished that the proper combination of the six factors when the timeframe is set in 1D and the assest Cryptocurrencies (not applicable to stable Coins), has demonstrated in the Backtesting good results.
Althoug is not the purpose, the Ichimoku indicator is composed by six components (Tenkan Line, Kijun Line, Senkou Span A, Senkou Span B and Kumo Cloud) and the relative position of the current price of the assest compared with ichimoku components define these factor.
Factors to open position
Factor one. The current price is over the Ichimoku Cloud
Factor two. When Senkou Span A is greater thant Senkou Span B, proyected 22 periods forward.
Factor three. Senkou Span A, has a positive slope, during the previous periods.
Factor four.The Tenkan Line (quick line) is above the Kijun Line (slow line) during the previous periods.
Factor five. The Chikou Span Line is above the Kumo
Factor six. The slope of the sma (200) is positive.
The long entry is recomended when the following expresion is matched
F1 and F2 and F4 and F5 and (F3 or F6)
Factors to close position
Factor one. Tenkan line has a downward trajectory for previous periods. If the price change during this periods the counter reset and start again trying to prevent exit from quick variations.
Factor two. Current price is below Kijun line
The time to close position is recommended when the following expresión occurs
F1 and F2
Some of the features of the script are the following:
Initial amount of investment stablished on 100€, but can be modified by the user.
User can easily modified the period for backtesting purposes.
"Show factors" give the user and easy interface to know the current status of the strategy`s factors. The factors appears color red (false) and color green (true)
It is possible to cancel Factor F5, which is interesting after the assests has dumped strongly. The color black means that F5 is canceled.
Change the output criteria by F1 or F2 (not recommended) but available for learning purposes.
Auxiliary lines that help to idenfify strong resistances that could compromise the strategy
Enjoy it !!!
Miguel A. Calatayud
Davood Kumothis andicator is build in base of ichimoku cloud.
Select the interval at which the kumo clouds change phase and depending on what time frame we are in, we give the time inputs to the indicator.
then, the indicator calculates the area of the cloud and set the ascending and descending targets when price break the highest or lowest candle in that time range.
So entry point is the highest and lowest candle and first and second targets are determined by the indicator.
note : i used this andicator only in crypto market not forex and it works well
Specific Date Series (llnylk's)Show specific dates/bars (useful for Ichimoku cloud)
Show where are -9th bar, -20th bar, -26th bar, -52th bars in the past
ICHIMOKU Crypto Swing StrategyThis is a crypto swing strategy designed for timeframes bigger than 1h.
The main components are
ICHOMOKU
KDJ
Average High
Average Low
Rules for entry
For long: we have the ichimoku crosses between tenkan and baselines, we have a rising kdj line and at the same time we have a increase in the average high
For short: we have the ichimoku crosses between tenkan and baselines, we have a falling kdj line and at the same time we have an increase in the average low
Rules for exit
We exit when we have inverse conditions than the initial ones used for entry.
Caution
This strategy does not use a risk management, so be careful with it !
If you have any questions let me know !
BOLT ICHIMOKUThis strategy is based on custom ichimoku cloud to be used best in 1 minute time-frame. The buy and sell condition must met 3 conditions before it is legit. The strategy backed by ichimoku cloud for initial trend identification, RSI for momentum bias and EMA for major trend bias.
Currently, only tested in Futures Crude Palm Oil (FCPO) market. Maybe can be used in other different markets, user have to test it by themselves.
User can toggle/enable the stop-loss and take-profit value at the bottom of the settings.
BOLT ICHI M1A no cut-loss strategy based on custom ichimoku cloud to suit 1 minute timeframe strategy for FCPO market. However, there is a toggle button to enable stop-loss and take profit at the bottom that based on money value (RM) not tick count.
Ichimoku Cloud Strategy IdeaThis strategy idea uses the famous Ichimoku Cloud (Forward-shifted SMA-9 and SMA-26) and Chiku (52-candle lagged close price) with its default parameters. This strategy is slow and issues few signals. However, this is one of the most performant long-term trend trading strategies. It usually works well on 1D and 4H timeframes and even better on trending instruments. This is the implementation used in QuantCT app.
You can set operation mode to be Long/Short or long-only.
You also can set a fixed stop-loss or ignore it so that the strategy act solely based on entry and exit signals.
Trade Idea
When both close price and chiku are above the cloud, market is considered rising (bullish) and the plotted cloud becomes green.
When both close price and chiku are below the cloud, market is considered falling (bearish) and the plotted cloud becomes red.
Otherwise, market is considered ranging and the plotted cloud becomes orange.
Entry/Exit rules
Enter LONG right after both close price and chiku went above the cloud (i.e. when the end of the plotted cloud becomes green).
Enter SHORT right after both close price and chiku went below the cloud (i.e. when the end of the plotted cloud becomes red).
EXIT market when close price enters the cloud.
CAUTION
It's just a bare trading idea - but a profitable one. You can enhance this idea and turn it into a full trading strategy with enhanced risk/money management and optimizing it, and you ABSOLUTELY should do this!
DON'T insist on using Long/Short mode on all instruments! This strategy performs much better in Long-Only mode on several instruments (Like BTC , ETH, etc.), and also performs better in Long/Short mode on other instruments (Like VET, BNT, etc.).