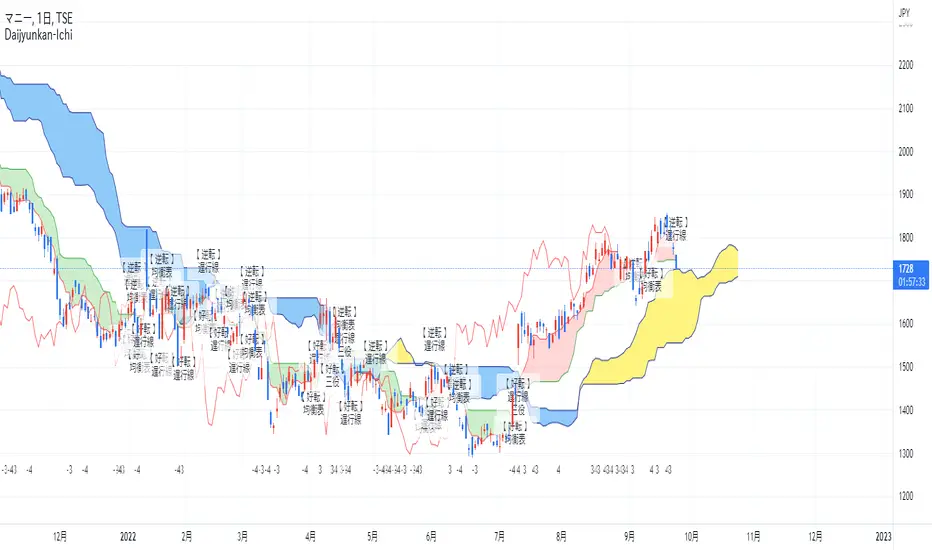
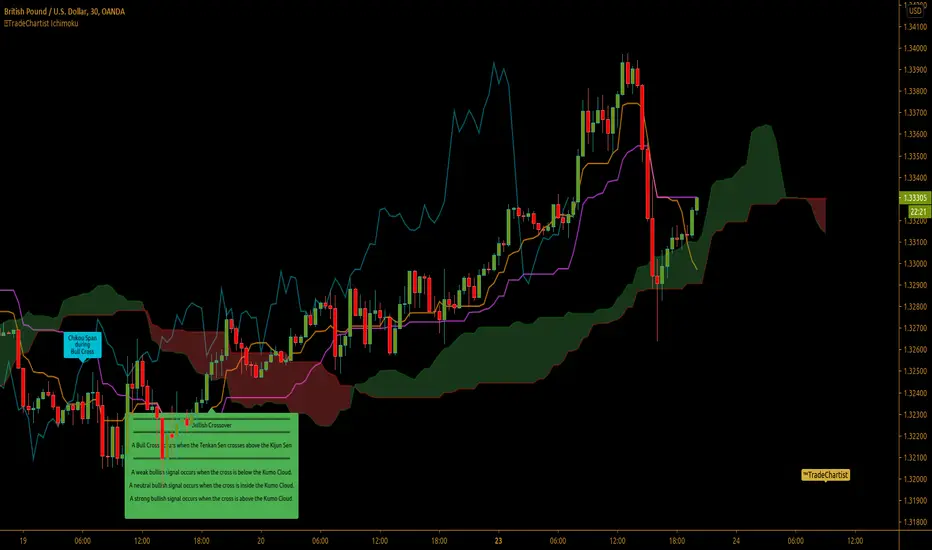
IA2C9WThis IA2C9W indicator is the digital representation of what is called a Candlestick 9 Weeks , and is an Ichimoku Kinkohyo indicator described in volumes 3 & 4 from the original books from Hosoda, read and translated. A long 10 years story !
It was scripted for the IA2 ( Ichimoku Academy 2.0) community as members learned how to use it.
It gives some states about a cycle.
Source code is not public.
Ichimoku Cloud
IA2NSThis IA2NS indicator is the digital representation of what is called Nakane Sen , and is an Ichimoku Kinkohyo indicator described in volumes 3 & 4 from the original books from Hosoda, read and translated. A long 10 years story !
It was scripted for the IA2 ( Ichimoku Academy 2.0) community as members learned how to use it.
Source code is not public.
IA2NC9WThis IA2C9W indicator is the digital representation of what is called a Candlestick 9 Weeks , and is an Ichimoku Kinkohyo indicator described in volumes 3 & 4 from the original books from Hosoda, read and translated. A long 10 years story !
It was scripted for the IA2 (Ichimoku Academy 2.0) community as members learned how to use it.
It gives some states about a cycle.
Source code is not public.
Ichimoku Profit Meter by Solah AzmanAims to simplify Ichimoku Cloud and filter out market consolidation. The graph shows price movement outside the Kumo(Cloud), i.e. if price crossover cloud at $1 and enters back the cloud at $1.50, the graph will show that price has moved $0.50. Tenkan Kinjun is the default SAR type but you may change it to your liking.
RSI CANDLE ICHIMOKU v1.0This indicator plots RSI candles with Ichimoku cloud and lines.
So you can get buy or sell signals like Ichimoku strategy system.
Your comments and suggestions will be greatly appreciated.
Good Luck,
Easy Loot BandsEasy Loot Bollinger Bands:
This indicator is a bollinger band that also auto-generates a trendline, giving you the best opportunities to buy & sell. That's it.
You can use this on any time-frame, any stock, and any cryptocurrency.
Neru_UniversalScalpingNeru_UniversalScalping - Tool
Markets: All markets, this is a universal tool which is using 100% standard settings for all built-in indicators.
Interval: 3 minutes to maximum 2 hours.
Built-In indicators:
- Basic Candlesticks (E/R as stronger one and H/T as weaker one)
- Stochastic breakups and breakdowns shown in different candle colors (close, 20 and 80)
- Extreme overbought and oversold conditions marked with a + an - (Stochastic >95 and <5)
- Daily and 4H Pivot Points
- Ichimoku Cloud (including Senkou´s, Tenkan + Kijun)
- 5 SMA´s (50,100,200,400 and 800)
- TrendEvaluator at the bottom, showing a basic trend (calculated from the cloud and 3 Moving Averages, 50, 100 and 200)
- Temporary buying + selling pressure labelled as arrows above and below candles
- Standard Parabolic Sar built-in
Risk Management:
You have the option to plot a basic risk calculation into the charts, based on the assumption, you don´t use a leverage and 100% equity.
Shown is a stop loss offset, the % and the price. Same goes for 3 take profits. Fees and spread are NOT included in this calculations.
You can choose between 0.25%, 0.5%, 1% and 1.5%, obviously the smaller the timeframe, the smaller risk you need to consider.
General Information:
All settings are adjustable, also in color and position.
This is not an automated system, that is generating entries and exits. With help of the built-in alarms you will have always to consider
the environment such as the trend, the relative position to the Pivot Points, the relative position to the Moving Averages and for example
conditions such as oversold / overbought and key-levels. It´s not replacing a human.
Please always be aware that counter trades on pullbacks are always more risky than trend-follow trades and a beginner should stick to less risk.
Warm regards, Neru
Ichimoku Cloud OnlyPurpose: Makes your chart easier to read by removing some features displayed in the default Ichimoku Cloud
Benefit: Frees up space for other indicators that do the same or similar things. (like MAs and EMAs)
Removed Indicators: Conversion Line, Base Line, and Lagging Span.
NeoMoonShots - ICHIMOKU MTF CYPTO V1Ichimoku cloud study to support multiple time frame (TF) at any given TF.
Supported TFs are:
1. 1 Hour
2. 4 Hour
3. Daily
4. 2Days
5. 3Days
6. Weekly.
Infopanel to show SenkouSpan A and B levels.
NeruSuite_v5NeruSuite_v5
_______________
NeruSuite combines different indicators in one tool and plots them mostly as labels in the chart.
All indicators are using absolute standard settings and are universal for all markets.
You can adjust the Ichimoku Cloud. All other used indicators are adjustable in color and position.
Implemented indicators:
- Showing extreme stochastic RSI conditions as + and -
- SMA Death + Golden crosses (SMA50 & SMA200)
- Three plotted SMAs, 50, 100 and 200
- BTL Lines
- Barcolors Stochastic Breakup & Breakdown
- Tenkan, Kijun
- Senkou A & B
- Ichimoku Cloud
- Engulfings (E/R)
- Haramis (H/T)
- Tweezer (H/T)
- Railroads (E/R)
- Horizontal Short-Longterm Support / Resistance Levels
- Pullbacks (PB)
- Trend Buys / Trend Sells (TS/TB)
- Hidden & Regular Bull- & Bear Divergences (HI, RE)
- Reversal, Increasing & Decreasing, Oversold & Overbought Volume (RV, DV, UV)
These indicators work well together and will help you to spot Highs / Lows or also Trend-Follow setups.
___________________________
Warm regards,
Neru
Neru_TrendEvaluator_v1Neru_TrendEvaluator_v1
_____________________
This trend-finder tool is showing you at the bottom of the chart (adjustable), what the current supertrend for the chosen interval is.
Used indicators are the Ichimoku Cloud (adjustable settings) and three SMAs (also adjustable).
Both have standard settings and are useful for Stocks, Forex and Cryptocurrencies.
_____________________________________________
Warm regards,
Neru
Kurotoga CloudKurutoga Cloud is a cousin-inpired cloud of the Ichimoku Kinko Hyo.
It removes the unnecessary fluff and just focus drawing the 50% levels on current mainframe for the typical RSI standard length (14) settings on current time-frame (Lead A) and the Higher time-frame (Lead B)
User should pay particular attention to where the cloud will draw longer straight-lines. Those ranges are 50% ranges of significance and likely to act as target zones for support/resistances in the future.
The cloud can also act a a very reliable trend indicator.
Intraday = D
D = W
W = M
M = 4M
[Birbicator] StochTKDBirbicator is a custom indicator prototype based on Stochastic oscillator, enriched with Stochastic of Tenkan and Kijun of Ichimoku with adjusted, prototyped settings. It includes the ribbon, which corresponds with the momentum per Stochastic oscillator crossovers. It involves histogram as well which displays the relation of distance between Tenkan and Kijun. It displays the coloured candles in the main chart also. The orange colour is bullish while dark candle is bearish. White candles are neutral.
The indicator displays the strength of the trend when Stochastic and TK are following the same direction. The stronger buy/sell signal appears on the Stoch crossover simoultaneous to Histogram crossover.
inwCoin Ichimoku Risk% Strategy=========================
English
=========================
Ichimoku Cloud strategy,
Buy = Conversion Line cross Baseline up ( When price above cloud )
Sell = Conversion line cross baseline down
==========================
Thai
==========================
Ichimoku Cloud แต่ใช้หลักการเส้น Conversion Line กับ Baseline ตัดกัน ตอนราคาเหนือ cloud
กำหนดจุด stop จากใต้ low ย้อนหลังกี่แท่งก็เลือกได้ที่ Low/High candlestick option
ใช้ค่า Basic ไม่ได้ใช้ตามที่ชาวคริปโตเขาใช้กัน
Ichimoku Trinh PhatThis is a customized version of Ichimoku Kinko Hyo.
There are two Kijun of last 65 and 129 bars as strong support/resistance levels.
Some vertical lines are added at starting point of Tenkan, Kijun ...
Cloud Breakout BFBased on code by nathanhoffer
Long signal is after a close above Kumo cloud, short signal after close below it.
You can adjust stuff in the settings.
Ichimoku_RVAffichage de l'Ichimoku Kinko Hyo.
Le paramétrage permet :
- D'avoir le bon paramétrage de l'Ichimoku (décalage de 26 périodes, bougie actuelle INCLUSE)
- De coloriser ou non le Kinkohyo
- D'afficher ou non les lignes passives (projection passive du Kinkohyo et du Kumo)
- D'annuler ou non le décalage (du Kumo)
- D'afficher ou non les canaux (bornes hautes et basses de Tenkan, Kijun et de la SSB)
- De prendre ou non la bougie en cours (dans le calcul des lignes de l'Ichimoku)
- D'afficher un mini canal 3 périodes (permet d'intégrer les vagues de l'UT inférieure directement sur l'UT de travail)
ICHI + EMA / MA + Swing + P SAR + BB A combination of Swing, Ichimuko and 3 different kijunsen, EMA, MA, MA and EMA, ( cross ), Parabolic Sar, BB, and the middle line of Bolinger Band Indicators
open source to the further adjustment
Dual Ichimoku CloudDual Ichimoku cloud
Now you don't need to switch between time frames to see cloud support/resistance!
Configure cloud as you wish then set ratio.
Example Rations
3 Minutes to 15 Minutes = 5
15 Minutes to 1 Hour = 4
1 Day to 1 Week = 5