Multi Timeframe BOS & rBOSThis is the same Multi-Timeframe Break of Structure and Market Structure Shift posted by Lenny_Kiruthu. However, the only difference is the naming of Market Structure Shift to rBOS (Break of Structure Reverse). To me, they are all break of structures when previous peaks or valleys are violated. The only difference is in sequence. Once a sequence of BOS reverses, then a new sequence begins. To me, this simplifies the various terminology incorporated by different systems such as ICT or SMT which adds unnecessary complexity.
eT
Ict

ICT Turtle Soup (Riz)The ICT Turtle Soup Complete System is an advanced implementation of the Inner Circle Trader's interpretation of the classic Turtle Soup pattern, designed to identify and trade liquidity sweeps at key market levels. This strategy capitalizes on the systematic stop-loss hunting behavior of institutional traders by detecting when price temporarily breaches significant support/resistance levels to trigger retail stop-losses, then quickly reverses direction.
Core Trading Logic
Liquidity Sweep Detection Method
The strategy monitors five critical liquidity pools where retail traders commonly place stop-loss orders:
⦁ Yesterday's High/Low: Previous daily session extremes
⦁ Daily High/Low: Rolling 20-day period extremes
⦁ 4-Hour High/Low: 30-period extremes on 4H timeframe
⦁ 1-Hour High/Low: 50-period extremes on hourly timeframe
⦁ Recent High/Low: Current timeframe extremes (20-40 bars based on trading mode)
Entry Signal Generation Process
Buy Signal (Sell-Side Liquidity Sweep):
1. Price penetrates below a key support level by a minimum threshold (5-15 ticks depending on signal quality settings)
2. The penetration bar must show strong rejection with at least 30-50% of the candle's range closing back above the swept level
3. Multi-timeframe confirmation checks for structure shift on lower timeframe (break of recent swing high)
4. Confluence scoring system evaluates 7 factors, requiring minimum 3 confirmations:
⦁ Liquidity sweep detected (weighted 2x)
⦁ Higher timeframe bullish market structure
⦁ Lower timeframe bullish break of structure
⦁ Bullish Fair Value Gap presence
⦁ Bullish Order Block formation
⦁ ICT Kill Zone timing alignment
Sell Signal (Buy-Side Liquidity Sweep):
Mirror opposite of buy signal logic, detecting sweeps above resistance levels with bearish rejection.
Risk Management & Position Sizing
Stop Loss Placement:
⦁ Calculated using ATR (Average True Range) multiplied by an adaptive factor
⦁ Base multipliers: Scalping (1.0x), Day Trading (1.5x), Swing Trading (2.0x)
⦁ Further adjusted by signal quality: Conservative (-20%), Balanced (0%), Aggressive (+20%)
⦁ Positioned beyond the liquidity sweep point to avoid re-sweeping
Take Profit Targets:
⦁ TP1: 2.0R (Risk-Reward ratio)
⦁ TP2: 3.5R
⦁ TP3: 5.0R
⦁ All levels rounded to tick precision for accurate order placement
Advanced Features & Filters
Multi-Timeframe Structure Analysis
The system performs top-down analysis across three timeframes:
⦁ Higher Timeframe (HTF): Determines primary trend bias
⦁ Medium Timeframe (MTF): Confirms intermediate structure
⦁ Lower Timeframe (LTF): Identifies precise entry triggers
ICT Kill Zones
Incorporates time-based filtering for optimal trading sessions:
⦁ Asian Session (8PM-12AM UTC)
⦁ London Session (2AM-5AM UTC)
⦁ New York Session (7AM-10AM UTC)
⦁ London Close (10AM-12PM UTC)
Smart Money Concepts Integration
⦁ Fair Value Gaps (FVG): Identifies and displays price inefficiencies that act as magnets
⦁ Order Blocks: Marks institutional accumulation/distribution zones
⦁ Mitigation Detection: Automatically removes FVGs and Order Blocks when price fills them
⦁ Duplicate Sweep Prevention: 10-bar lookback prevents multiple signals at same level
Adaptive Trading Modes
Three pre-configured modes automatically adjust all parameters:
⦁ Scalping: Tight stops, quick targets, 15-minute to 1-hour focus
⦁ Day Trading: Balanced approach, 4-hour to daily analysis
⦁ Swing Trading: Wide stops, extended targets, daily to weekly perspective
⦁ Custom Mode: Full manual control of all parameters
Signal Quality Management
⦁ Conservative: Requires 5/7 confluence factors, tighter sweep threshold (5 ticks), 50% minimum rejection
⦁ Balanced: Standard 3/7 confluence, moderate threshold (10 ticks), 30% rejection
⦁ Aggressive: Only 2/7 confluence needed, wider threshold (15 ticks), 20% rejection
Visual Components & Dashboard
Real-Time Information Panel
Displays current market conditions including:
⦁ Active trading mode and quality settings
⦁ Timeframe configuration (HTF/MTF/LTF)
⦁ Market bias from higher timeframes
⦁ Current kill zone status
⦁ Liquidity sweep detection status
⦁ Confluence scoring for both directions
⦁ Risk parameters and targets
Trade Visualization
⦁ Entry, stop-loss, and three take-profit levels with precise price labels
⦁ Automatic cleanup when targets are hit or new signals appear
⦁ Maximum of one active setup displayed for chart clarity
⦁ Color-coded boxes for Fair Value Gaps and Order Blocks
How to Use This Indicator
Recommended Timeframes
⦁ Scalping Mode: 1-minute to 5-minute charts
⦁ Day Trading Mode: 5-minute to 15-minute charts
⦁ Swing Trading Mode: 1-hour to 4-hour charts
Optimal Market Conditions
⦁ Works best in ranging or trending markets with clear support/resistance levels
⦁ Most effective during high-liquidity sessions (London/New York overlap)
⦁ Avoid using during major news events unless specifically targeting news-driven sweeps
Signal Interpretation
1. Wait for triangle signal (up/down) with confluence score
2. Verify the swept level shown in the dashboard
3. Confirm risk-reward ratios match your trading plan
4. Enter at market or set limit order at indicated entry level
5. Place stop-loss and take-profit orders at displayed levels
Customization Tips
⦁ Adjust Signal Quality based on market volatility (Conservative for volatile, Aggressive for quiet)
⦁ Modify sweep threshold if getting too many/few signals
⦁ Toggle individual liquidity levels based on their relevance to your timeframe
⦁ Use Kill Zone filter for session-specific trading
Risk Disclaimer
This indicator identifies potential trade setups based on liquidity sweep patterns but does not guarantee profitable outcomes. Past performance does not indicate future results. Always use proper risk management and never risk more than you can afford to lose. The indicator should be used as part of a comprehensive trading plan that includes your own analysis and risk tolerance assessment.

Smart Money LITE — Daily Sweep → HQ Signals (VWAP • FVG • CHoCH) 🔗 PRO VERSION (VWAP + FVG + CHoCH — full confirmations, all timeframes):
chartedgepro.gumroad.com/l/rmnbhw
Daily liquidity sweep → confluence signals with VWAP, FVG & CHoCH. Works on all timeframes & markets (Indices, Forex, Crypto).
WHAT IT DOES
Smart Money LITE+ highlights high-quality LONG/SHORT signals only after daily liquidity is swept (previous day high/low) with confluence from VWAP, FVG and structure (BOS/CHoCH).
Works on all timeframes and across markets: indices, forex, crypto.
KEY FEATURES (Lite)
• Daily sweep logic (PDH/PDL) + previous day zones
• VWAP + deviation bands (optional) and proximity filter
• 3-bar FVG boxes (visual) with adjustable extension
• ATR/volatility filter, optional HTF trend filter
• Anti-spam cooldown, clean LONG/SHORT labels
• Alerts: HQ LONG / HQ SHORT
HOW TO USE
1. Wait for price to sweep PDH/PDL → indicator opens “signal window”.
2. Look for confluence: VWAP touch/proximity + CHoCH or BOS in direction.
3. Enter with proper risk management (stop beyond swing/zone, partials).
SETTINGS TIPS
• Enable “Require VWAP Confluence?” for strictest setups.
• Use “HTF Trend Filter?” to align with higher-timeframe EMA trend.
• Adjust “After sweep (bars)” to define signal validity window.
• FVGs are visual in Lite — advanced filtering and confirmation are in Pro.
WHO IT'S FOR
Scalpers, intraday, and swing traders looking for objective, visual signals based on liquidity sweeps and VWAP/FVG confluence.
PRO VERSION (full confirmations)
Adds advanced FVG/iFVG logic, more confluence filters, dynamic risk tools and extended alert packages — optimized for all timeframes.
👉 chartedgepro.gumroad.com/l/rmnbhw
NOTES
• For educational purposes only. No financial advice.
• “Lite” is open-source; redistribution of code follows TradingView rules.

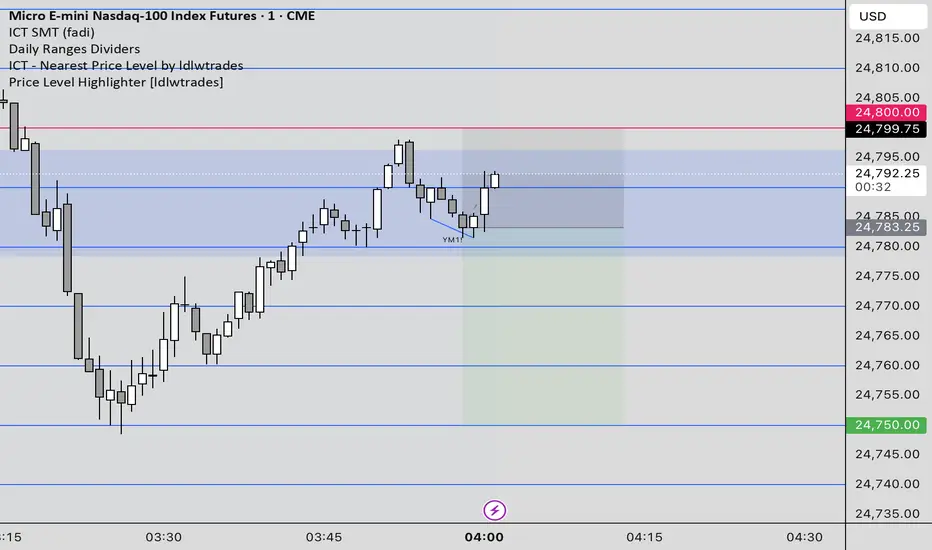
Price Level Highlighter [ldlwtrades]This indicator is a minimalist and highly effective tool designed for traders who incorporate institutional concepts into their analysis. It automates the identification of key psychological price levels and adds a unique, dynamic layer of information to help you focus on the most relevant area of the market. Inspired by core principles of market structure and liquidity, it serves as a powerful visual guide for anticipating potential support and resistance.
The core idea is simple: specific price points, particularly those ending in round numbers or common increments, often act as magnets or barriers for price. While many indicators simply plot static lines, this tool goes further by intelligently highlighting the single most significant level in real-time. This dynamic feature allows you to quickly pinpoint where the market is currently engaged, offering a clear reference point for your trading decisions. It reduces chart clutter and enhances your focus on the immediate price action.
Features
Customizable Price Range: Easily define a specific Start Price and End Price to focus the indicator on the most relevant area of your chart, preventing unnecessary clutter.
Adjustable Increment: Change the interval of the lines to suit your trading style, from high-frequency increments (e.g., 10 points) for scalping to wider intervals (e.g., 50 or 100 points) for swing trading.
Intelligent Highlighting: A key feature that automatically identifies and highlights the single horizontal line closest to the current market price with a distinct color and thickness. This gives you an immediate visual cue for the most relevant price level.
Highly Customizabile: Adjust the line color, style, and width for both the main lines and the highlighted line to fit your personal chart aesthetic.
Usage
Apply the indicator to your chart.
In the settings, input your desired price range (Start Price and End Price) to match the market you are trading.
Set the Price Increment to your preferred density.
Monitor the chart for the highlighted line. This is your active price level and a key area of interest.
Combine this tool with other confirmation signals (e.g., order blocks, fair value gaps, liquidity pools) to build higher-probability trade setups.
Best Practices
Pairing: This tool is effective across all markets, including stocks, forex, indices, and crypto. It is particularly useful for volatile markets where price moves rapidly between psychological levels.
Mindful Analysis: Use the highlighted level as a reference point for your analysis, not as a standalone signal. A break above or below this level can signify a shift in market control.
Backtesting: Always backtest the indicator on your preferred market and timeframe to understand how it performs under different conditions.

Price Level HighlighterThis indicator is a minimalist and highly effective tool designed for traders who incorporate institutional concepts into their analysis. It automates the identification of key psychological price levels and adds a unique, dynamic layer of information to help you focus on the most relevant area of the market. Inspired by core principles of market structure and liquidity, it serves as a powerful visual guide for anticipating potential support and resistance.
The core idea is simple: specific price points, particularly those ending in round numbers or common increments, often act as magnets or barriers for price. While many indicators simply plot static lines, this tool goes further by intelligently highlighting the single most significant level in real-time. This dynamic feature allows you to quickly pinpoint where the market is currently engaged, offering a clear reference point for your trading decisions. It reduces chart clutter and enhances your focus on the immediate price action.
Features
Customizable Price Range: Easily define a specific Start Price and End Price to focus the indicator on the most relevant area of your chart, preventing unnecessary clutter.
Adjustable Increment: Change the interval of the lines to suit your trading style, from high-frequency increments (e.g., 10 points) for scalping to wider intervals (e.g., 50 or 100 points) for swing trading.
Intelligent Highlighting: A key feature that automatically identifies and highlights the single horizontal line closest to the current market price with a distinct color and thickness. This gives you an immediate visual cue for the most relevant price level.
Highly Customizabile: Adjust the line color, style, and width for both the main lines and the highlighted line to fit your personal chart aesthetic.
Usage
Apply the indicator to your chart.
In the settings, input your desired price range (Start Price and End Price) to match the market you are trading.
Set the Price Increment to your preferred density.
Monitor the chart for the highlighted line. This is your active price level and a key area of interest.
Combine this tool with other confirmation signals (e.g., order blocks, fair value gaps, liquidity pools) to build higher-probability trade setups.
Best Practices
Pairing: This tool is effective across all markets, including stocks, forex, indices, and crypto. It is particularly useful for volatile markets where price moves rapidly between psychological levels.
Mindful Analysis: Use the highlighted level as a reference point for your analysis, not as a standalone signal. A break above or below this level can signify a shift in market control.
Backtesting: Always backtest the indicator on your preferred market and timeframe to understand how it performs under different conditions.
ICT Killzones x FVGs @dancizyeaaICT Killzones x FVGs Indicator
Last update: 19-SEP-2025
Creator: dancizyeaa
This indicator targets key session highs and lows combined with Fair Value Gaps (FVGs) visualization on TradingView charts. It integrates multiple market sessions (Asia, London, New York), drawing killzones, session separators, and key price levels with user-configurable alerts and filtering. It supports dynamic timeframe limits, coloring by FVG size, moving averages, and labels.
The ICT Killzones x FVGs indicator highlights major session high and low price zones with added fair value gaps, assisting traders in identifying potential reversal or breakout areas. It automatically draws session lines, pivot points, and dynamically colors FVG rectangles by size. It includes options for timezone offsets, alert setups for pivot breaks, and versatile visual configuration for clear session segmentation and market structure awareness.
Detailed Function Descriptions
Session Time and Date Handling:
Manages time offsets and date components to correctly align session boundaries and day separators considering timezone differences, including a weekday naming system for chart labeling.
FVG Detection and Coloring:
Detects bullish and bearish Fair Value Gaps based on recent candles, calculates gap size, and colors gaps differently if they are small or normal size to highlight relevant market inefficiencies.
Killzone (Session High/Low Zone) Management:
Creates and updates boxes, lines, and labels representing important market session zones from Asia to New York, including the ability to extend or limit these objects across timeframes and manage range averages.
Pivot Points and Midpoint Labels:
Draws session-specific pivot highs/lows and optional midpoint lines with alert conditions when these levels are broken, allowing traders to track and be notified of key market moves.
Session Separators and Open Lines:
Draws vertical and horizontal lines marking daily, weekly, and monthly open prices and session start/end boundaries with customizable styling, enhancing chart structure clarity.
Moving Average Overlay:
Optionally plots a user-defined simple moving average line for trend analysis, with customizable length and color.
Alert System:
Provides user-configurable alerts on pivot breaks and other key events, ensuring timely trading signals.
User Inputs and Settings:
Extensive input options to customize timezone offset, session visibility, line styles, transparency, label sizes and positions, and filter parameters for FVGs for a tailored trading experience.

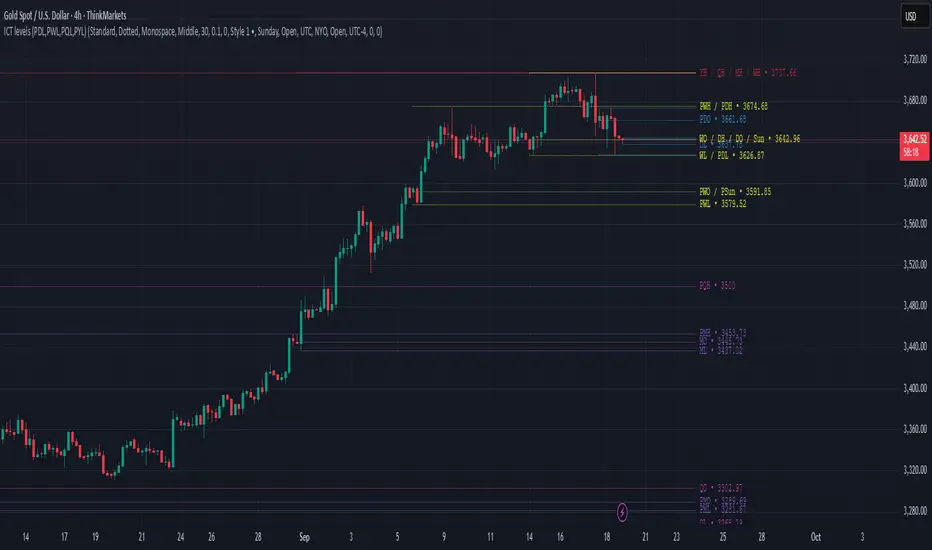
ICT levels (PDL,PWL,PQL,PYL) PDHThis indicator plots ICT reference levels for multiple timeframes, including:
Daily (DO, DH, DL, PDO, PDH, PDL)
Weekly (WO, WH, WL, PWO, PWH, PWL)
Monthly (MO, MH, ML, PMO, PMH, PML)
Quarterly (QO, QH, QL, PQO, PQH, PQL)
Yearly (YO, YH, YL, PYO, PYH, PYL)
🔹 Custom Target (NYO or user-defined):
The script also lets you display a special target level (e.g. New York Open) at a user-defined hour:minute with selectable timezone.
🔹 Day of Week levels (DoW):
You can choose a specific weekday (e.g. Tuesday Open/High/Low/Close) with adjustable timezone, allowing flexible session-based analysis.
🔹 Display & Style Options:
Extend lines (None, Right, Left, Both)
Line style (Solid, Dashed, Dotted)
Font type (Default, Monospace)
Label position (Top or Middle, with spacing adjustment)
Offset bars for labels
Merge labels if levels are too close (threshold % configurable)
🔹 Priority Handling:
Includes High Timeframe Priority (TFP) option so higher-TF levels overwrite lower ones when overlapping.
🔹 Customization:
Global text and line colors
Individual colors for Day, Week, Month, Quarter, Year, DoW, and Target
Option to show/hide prices next to labels in different styles
Opening Range Gaps [LEG]📌 Opening Range Gaps
Are you tired of indicators that don’t show the correct opening price on CFDs, or that fail to capture the true 09:30 open or the 16:14 on Nasdaq futures?
Or worse… tools that only work on the 1-minute chart?
👉 This script was built to fix that.
🔑 Why this indicator?
Unlike most gap tools, Opening Range Gaps :
Works seamlessly on both CFDs and Futures for Nasdaq.
Captures the exact 16:14 close (the CFD session end) and the true 09:30 open using M1 data aggregation, even if you’re on a higher timeframe.
Works reliably on any intraday timeframe — not just the 1-minute chart, but all the way up to the timeframe you set in the Timeframe Limit (default: 30m).
⚙️ Features:
Gap Detection with Precision
Uses the close of the 16:14 bar (last CFD session minute) as the reference.
Captures the specific open at 09:30 (not approximated by session).
Plots the gap as a shaded box with customizable colors.
Quarter Levels Inside the Gap
Automatically divides the gap into 25%, 50%, and 75% levels for precision trading.
Customization
Show/hide vertical session delimitations.
Choose whether to track the reference price throughout the session.
Extend boxes to the right for context.
Keep only the last “n” gaps on your chart (default: 10).
Works Across Timeframes
Thanks to request.security_lower_tf, all logic is based on 1-minute data, so even if you’re on 5m, 15m, or 30m, the gap will always plot with exact levels.
🧭 Use Cases
Spot the true overnight gap between CFD close (16:14) and futures open (09:30).
Track how Nasdaq fills (or fails to fill) gaps during the day.
Use quarter levels for partial fills, rejection points, or continuation setups.
Combine with ICT concepts or price action strategies to identify liquidity-driven moves.

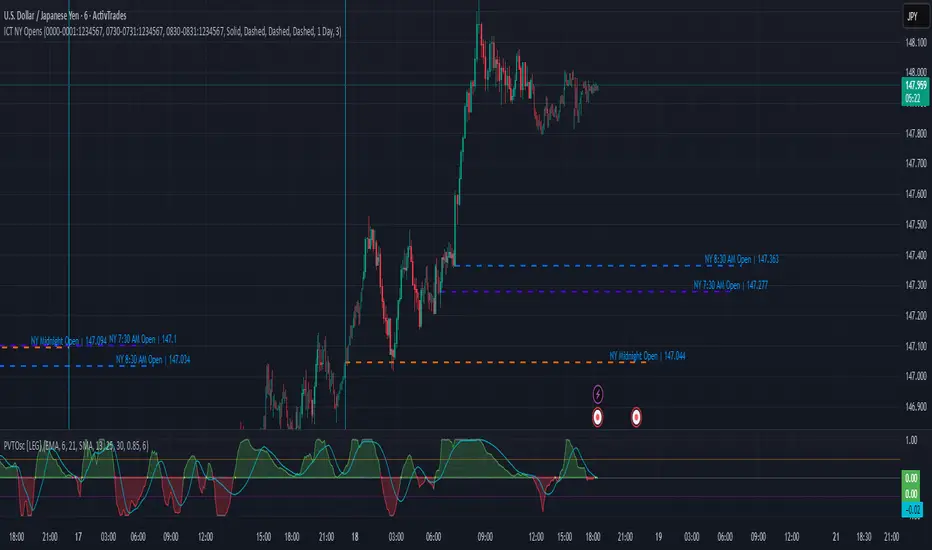
ICT NY Opens (Midnight, 7:30 & 8:30) True📌 ICT NY Opens Fixed (Midnight, 7:30 & 8:30) TRUE
This indicator is designed for traders following ICT (Inner Circle Trader) concepts and provides precise reference levels for the most relevant New York session opens. It automatically captures and plots the opening price for Midnight (00:00 NY), 7:30 AM, and 8:30 AM (configurable), letting you use them as liquidity anchors, manipulation zones, or institutional reference points.
🔑 Key Features
Fixed New York Opens (configurable)
Midnight (00:00 NY), 7:30 AM (NY), 8:30 AM (NY) — each open is captured from the first bar of the configured session.
Sessions are editable: the indicator exposes input.session fields for each open, so you can change the exact hour/minute (e.g., set 00:00 → 23:30 or 08:30 → 08:00). The lines and levels will follow the chosen session times.
Extension & Custom Hours (explicit)
Preset extensions: 1 Day or 2 Days (the horizontal line spans that period).
Directional extension: Right (extend to the right) or Both (left & right).
Custom Hours option: enable a custom-hours toggle and enter a specific number of hours (1–23). When enabled, horizontal lines extend for the exact number of hours you enter instead of the preset day lengths.
Labels are positioned relative to the extension setting (anchored at the open or after the extension depending on the selected mode).
Customizable visuals
Show/hide each open individually.
Independent color and line-style (solid / dotted / dashed) for each open.
Separate text color for labels.
Automatic Labels & Vertical Line
Each drawn level includes an automatic label with the open name and the exact opening price.
A dedicated vertical line option exists for the Midnight open (visual daily separator).
⚙️ How it behaves (precision & workflow)
The script detects the first bar inside the session you configure and records that bar's open as the session Open price.
If you change the session string/time in settings, the indicator will use the new time going forward and draw the corresponding level at that session's opening bar.
Extensions respect either the preset days or the custom hours you specify, so you can make lines last a precise number of hours (useful for intraday setups).
🧭 Use Cases
Pinpoint liquidity clusters and anticipate stop hunts near session opens.
Use as range anchors to measure intraday deviations.
Monitor reactions around economic releases and futures opens (7:30 / 8:30).
Integrate into ICT-based scalping or swing setups where precise session timing matters.
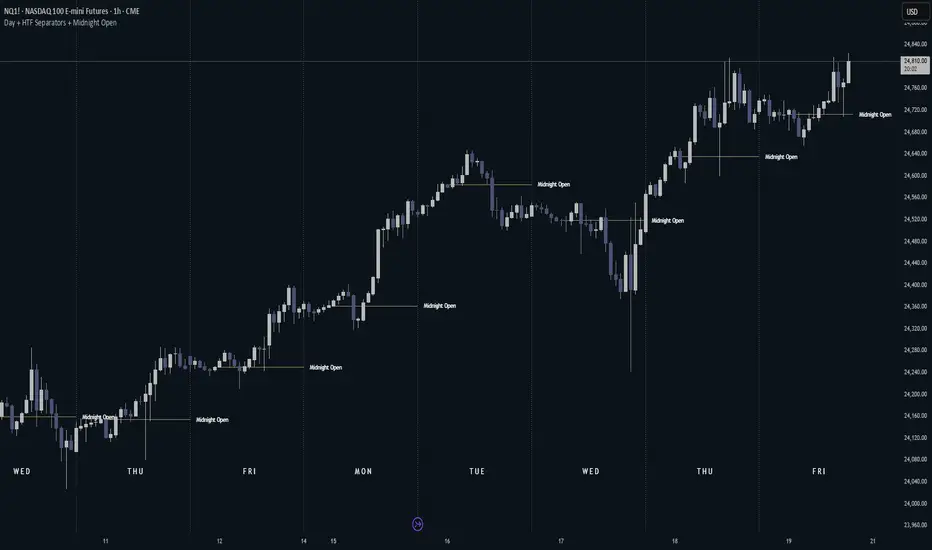
Day + HTF Separators + Midnight OpenOverview
The Day + HTF Separators + Midnight Open indicator is a versatile and easy-to-use tool for traders who want to track key price levels and time-based market events. It draws vertical lines to mark the start of each day, 4-hour period, and 1-hour period, adds labels to show the day of the week, and plots a horizontal line at a customizable hourly open price (defaulting to midnight, referred to as the "Time-Designated Open" or TDO). This indicator is perfect for day traders, swing traders, and anyone analyzing price action in Futures, forex, cryptocurrencies, or other markets on TradingView.
Designed for intraday charts (e.g., 1-minute, 5-minute, or 1-hour), this indicator offers extensive customization options, letting you toggle features, change colors, adjust line styles, and position labels. It’s built to be lightweight, ensuring smooth performance even on charts with lots of historical data.
Key Features
1. Daily Separators
What It Does: Draws a vertical line at the start of each new trading day to help you see daily boundaries clearly.
How It Works:
Places a vertical line at the beginning of each day, spanning the full price range of the opening moment.
Lines extend across the chart, making it easy to spot daily transitions.
Keeps up to 300 past daily lines visible, automatically managing older ones to stay within TradingView’s limits.
Customization:
Show/Hide: Always shown on intraday charts but tied to the "Show Days of Week Labels" setting for consistency.
Color: Choose any color (default: a medium gray).
Style: Pick Solid, Dashed, or Dotted lines (default: Dotted).
Why Use It: Helps you track daily price ranges, identify daily open/close levels, and plan trades around daily market cycles.
2. Day of the Week Labels
What It Does: Displays the day of the week (e.g., "MON" for Monday) at a specific hour each day, making it easy to know which day you’re analyzing.
How It Works:
Shows labels like "MON", "TUE", "WED", "THU", "FRI", "SAT", or "SUN" at the bottom of the chart.
Labels appear at a user-chosen hour (default: 5:00 AM) each day.
Only works on intraday charts (e.g., 5-minute or 1-hour).
Customization:
Show/Hide: Turn on/off with "Show Days of Week Labels" (default: on).
Color: Set the label text color (default: dark gray).
Hour: Choose any hour from 0:00 to 23:00 for label placement (default: 5:00 AM).
Why Use It: Great for traders who need to track specific days for events like economic releases or to spot weekly patterns in price action.
3. 4-Hour Separators
What It Does: Marks the start of each 4-hour period with a vertical line, ideal for aligning with higher timeframe trends.
How It Works:
Draws vertical lines every 4 hours, covering the price range of the starting moment.
Lines extend across the chart for clear visibility.
Stores up to 100 past 4-hour lines, reusing older ones for efficiency.
Customization:
Show/Hide: Enable/disable with "Show 4H Separator" (default: off).
Color: Choose any color (default: gray, slightly transparent).
Style: Select Solid, Dashed, or Dotted lines (default: Dotted).
Why Use It: Perfect for swing traders or those combining intraday trading with 4-hour chart analysis, such as identifying key support or resistance levels.
4. 1-Hour Separators
What It Does: Draws vertical lines to mark the start of each hour, helping short-term traders track hourly price movements.
How It Works:
Places a vertical line at the start of each hour, spanning the price range.
Lines extend across the chart and support up to 100 historical lines.
Customization:
Show/Hide: Enable/disable with "Show 1H Separator" (default: off).
Color: Pick any color (default: a light gray, slightly transparent).
Style: Choose Solid, Dashed, or Dotted lines (default: Dotted).
Why Use It: Ideal for scalpers or day traders focusing on hourly trends, session changes, or short-term price action.
5. Time-Designated Open (TDO) Lines
What It Does: Plots a horizontal line at the opening price of a chosen hour (default: midnight, 00:00) each day, with an optional label to mark the price level, helping you track key price points across multiple days.
How It Works:
Draws a horizontal line at the open price of the selected hour (e.g., midnight) in your chosen timezone (default: New York time).
Lines start at the chosen hour and extend to the current moment on the chart (or a few bars beyond, based on settings) or until 5:00 PM New York time (market close for Futures).
Supports up to 100 past TDO lines, keeping historical opens visible for comparison.
Adds a label (e.g., "TDO") at the end or start of the line, which is invisible by default due to full transparency.
Lines and labels only appear if both the main toggle and TDO-specific toggle are enabled.
Customization:
Show/Hide Line and Label: Turn on/off with "Enable Candle Open Line/Label" and the TDO-specific toggle (both default: on).
Show/Hide Label: Enable/disable the label separately with "Enable Candle Open Label" (default: on).
Hour: Select any hour from 00:00 to 23:00 (default: 00:00).
Label Text: Customize the label name (default: "TDO").
Line Color: Choose any color (default: light cyan).
Line Style: Pick Solid, Dashed, or Dotted (default: Solid).
Label Text Color: Set the label text color (default: gray, fully transparent).
Label Background Color: Choose the label background color (default: black).
Label Transparency: Adjust transparency for both label text and background (default: fully transparent, invisible).
Label Size: Select Tiny, Small, Normal, or Large (default: Small).
Label Position: Place the label at the right or left of the line with "Stick Label to Right" (default: right) and adjust spacing with "Label Padding" (default: 1 bar).
Line Length: Shorten the left side with "Enable Left-Side Trimming" (default: off) and set the trim length with "Left Trim Bars" (default: 8 bars). Extend the right side with "Line Padding" (default: 2 bars).
Timezone: Choose from New York, UTC, London, Paris, Tokyo, Shanghai, Singapore, or Sydney (default: New York).
Max History: Set how many past TDO lines to show (default: 100).
Multi-Day Plotting:
Plots a TDO line for the chosen hour (e.g., 00:00) each day, based on historical data.
Each line starts at the open price of that hour and extends to the current moment or 5:00 PM New York time (for Futures).
Past TDO lines stay visible, letting you compare daily open prices over time (up to 100 days, adjustable).
How to Use
Add to Your Chart:
Add the indicator to an intraday chart (e.g., 1-minute, 5-minute, or 1-hour) for any market (Futures, forex, crypto, etc.).
It works best on intraday timeframes to show all features.
Customize Settings:
Open the settings panel in TradingView.
Turn on/off features like daily separators, DOW labels, 1-hour/4-hour separators, or TDO lines.
Adjust colors, line styles, and label positions to fit your chart’s look.
Set the TDO hour (e.g., 00:00 for midnight or 03:00 for London open) and timezone to match your market.
Make TDO labels visible by reducing "Label Transparency" or changing "Label Text Color" to an opaque color.
Analyze the Chart:
Use daily separators to spot daily price ranges and key levels.
Check DOW labels to track specific days for trading events or weekly trends.
Use 1-hour/4-hour separators to align with short-term or higher timeframe strategies.
Monitor TDO lines to identify key opening price levels across days, useful for support/resistance or breakout trading.
Test and Adjust:
Toggle the main TDO switch or specific TDO toggle to hide/show the TDO line.
Reduce "Label Transparency" to 0 or change "Label Text Color" to make TDO labels visible.
Performance: The indicator is optimized to handle up to 300 daily lines, 100 4-hour lines, 100 1-hour lines, and 100 TDO lines, ensuring it runs smoothly on long charts.
Markets: Best for intraday charts. The 5:00 PM New York close is designed for futures; switch to UTC for forex or crypto.
Labels: TDO labels are invisible by default (fully transparent). Adjust "Label Transparency" or "Label Text Color" to make them visible.
Time Context: As of September 17, 2025, 6:08 PM EDT, TDO lines on stock charts stop updating at 5:00 PM New York time. Use historical data or change the timezone for continuous markets.
Limitations
Only works on intraday charts (e.g., 1-minute to 1-hour).
TDO lines stop at 5:00 PM New York time for Futures; adjust the timezone for 24/7 markets.
TDO labels are hidden by default (fully transparent); change transparency or color to see them.
Limited to 500 total lines and labels due to TradingView’s restrictions, managed automatically.
Feedback
If something isn’t working (e.g., missing lines or labels), please share:
The market and timeframe (e.g., EUR/USD, 5-minute).
Your settings (e.g., TDO hour, timezone, transparency).
A description or screenshot of the issue. This indicator is designed to make your trading easier with clear visuals for time-based analysis. Happy trading!
ICT Institutional Order Flow (Riz)This indicator implements Inner Circle Trader (ICT) institutional order flow concepts to identify high-probability entry points where smart money is actively participating in the market. It combines volume analysis, market structure, and price action patterns to detect institutional accumulation and distribution zones.
Core Concepts & Methodology
1. Institutional Order Blocks Detection
Order blocks represent the last opposing candle before a strong directional move, indicating institutional accumulation (bullish) or distribution (bearish) zones.
How it works:
⦁ Identifies the final bearish candle before bullish expansion (accumulation)
⦁ Identifies the final bullish candle before bearish expansion (distribution)
⦁ Validates with volume spike (2x average) to confirm institutional participation
⦁ Requires minimum 0.5% price displacement to filter weak moves
⦁ Tracks these zones as future support/resistance levels
2. Fair Value Gap (FVG) Analysis
FVGs are price inefficiencies created by aggressive institutional orders that leave gaps in price action.
Detection method:
⦁ Bullish FVG: When current low > high from 2 bars ago
⦁ Bearish FVG: When current high < low from 2 bars ago
⦁ Minimum gap size filter (0.1% default) eliminates noise
⦁ Monitors gap fills with volume for entry signals
⦁ Gaps act as magnets drawing price back for "rebalancing"
3. Liquidity Hunt Detection
Institutions often trigger retail stop losses before reversing direction, creating liquidity for their positions.
Algorithm:
⦁ Calculates rolling 20-period highs/lows as liquidity pools
⦁ Detects wicks beyond these levels (0.1% sensitivity)
⦁ Identifies rejection back inside range (liquidity grab)
⦁ Volume spike confirmation ensures institutional involvement
⦁ These reversals often mark significant turning points
4. Volume Profile Integration
Analyzes volume distribution across price levels to identify institutional interest zones.
Components:
⦁ Point of Control (POC): Price level with highest volume (institutional consensus)
⦁ Value Area: 70% of volume range (institutional comfort zone)
⦁ Uses 50-bar lookback to build volume histogram
⦁ 20 price levels for granular distribution analysis
5. Market Structure Analysis
Determines overall trend bias using pivot points and swing analysis.
Process:
⦁ Identifies swing highs/lows using 3-bar pivots
⦁ Bullish structure: Price above last swing high
⦁ Bearish structure: Price below last swing high
⦁ Filters signals to trade with institutional direction
Signal Generation Logic
BUY signals trigger when ANY condition is met:
1. Order Block Formation: Bearish-to-bullish transition + volume spike + strong move
2. Liquidity Grab Reversal: Sweep below lows + recovery + volume spike
3. FVG Fill: Price fills bullish gap with institutional volume (within 3 bars)
4. Order Block Respect: Price bounces from previous bullish OB + volume
SELL signals trigger when ANY condition is met:
1. Order Block Formation: Bullish-to-bearish transition + volume spike + strong move
2. Liquidity Grab Reversal: Sweep above highs + rejection + volume spike
3. FVG Fill: Price fills bearish gap with institutional volume (within 3 bars)
4. Order Block Respect: Price rejects from previous bearish OB + volume
Additional filters:
⦁ Signals align with market structure (no counter-trend trades)
⦁ No new signals while position is active
⦁ All signals require volume confirmation (institutional fingerprint)
Trading Style Auto-Configuration
The indicator features intelligent preset configurations for different trading styles:
Scalping Mode (1-5 min charts):
⦁ Volume multiplier: 1.5x (more signals)
⦁ Tighter parameters for quick trades
⦁ Risk:Reward 1.5:1, ATR multiplier 1.0
Day Trading Mode (15-30 min charts):
⦁ Volume multiplier: 1.7x (balanced)
⦁ Medium sensitivity settings
⦁ Risk:Reward 2:1, ATR multiplier 1.5
Swing Trading Mode (1H-4H charts):
⦁ Volume multiplier: 2.0x (quality focus)
⦁ Conservative parameters
⦁ Risk:Reward 3:1, ATR multiplier 2.0
Custom Mode:
⦁ Full manual control of all parameters
Visual Components
⦁ Order Blocks: Colored rectangles (green=bullish, red=bearish)
⦁ Fair Value Gaps: Orange boxes showing imbalances
⦁ Liquidity Levels: Dashed blue lines at key highs/lows
⦁ Volume Spikes: Yellow background highlighting
⦁ POC Line: Orange line showing highest volume price
⦁ Value Area: Blue shaded zone of 70% volume
⦁ Buy/Sell Signals: Triangle markers with text labels
⦁ Stop Loss/Take Profit: Dotted lines (red/green)
Information Panel
Real-time dashboard displaying:
⦁ Current trading mode
⦁ Volume ratio (current vs average)
⦁ Market structure (bullish/bearish)
⦁ Active order blocks count
⦁ Position status
⦁ Configuration details
How to Use
Step 1: Select Trading Style
Choose your style in settings - all parameters auto-adjust
Step 2: Timeframe Selection
⦁ Scalping: 1-5 minute charts
⦁ Day Trading: 15-30 minute charts
⦁ Swing: 1H-4H charts
Step 3: Signal Interpretation
⦁ Wait for BUY/SELL markers
⦁ Check volume ratio >2 for strong signals
⦁ Verify market structure alignment
⦁ Note automatic SL/TP levels
Step 4: Risk Management
⦁ Default 2:1 risk:reward (adjustable)
⦁ Stop loss: 1.5x ATR from entry
⦁ Position sizing based on stop distance
Best Practices
1. Higher probability setups occur when multiple conditions align
2. Volume confirmation is crucial - avoid signals without volume spikes
3. Trade with structure - longs in bullish, shorts in bearish structure
4. Monitor POC - acts as dynamic support/resistance
5. Confluence zones where OBs, FVGs, and liquidity levels overlap are strongest
Important Notes
⦁ Not a standalone system - combine with your analysis
⦁ Works best in trending markets with clear structure
⦁ Adjust settings based on instrument volatility
⦁ Backtest thoroughly on your specific markets
⦁ Past performance doesn't guarantee future results
Alerts Available
⦁ ICT Buy Signal
⦁ ICT Sell Signal
⦁ Volume Spike Detection
⦁ Liquidity Grab Detection
This indicator provides a systematic approach to ICT concepts, helping traders identify where institutions are entering positions through volume analysis and key price action patterns. The auto-configuration feature ensures optimal settings for your trading style without manual adjustment.
Disclaimer
This tool is for educational and research purposes only. It is not financial advice, nor does it guarantee profitability. All trading involves risk, and users should test thoroughly before applying live.

CISD SDICT CISD SD – Manipulation Swing Standard Deviations for Change in State of Delivery
Overview:
The ICT CISD SD indicator is a professional ICT tool designed to define the Manipulation Swing and automatically plot its Standard Deviation levels. Focused on intraday ICT analysis, this script dynamically updates toward the current bar, giving traders precise visual guidance on key swing levels and projected targets.
Key Features:
Define ICT Manipulation Swing:
Set the start and end time to define the Manipulation Swing.
Choose your timezone for accurate ICT intraday tracking.
Automatically calculates the High, Low, and optional Equilibrium (EQ) level of the Manipulation Swing.
Dynamic ICT Manipulation Lines:
Plots High, Low, and optional EQ lines of the Manipulation Swing.
Lines update dynamically with each new bar.
Fully customizable line color, style (solid, dashed, dotted), and width.
Labels feature configurable text color, background color, transparency, size, and placement.
Optional left-side trimming keeps charts clean and readable.
Manipulation Swing Standard Deviation Levels:
Automatically plots Standard Deviation levels as multipliers of the Manipulation Swing range (0.5x to 4.5x by default).
Levels can be plotted up from the swing low or down from the swing high, giving probabilistic target areas or key support/resistance zones.
Customizable line and label styling for all Standard Deviation levels, including color, transparency, width, style, and size.
Optional Shading for Visual Clarity:
Shade areas between the Manipulation Swing and a chosen Standard Deviation level for easy visualization.
Customizable shading color and opacity.
Professional ICT Usability:
Designed for clarity and minimal chart clutter.
Stick labels to the right of the current bar for maximum readability.
Dynamically adjusts with new bars, keeping all Manipulation Swing lines and Standard Deviation levels up-to-date.
Ideal For:
ICT intraday traders analyzing Manipulation Swings for Change in State of Delivery.
Traders seeking visual Standard Deviation levels for breakout, reversal, or continuation strategies.
Analysts who want clean, professional charts with full control over Manipulation Swing and Standard Deviation visualization.
How It Works:
User defines the ICT Manipulation Swing time to identify the swing.
The script calculates the High, Low, and optional EQ of the swing.
Swing lines are drawn and dynamically updated.
Standard Deviation levels are plotted based on user-defined multipliers.
Optional shading can highlight areas from the Manipulation Swing to selected Standard Deviation levels.
Customization Options Include:
ICT Manipulation Swing time and timezone.
Line and label styling for Manipulation Swing and Standard Deviation levels.
Left-side trimming to reduce chart clutter.
Enable/disable EQ line, Standard Deviation levels, and shading.
Direction of Standard Deviation levels (up from low or down from high).
Multipliers and shading transparency for professional ICT charting.
Conclusion:
The ICT CISD StdDev indicator offers a complete, professional solution for ICT intraday analysis, allowing traders to define the Manipulation Swing and visualize its Standard Deviation levels dynamically, enhancing precision and clarity in real-time trading.

Cozys Black Van CandlesDescription:
Cozys Black Van Candles is a versatile, fully customizable overlay indicator designed to visually highlight multiple key candle structures on your chart. It allows traders to track precise OHLC levels and midpoints for a series of user-defined candles, offering a clear visual representation of market action. The indicator is optimized for clarity, flexibility, and session-based analysis.
This indicator is inspired by the unique trading methodology of ᴵᶜᵗ 👑 Cøzy🦁Bæb¹⁷ 💚. It is designed to visually represent multiple candle bodies along with their open, high, low, and close (OHLC) levels, allowing traders to monitor key price zones and session dynamics. The tool also features a settlement-level overlay, which dynamically extends throughout the session, providing a clear reference for decision-making. With customizable colors, line styles, and label settings, this indicator offers flexibility for both analysis and chart readability, making it suitable for professional traders seeking precise visual cues and enhanced market awareness.
Key Features:
Multiple Candle Visualization: Plot multiple custom candles on your chart with independent toggles for each, allowing full control over which candles are displayed.
OHLC & Midpoint Levels: Each candle displays its Open, High, Low, Close, and Midpoint levels using dedicated lines for accurate reference.
Dynamic Boxes & Lines: Candle ranges are highlighted with semi-transparent boxes and lines that expand in real-time, providing clear visualization of active sessions and historical candle structure.
Session Expansion: Candle boxes and lines automatically extend throughout the session until a defined cutoff, ensuring continuous visual tracking of each candle’s range.
Customizable Styles & Colors: Users can fully customize the colors, line styles (solid, dotted, dashed), and widths of all OHLC lines, midpoints, and candle boxes for maximum chart readability.
Labeling: Each candle can be labeled at its midpoint with customizable text, background, and size, providing instant identification without cluttering the chart.
Independent PD-Like Settlement Candle: The indicator supports a special, session-based candle with fully independent OHLC and midpoint plotting, including dynamic expansion and labeling, without affecting main candle plots.
Timezone Support: All candles and session-based calculations respect a user-defined timezone, ensuring accurate plotting across different markets and trading sessions.
Replay & Real-Time Compatible: All plotted boxes, lines, and labels expand correctly in both real-time and replay mode, providing reliable historical analysis and session review.
Performance Optimized: Designed with efficient use of Pine Script objects to avoid conflicts and maximize chart responsiveness.
Flexible Session Reset: Main candles and session-based candles can reset automatically at the start of a new trading session for a clean chart display.
Use Cases:
Visualize key intraday candles for reference in scalping or day trading strategies.
Track precise OHLC and midpoint levels for multiple candles simultaneously.
Overlay session-based structures without interfering with price action.
Enhance chart readability with labeled candle ranges and dynamic boxes.
Highlights:
Plot multiple candles simultaneously with independent toggles.
Track precise OHLC and midpoint levels at a glance.
Dynamic boxes and lines expand through the session automatically.
Fully customizable colors, line styles, widths, and labels.
Session-based candle plotting without affecting main candles.
Works in real-time and replay mode.
Timezone-aware for accurate market session tracking.
Perfect for day traders, scalpers, and anyone who wants a clean, visual overview of intraday candle action!

ICT Entry Models (Riz)The ICT Entry Models Indicator is a complete framework built to help traders visualize and apply multiple Institutional concepts on a single chart. Instead of relying on one entry technique, this tool combines 14+ ICT entry models and evaluates them under a unified structure. Each model is detected independently but filtered through a multi-factor confluence engine that considers liquidity, higher-timeframe structure, premium/discount zones, and session context. This ensures only high-probability setups are highlighted.
What This Indicator Does
⦁ Detects and plots ICT-based entry models such as: Fair Value Gaps, Order Blocks, Breakers, Liquidity Grabs, Stop Hunts, Asian Range Breakouts, Silver Bullet setups, Power of Three, Judas Swing, Unicorn model, Market Maker models, Previous Day High/Low breaks, and others.
⦁ Automatically validates entries using higher timeframe confirmation and confluence filters.
⦁ Provides risk management tools with structural stop-loss, ATR-based SL, TP1/TP2 targets, and R:R calculations.
⦁ Displays visual trade labels showing direction, strength, and expected risk/reward.
⦁ Includes a performance dashboard that tracks win rates, session stats, and risk outcomes.
How It Works
Each entry model is activated through custom detection logic. The script checks for key conditions like displacement, imbalance, BOS/CHoCH, liquidity sweeps, and premium/discount zones. When multiple models align, the indicator assigns a signal strength rating.
⦁ Weak setups: Highlighted but marked lower confidence.
⦁ Strong setups: Require confluence of liquidity, structure, and time-based filters (e.g., killzones).
⦁ The indicator then calculates a safe stop-loss placement (always on the correct side of price) and take-profit levels based on Goldbach ratios and volatility expansion.
Inputs
⦁ Model Toggles: Enable/disable individual entry models (e.g., FVG only, OB only, or full confluence).
⦁ Confluence Filters: Higher-timeframe structure, premium/discount zones, volatility thresholds.
⦁ Risk Management Settings: ATR multiplier, fixed SL/TP options, R:R target adjustments.
⦁ Dashboard & Visuals: Choose which stats, labels, and levels appear on chart.
How to Use
1. Apply the indicator to any forex, crypto, or index chart.
2. Select your timeframe. For scalping, use 1–5m with HTF confirmation. For day/swing trades, use 15m–1H with HTF overlays.
3. Toggle your preferred entry models (e.g., FVG + Liquidity Sweep) or enable all for confluence.
4. Watch for strong confluence signals: entry marker + calculated SL/TP + dashboard confirmation.
5. Use the signals as decision support not as automated buy/sell triggers.
Notes & Tips
Best used in liquid markets (Majors, Gold, Indices, BTC/ETH).
HTF confirmation greatly improves accuracy e.g., align 1m entries with 15m structure.
Combining time-based models (Silver Bullet, Killzones) with structural models improves precision.
Disclaimer
This tool is for educational and research purposes only. It is not financial advice, nor does it guarantee profitability. All trading involves risk, and users should test thoroughly before applying live.

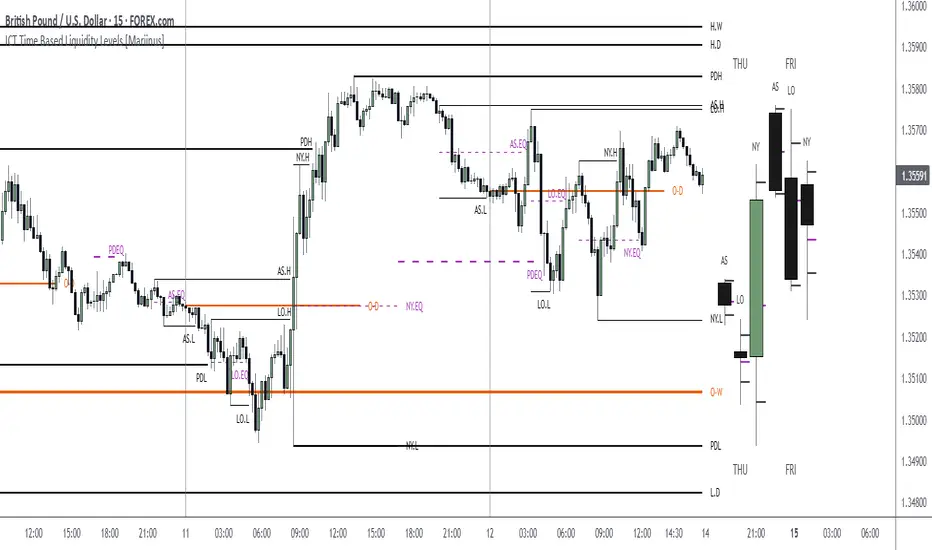
ICT Time Based Liquidity Levels [Mariinus]Indicator Overview – Inspired by ICT Concepts
This indicator helps you spot where liquidity rests and where major price moves are likely to begin or end — giving you clarity for both entries and exits.
Inspired by the teachings of the Inner Circle Trader (ICT), this tool builds on his philosophies and principles that have reshaped how traders view price action. One of the most powerful lessons that stuck with me personally is his quote:
"Time & Price, where it is Time first and then Price”
Another fundamental concept that underpins this tool is the idea that:
"Price is constantly moving in cycles from Premium to Equilibrium, from Equilibrium to Discount from Discount back to Premium."
With these core ideas in mind, this indicator was developed to help traders who are already using an ICT-based framework and focus on Kill Zones and by this on Time Based Liquidity.
In addition to plotting Session Highs and Lows on your chart, the ICT Time Based Liquidity Levels indicator also includes derived levels that provide deeper market insight. These include the Equilibrium of the full Session Range (High to Low) as well as the Equilibrium of the Wicks – offering a more nuanced view of price balance and potential turning points, in line with ICT’s core concepts.
To make sure your chart is not cluttered with lines, you can select which levels to show – and more importantly – you can plot Session Candles next to your Chart. Unlike standard time-based candles (e.g. 4H candles), these are “true” Session Candles that reflect the actual OHLC of trading Sessions, making it easier and clearer to see how Sessions interact with each other.
Next to Intraday Highs and Lows, the indicator will also plot Daily and Weekly Liquidity Pools above and below the Market, giving you insights to where Price is most likely heading towards.
You can set Alerts that trigger whenever one of these key levels is tagged, so you stay focused without staring at the screen all day.
⚠️ Important Disclaimer:
This is not a standalone trading plan.
This is not a buy or sell signal generator.
Instead, this tool is designed to support traders who follow ICT principles by helping them identify higher-probability PD Arrays – the key levels where setups are more likely to occur. If your trading plan includes looking for specific PD Arrays and structural frameworks taught by ICT, then this indicator is a visual aid to refine and focus your attention on the areas where your framework has a higher probability of playing out.
⚙️ Explanation of the Settings
You can combine up to 6 Sessions to monitor their respective levels while operating on a lower timeframe. You can define the timings and a long and short naming of those Sessions.
In the Days Section you can Set a lookback period to control how far back you want to calculate levels. Next to that you can select which Daily and or Weekly Levels you want to have shown on your Charts together with choosing their coloring, style and width.
In the Candles Section you can define how the Session Candles will look like which are plotted next to your Chart. When you have multiple Days of Session Candles it can come in handy to mirror image the Candles which will plot the Candles from right to left instead of the default left to right. In addition you can control how far the distance is between the Candles and your chart, the distance between Candles and Days and the thickness of those Candles. Next you can show or hide the Equilibrium of the total Session Range and the Equilibrium of the Wicks.
In the Lines Section you can specify which Session Levels you want to see on your Chart together with choosing their coloring, style and width.
In the Labels Section you can specify which Labels you want to show and how you want to show them.
In the Openings Section you can specify to show the Midnight Open and or Weekly Open. In addition you can add a divider to be able to distinguish between multiple Days or Weeks.
In the Alert Section you can specify for which Sessions you want to get notified when Key Levels are tagged. After setting this up, you need to set an alert via the Tradingview Alert function to really activate the Alert Function. Be aware that when you change your Alert setup, you need to setup the Tradingview Alert function again.
💡 Example Use Cases
These examples are for educational purposes only. This tool is not financial advice and should always be used in conjunction with your own trading plan—whether it involves Fair Value Gaps, Order Blocks, or a custom combination of ICT-based elements.
Killzones SMT + IFVG detectorKillzones SMT + IFVG Detector
Summary
This strategy implements a specific intraday workflow inspired by ICT-style concepts.
It combines:
Killzone session levels (recording untouched highs/lows)
SMT divergence between NQ and ES (exclusive sweep logic)
IFVG confirmation (3-bar imbalance + width filter + inversion guard)
and an optional smart exit engine
The components are not simply mashed together: they interact in sequence.
A setup only confirms if all conditions line up (time window → untouched level sweep → divergence → valid IFVG → confirmation candle → risk filter).
Workflow
Killzones & session levels
Tracks highs/lows inside default killzones (19:00–23:00, 01:00–04:00, 08:30–10:00, 11:00–12:00, 12:30–15:00, chart timezone).
Stores untouched levels forward; sweeps trigger candidate signals.
SMT divergence (exclusive sweep)
Bullish SMT : one index sweeps its low while the other remains above its session low.
Bearish SMT : one index sweeps its high while the other remains below its session high.
Detection supports “Sweep (Cross)” or “Exact Tick.”
Session IDs are tracked so once a side has fired, later re-touches can’t re-trigger .
IFVG confirmation
Locks the first valid 3-bar IFVG after SMT.
Confirmation requires a candle close beyond the IFVG boundary in the direction of the close.
IFVGs must meet a minimum width filter (default 1.0 point).
Inversion guard: ignores IFVGs already inverted before SMT.
Optional “re-lock” keeps tracking the latest IFVG until confirmation/expiry.
Smart exit engine
Initial stop from opposite wick (+ buffer).
Fixed TP (default 40 points).
Dynamic stop escalation at progress thresholds (BE → 50% → 80% of target).
Safety gates
Weekend lockout (Fri 16:40 → Sun 18:00).
Same-bar sweep of high & low cancels setups.
Max initial stop filter skips oversized setups.
Optional cooldown bars.
Alerts
SMT Bullish/Bearish : divergence detected this bar.
Confirm Long/Short : IFVG confirmation triggered.
Default Strategy Properties (used in screenshots/backtests)
Initial capital: $25,000
Order size: 1 contract
Commission: $1.25 per contract per side
Slippage: 2 ticks
Backtest window: Jun 16, 2025 – Sep 14, 2025
These settings are intentionally conservative. If you change them, your results will differ.
How to use
Apply on an NQ or ES futures chart (1–5 min).
Choose your killzones and detection mode.
Select confirmation symbol (NQ, ES, or “Sweeper”).
Enable/disable IFVG re-lock.
Review signals and use alerts for automation if desired.
Limitations
Strict filters reduce trade count; extend backtest window for more samples.
Works best on NQ/ES; not validated elsewhere.
Past performance is not indicative of future results.
This is an educational tool ; not financial advice.

NX - ICT PD ArraysThis Pine Script indicator identifies and visualizes Fair Value Gaps (FVGs) and Order Blocks (OBs) based on refined price action logic.
FVGs are highlighted when price leaves an imbalance between candles, while Order Blocks are detected using ICT methodology—marking the last opposing candle before a displacement move.
The script dynamically tracks and updates these zones, halting box extension once price interacts with them. Customizable colors and lookback settings allow traders to tailor the display to their strategy.

NX - ICT LiquidityThis indicator identifies liquidity zones based on ICT concepts, highlighting swing highs (BSL) and swing lows (SSL) with dynamic detection and mitigation logic. It also plots key institutional levels from the previous day, week, and month—including High, Low, Open, and Close—customizable by timeframe.
Designed for precision and clarity, it helps traders visualize potential sweep setups and reaction points with minimal chart clutter.

NX - ICT Kill ZonesThis indicator highlights the three main ICT Kill Zones — Asian, London, and New York — directly on your chart using New York time (UTC‑4 with automatic DST adjustment).
Each zone is color‑coded for quick visual reference and only appears on intraday timeframes of 1 hour or less. The tool helps traders quickly identify high‑probability trading windows aligned with institutional market activity.

ICT Fair Value Gap (FVG) DetectorFair Value Gap (FVG) Indicator
Purpose: Highlights price gaps between three consecutive candles, which signal areas of imbalance that may later act as support or resistance.
How It Works: The script looks for a gap between the high of two bars ago and the low of the current bar (bullish FVG) or the low of two bars ago and the high of the current bar (bearish FVG).
Visuals: These gaps are marked as transparent boxes on the chart, extended to the right until they are "filled" or mitigated by price returning into the gap.
Customization: You can adjust which gaps show, their colors, thresholds, and other display options.

ICT Fractal HTF Candles [TFR]ICT HTF Fractal Candles
This indicator overlays higher timeframe (HTF) candles directly on your current chart for better multi-timeframe analysis. It plots up to the last 4 candles from a user-selected timeframe (5m, 15m, 1h, 4h, or 1D) with customizable body and border colors.
Features:
Displays the last 4 higher timeframe candles (open, high, low, close) on your current chart.
Customizable bullish, bearish, and inside close candle colors.
Optional midpoint wick lines (top and bottom) for precision reference, with extendable length for clarity.
Optional candle midpoint line for additional confluence.
Overlay mode allows you to see HTF structure without switching chart timeframes.
Timeframe label display so you always know which HTF is being plotted.
Offset control for shifting candle position.
Use Case:
This tool helps traders apply ICT concepts like PO3, midpoint reference levels, and multi-timeframe confirmation without constantly switching between charts. It’s particularly useful for identifying liquidity zones, midpoint reactions, and higher timeframe market structure while executing on a lower timeframe.
ICT Daily+Weekly BiasPrevious Day & Week Levels — Daily+Weekly Bias Visualizer
Plots previous-day (PDH/PDL/PDEQ) and previous-week (PWH/PWL) reference levels.
Use them to frame bias and identify the Draw on Liquidty.
Definitions
• PDH/PDL: Prior day high/low.
• PDEQ: Prior day equilibrium = (PDH + PDL) / 2.
• PWH/PWL: Prior week high/low.
Features
• PDH/PDL lines with optional labels at left or right edge.
• PDEQ line (0.5 of PD Range) with optional label.
• PWH/PWL lines with optional labels.
• Custom colors, styles, and width controls.
• Optional Price Labels
• Timeframe visibility limit.
• Lines extend and stop on mitigation (when breached).
*Also included in ICT ULT (All In One) Indicator
*Feel free to suggest improvement in the comments
ICT NDOG/NWOGICT NDOG / NWOG — Opening Gap Visualizer
Plots daily (NDOG) and weekly (NWOG) opening gaps.
An opening gap is the price range between the previous close and the new session’s open.
Features:
• Optional border lines at gap high/low.
• Optional Consequent Encroachment line (50%).
• Optional Quadrant lines (25% and 75%).
• Color customization
• Custom NDOG and NWOG amount (separated)
*Also included in ICT ULT (All In One) Indicator
*Feel free to suggest improvement in the comments
