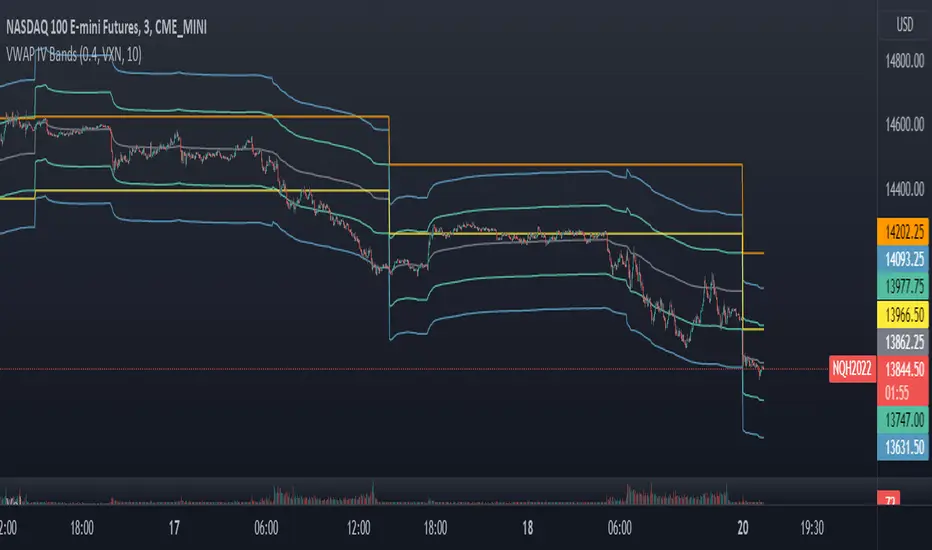
VWAP Implied Volatility BandsThis script takes the built in VWAP function and creates bands using various Volatility Indexes from the CBOE. The script plots the bands at desired multiples, as well as the closing value of the prior day's first set of bands. Users can choose from the following:
VIX(ES), VXN(NQ), RVX(RTY), OVX(CL), GVX(GC), SIV(ZS), CIV(ZC), TYVIX(ZN), EUVIX(EURUSD), BPVIX(GBPUSD)
Upon selecting the desired volatility index, users must change the multiplier to fit the underlying product since the indexes are all calculated differently.
The goal with this script was to use market generated information (IV) to highlight potential trade locations.
Impliedvolatility
rv_iv_vrpThis script provides realized volatility (rv), implied volatility (iv), and volatility risk premium (vrp) information for each of CBOE's volatility indices. The individual outputs are:
- Blue/red line: the realized volatility. This is an annualized, 20-period moving average estimate of realized volatility--in other words, the variability in the instrument's actual returns. The line is blue when realized volatility is below implied volatility, red otherwise.
- Fuchsia line (opaque): the median of realized volatility. The median is based on all data between the "start" and "end" dates.
- Gray line (transparent): the implied volatility (iv). According to CBOE's volatility methodology, this is similar to a weighted average of out-of-the-money ivs for options with approximately 30 calendar days to expiration. Notice that we compare rv20 to iv30 because there are about twenty trading periods in thirty calendar days.
- Fuchsia line (transparent): the median of implied volatility.
- Lightly shaded gray background: the background between "start" and "end" is shaded a very light gray.
- Table: the table shows the current, percentile, and median values for iv, rv, and vrp. Percentile means the value is greater than "N" percent of all values for that measure.
-----
Volatility risk premium (vrp) is simply the difference between implied and realized volatility. Along with implied and realized volatility, traders interpret this measure in various ways. Some prefer to be buying options when there volatility, implied or realized, reaches absolute levels, or low risk premium, whereas others have the opposite opinion. However, all volatility traders like to look at these measures in relation to their past values, which this script assists with.
By the way, this script is similar to my "vol premia," which provides the vrp data for all of these instruments on one page. However, this script loads faster and lets you see historical data. I recommend viewing the indicator and the corresponding instrument at the same time, to see how volatility reacts to changes in the underlying price.

Bitcoin IV C/FIllustrating Cap-Floor bands based on statistical calculations using the implied volatility of Bitcoin.
Calculation criteria can be chosen in range 1day-365days.

vol_premiaThis script shows the volatility risk premium for several instruments. The premium is simply "IV30 - RV20". Although Tradingview doesn't provide options prices, CBOE publishes 30-day implied volatilities for many instruments (most of which are VIX variations). CBOE calculates these in a standard way, weighting at- and out-of-the-money IVs for options that expire in 30 days, on average. For realized volatility, I used the standard deviation of log returns. Since there are twenty trading periods in 30 calendar days, IV30 can be compared to RV20. The "premium" is the difference, which reflects market participants' expectation for how much upcoming volatility will over- or under-shoot recent volatility.
The script loads pretty slow since there are lots of symbols, so feel free to delete the ones you don't care about. Hopefully the code is straightforward enough. I won't list the meaning of every symbols here, since I might change them later, but you can type them into tradingview for data, and read about their volatility index on CBOE's website. Some of the more well-known ones are:
ES: S&P futures, which I prefer to the SPX index). Its implied volatility is VIX.
USO: the oil ETF representing WTI future prices. Its IV is OVX.
GDX: the gold miner's ETF, which is usually more volatile than gold. Its IV is VXGDX.
FXI: a china ETF, whose volatility is VXFXI.
And so on. In addition to the premium, the "percentile" column shows where this premium ranks among the previous 252 trading days. 100 = the highest premium, 0 = the lowest premium.

vx_termsUSAGE
--------
This script helps train your intuition for changes in the VX term structure. I recommend using it on the VIX chart, so you can compare changes in the terms to changes in VIX. It's also nice for calendar spread traders who want to get a feel for the same changes.
1. Select a day, month, and year using the inputs
2. Observe the data table.
3. Open the input again and increment or decrement the day (and month, year as necessary).
4. Click "Ok".
5. Click to deselect the indicator, which allows the chart to load new data.
6. The data table will be reloaded with the next/previous day's data.
The data table has the following columns:
- contract: the VX contracts, in sequence. refer to the CBOE for month codes (F for January, etc.)
- close: the closing price of the contract.
- ma:mb: the spread (difference) between this row and the next row.
- ma:mb chg: the spread's change from prior close.
For example, given the following values for the first two columns:
VXQ2021, 16.5, -3.1, -0.2
VXU2021, 19.6, ..., ...
The front month (Q = august) closed at 16.5, $3.1 below the s\September contract. The negative spread enlarged by $0.20 from $2.90 on the previous trading day.
BUGS, ODDITIES, AND LIMITATIONS:
-------------------------------------------
- The first column will be greyed out after expiration day, which is the 3rd Tuesday of that month. Unfortunately, I can't load the next month's contract due to some limitations with TV.
- The active date is highlighted with a yellow background. When a non-trading date is selected, the highlight will disappear. However, the data table will sometimes fill with the nearest trading date, prematurely. No worries, just know that the data is probably for the previous Friday.
- The script is clunky and slow, but this is the best I can do with TV. Hopefully they add more continuous contracts or allow true dynamic symbol loading.
SPECIAL THANKS:
---------------------
Thanks to HeWhoMustNotBeNamed for helping me get through some messiness. Very helpful guy.
www.tradingview.com

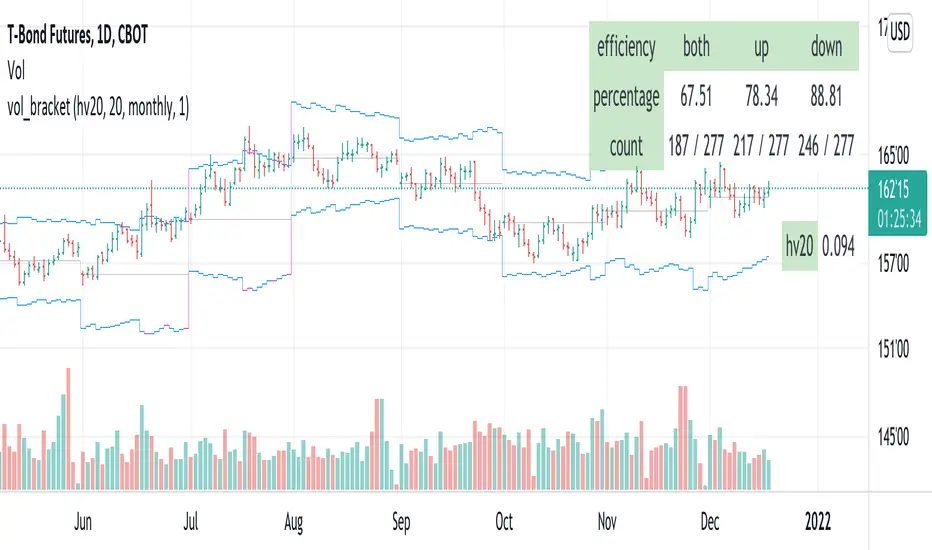
vol_bracketThis simple script shows an "N" standard deviation volatility bracket, anchored at the opening price of the current month, week, or quarter. This anchor is meant to coincide roughly with the expiration of options issued at the same interval. You can choose between a manually-entered IV or the hv30 volatility model.
Unlike my previous scripts, which all show the volatility bracket as a rolling figure, the anchor helps to visualize the volatility estimate in relation to price as it ranges over the (approximate) lifetime of a single, real contract.
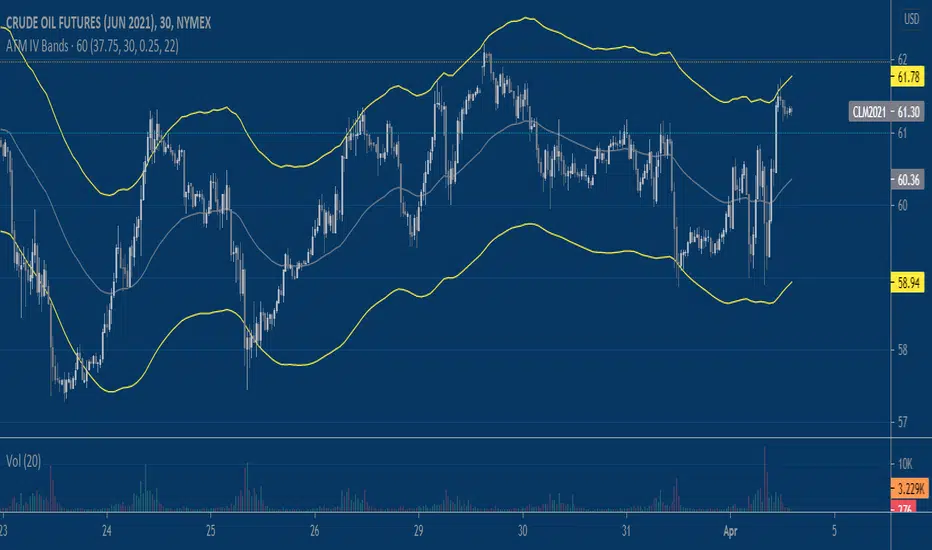
Implied Volatility BandsThis script produces price bands around an EMA based on a manually inputted Implied Volatility. The idea builds on my previous "Implied Move" script which helps visualize the distribution of prices that the market is 'pricing in' via options/implied volatility. It's up to the user to determine the implied volatility level they use, I like using the free version of QuikStrike that you can access via the CME Group website and then update the script's input daily. Another way to use the script is to input the implied volatility based on a forecast that you produce independently. Say implied volatility on June 2021 Crude Oil is 30% and you think it's rich by 2%, you can input 28% into the script to tweak the bands for a declining vol regime.
Chobotaru Indicator V1Now can be used by everyone.
Chobotaru Indicator has two functions:
1. Probability cloud, giving the probability of stock or future to move to a certain price.
2. Help traders understand where to take profit and where to put a stop-loss.
You don’t need knowledge about options trading, this indicator is for all traders/investors.
What does the indicator do?
The indicator is based on the partial differential equations from the mathematical model of options, the Black-Scholes model. Using these equations and market parameters the indicator shows on the chart the probability that the stock/future will touch a certain price until a specific date.
How the indicator does it?
The algorithm solves the partial differential equations using the following values:
Instrument price - The current price of the stock or futures contract
The interest rate – default zero – can be found by searching in google: “U.S. Department of the treasury daily yield curve rates”, Use the 3-month value. This value has a low impact on the model so you only need to update it when there is a major change in the percentile. (Example, in January 2021 the 3 months “risk-free rate” is 0.08, you can enter 0 in the indicator.
Days to expire (minus trading holidays) – You need to choose an option and take from it the other values that are needed. We recommend taking options that close to 30 days, but it is the user choice.
Example: On the 22 of January 2021, PLTR has an option that has 35 days left. The option will expire on the 26 of February 2021, if there are trading holidays like in this case, the user needs to subtract them, on the 15 of February we have Washington's Birthday, the input is 35-1=34.
Implied volatility - Annualized asset price volatility , specific as a positive decimal number. IV 10% => input 0.1, you can find it in the option chain, if you don’t know what it is, you can ask your broker where you can find it on your trading platform. For example, the IV of PLTR on the 22 of January 2021 is 120.67% the input is 1.2067
Date – Entering the date of entry.
How the indicator helps traders and how to use it?
After you enter the inputs correctly, you will see colorful lines, each line representing the probability for the price to touch there in the current market conditions until a specific date.
To see what percentage each color represents in the indicator press “style”. For example, red lines are a 50% chance for the price to touch there in the chosen period.
It also helps the trader to see what range the stock is expected to move and what range is not probable in this period (according to the options prices).
As you can see, the probability cloud is expanding. This is because as time passes, the probabilities of reaching far away prices are increasing.
Note: this indicator may not work on IPO

Implied volatility indicator - Bouhmidi-Bands Volatility trading with the Bouhmidi-Bands
Most known indicators such as Bollinger Bands or Keltner Channel focus only on historical volatility. Bouhmidi bands follow a different approach, namely an indicator based on implied volatility.
Style tags: Implied Volatility, Volatility Trading, Trend Analysis
Asset class: Equities, Futures, Commodities
Dataset: Minutes / Hours
Description
The most famous volatility indicators such as Bollinger Bands , Keltner Channel , Donchian Channels , etc. all use the historical volatility of the underlying asset. However, volatility is determined not only by historical volatility but also by implied volatility. The additional analysis of implied volatility sharpens the view and improves trading.
The Bouhmidi Bands ® were developed by myself and are based on implied volatility. They calculate an expected daily bandwidth under the assumption of normally distributed returns. The bandwidth is based on 1σ or 2σ. This means that an underlying closes with a probability of 68% or 95% within the expected Bouhmidi bandwidth at the end of the day. Check the historical development. The track record over the past 20 years shows a strong robustness of the indicator.
Benefits using Bouhmidi bands
- The Bouhmidi bands can be used to identify and filter "invisible" resistance and support that cannot be detected with simple chart analysis.
- The Bouhmidi bands can be used for different trading approaches. For example, they are suitable for mean reversion and volatility breakouts.
- If you combine the Bouhmidi bands with e.g. Keltner channel or Bollinger bands, you have the historical and implied volatility in one view in your tradingview chart.
Which underlyings can I trade with the Bouhmidi bands?
To determine the Bouhmidi bands, we need the underlying and the corresponding implied volatility index:
- S&P 500 - VIX
- DAX - VDAX-NEW
- Dow Jones - VXD
- Nasdaq 100 - VXN
- Gold - GVZ
- WTI - OVX
- Apple - VXAPL
- Amazon - VXAZN
- Google - VXGOG
- IBM - VXIBM

VIX Implied Move Bands for ES/Emini futuresThis script uses the close of the VIX on a daily resolution to provide the 'implied move' for the E-mini SP500 futures. While it can be applied to any equity index, it's crucial to know that the VIX is calculated using SPX options, and may not reflect the implied volatility of other indices. The user can adjust the length of the moving average used to calculate the bands, the window of days used to calculate the implied move, and the multiplier that effects the width of the bands.

Chobotaru IndicatorChobotaru Indicator has two functions:
1. Probability cloud, giving the probability of stock or future to move to a certain price.
2. Help traders understand where to take profit and where to put a stop-loss.
You don’t need knowledge about options trading, this indicator is for all traders/investors.
What does the indicator do?
The indicator is based on the partial differential equations from the mathematical model of options, the Black-Scholes model. Using these equations and market parameters the indicator shows on the chart the probability that the stock/future will touch a certain price until a specific date.
How the indicator does it?
The algorithm solves the partial differential equations using the following values:
Instrument price - The current price of the stock or futures contract
The interest rate – default zero – can be found by searching in google: “U.S. Department of the treasury daily yield curve rates”, Use the 3-month value. This value has a low impact on the model so you only need to update it when there is a major change in the percentile. (Example, in January 2021 the 3 months “risk-free rate” is 0.08, you can enter 0 in the indicator.
Days to expire (minus trading holidays) – You need to choose an option and take from it the other values that are needed. We recommend taking options that close to 30 days, but it is the user choice.
Example: On the 22 of January 2021, PLTR has an option that has 35 days left. The option will expire on the 26 of February 2021, if there are trading holidays like in this case, the user needs to subtract them, on the 15 of February we have Washington's Birthday, the input is 35-1=34.
Implied volatility - Annualized asset price volatility, specific as a positive decimal number. IV 10% => input 0.1, you can find it in the option chain, if you don’t know what it is, you can ask your broker where you can find it on your trading platform. For example, the IV of PLTR on the 22 of January 2021 is 120.67% the input is 1.2067
Date – Entering the date of entry.
How the indicator helps traders and how to use it?
After you enter the inputs correctly, you will see colorful lines, each line representing the probability for the price to touch there in the current market conditions until a specific date.
To see what percentage each color represents in the indicator press “style”. For example, red lines are a 50% chance for the price to touch there in the chosen period.
It also helps the trader to see what range the stock is expected to move and what range is not probable in this period (according to the options prices).
As you can see, the probability cloud is expanding. This is because as time passes, the probabilities of reaching far away prices are increasing.
How to access the indicator?
Use the link below to obtain access to the indicator
Note: this indicator may not work on IPO

VIX Term StructureThis script allows users to visualize the state of the VIX Futures Term Structure. The user is able to select from five CBOE VIX Indices; VIX, VIX9D, VIX3M, VIX6M, and VIX1Y and the script will color the candles based on the price relationship between selected indices. Visit the CBOE website for more info on how the various VIX indices are calculated.

Volatility Price TargetsPrints lines on the chart marking the price points for the standard deviation move using historical volatility. This script was born out of a need to easily spot target points for the wings of my Iron Condor Options trades. The study only shows on the Daily chart. Volatility is calculated based on the standard deviation of the daily returns of price. Price targets are calculated off yesterday's closing price and will not reprint.
Inputs
Days to Expiration - allow you to enter the number of days to expiration for the option, default is 30 for those monthly options traders but can be adjusted to your desire.
Standard Deviation - you can enter the number of deviations for which to calculate the price points 1,2, or 3.
Days in Year - you can adjust the number of days in the year used to calculate the daily volatility multiplier.

Implied Volatility PercentileThis script calculates the Implied Volatility (IV) based on the daily returns of price using a standard deviation. It then annualizes the 30 day average to create the historical Implied Volatility. This indicator is intended to measure the IV for options traders but could also provide information for equities traders to show how price is extended in the expected price range based on the historical volatility.
The IV Rank (Green line) is then calculated by looking at the high and low volatility over the number of days back specified in the input parameter, default is 252 (trading days in 1 year) and then calculating the rank of the current IV compared to the High and Low. This is not as reliable as the IV Percentile as the and extreme high or low could have a side effect on the ranking but it is included for those that want to use.
The IV Percentile is calculated by counting the number of days below the current IV, then returns this as a % of the days back in the input
You can adjust the number of days back to check the IV Rank & IV Percentile if you are not wanting to look back a whole year.
This will only work on Daily or higher timeframe charts.

IV/HV Ratio's [Nic]IV is implied volatility
HV is historic realized volatility
Seneca teaches that we often suffer more in our minds than in reality, and the same is true with the stock market. This indicator can help identify when people are over paying for implied volatility relative to real volatility . This means that short sellers are over paying for puts and can be squeezed into covering their positions, resulting in a massive rally.
The indicator can track this spread over many time frames, when the short time frame is much higher than the lower time frames, consider it a signal-of-interest.

Implied Volatility SuiteThis is an updated, more robust, and open source version of my 2 previous scripts : "Implied Volatility Rank & Model-Free IVR" and "IV Rank & IV Percentile".
This specific script provides you with 4 different types of volatility data: 1)Implied volatility, 2) Implied Volatility Rank, 3)Implied Volatility Percentile, 4)Skew Index.
1) Implied Volatility is the market's forecast of a likely movement, usually 1 standard deviation, in a securities price.
2) Implied Volatility Rank, ranks IV in relation to its high and low over a certain period of time. For example if over the past year IV had a high of 20% and a low of 10% and is currently 15%; the IV rank would be 50%, as 15 is 50% of the way between 10 & 20. IV Rank is mean reverting, meaning when IV Rank is high (green) it is assumed that future volatility will decrease; while if IV rank is low (red) it is assumed that future volatility will increase.
3) Implied Volatility Percentile ranks IV in relation to how many previous IV data points are less than the current value. For example if over the last 5 periods Implied volatility was 10%,12%,13%,14%,20%; and the current implied volatility is 15%, the IV percentile would be 80% as 4 out of the 5 previous IV values are below the current IV of 15%. IV Percentile is mean reverting, meaning when IV Percentile is high (green) it is assumed that future volatility will decrease; while if IV percentile is low (red) it is assumed that future volatility will increase. IV Percentile is more robust than IV Rank because, unlike IV Rank which only looks at the previous highs and lows, IV Percentile looks at all data points over the specified time period.
4)The skew index is an index I made that looks at volatility skew. Volatility Skew compares implied volatility of options with downside strikes versus upside strikes. If downside strikes have higher IV than upside strikes there is negative volatility skew. If upside strikes have higher IV than downside strikes then there is positive volatility skew. Typically, markets have a negative volatility skew, this has been the case since Black Monday in 1987. All negative skew means is that projected option contract prices tend to go down over time regardless of market conditions.
Additionally, this script provides two ways to calculate the 4 data types above: a)Model-Based and b)VixFix.
a) The Model-Based version calculates the four data types based on a model that projects future volatility. The reason that you would use this version is because it is what is most commonly used to calculate IV, IV Rank, IV Percentile, and Skew; and is closest to real world IV values. This version is what is referred to when people normally refer to IV. Additionally, the model version of IV, Rank, Percentile, and Skew are directionless.
b) The VixFix version calculates the four data types based on the VixFix calculation. The reason that you would use this version is because it is based on past price data as opposed to a model, and as such is more sensitive to price action. Additionally, because the VixFix is meant to replicate the VIX Index (except it can be applied to any asset) it, just like the real VIX, does have a directional element to it. Because of this, VixFix IV, Rank, and Percentile tend to increase as markets move down, and decrease as markets move up. VixFix skew, on the other hand, is directionless.
How to use this suite of tools:
1st. Pick the way you want your data calculated: either Model-Based or VixFix.
2nd. Input the various length parameters according to their labels:
If you're using the model-based version and are trading options input your time til expiry, including weekends and holidays. You can do so in terms of days, hours, and minutes. If you're using the model-based version but aren't trading options you can just use the default input of 365 days.
If you're using the VixFix version, input how many periods of data you want included in the calculation, this is labeled as "VixFix length". The default value used in this script is 252.
3rd. Finally, pick which data you want displayed from the dropdown menu: Implied Volatility, IV Rank, IV Percentile, or Volatility Skew Index.

Black-Scholes Options Pricing ModelThis is an updated version of my "Black-Scholes Model and Greeks for European Options" indicator, that i previously published. I decided to make this updated version open-source, so people can tweak and improve it.
The Black-Scholes model is a mathematical model used for pricing options. From this model you can derive the theoretical fair value of an options contract. Additionally, you can derive various risk parameters called Greeks. This indicator includes three types of data: Theoretical Option Price (blue), the Greeks (green), and implied volatility (red); their values are presented in that order.
1) Theoretical Option Price:
This first value gives only the theoretical fair value of an option with a given strike based on the Black-Scholes framework. Remember this is a model and does not reflect actual option prices, just the theoretical price based on the Black-Scholes model and its parameters and assumptions.
2)Greeks (all of the Greeks included in this indicator are listed below):
a)Delta is the rate of change of the theoretical option price with respect to the change in the underlying's price. This can also be used to approximate the probability of your option expiring in the money. For example, if you have an option with a delta of 0.62, then it has about a 62% chance of expiring in-the-money. This number runs from 0 to 1 for Calls, and 0 to -1 for Puts.
b)Gamma is the rate of change of delta with respect to the change in the underlying's price.
c)Theta, aka "time decay", is the rate of change in the theoretical option price with respect to the change in time. Theta tells you how much an option will lose its value day by day.
d) Vega is the rate of change in the theoretical option price with respect to change in implied volatility .
e)Rho is the rate of change in the theoretical option price with respect to change in the risk-free rate. Rho is rarely used because it is the parameter that options are least effected by, it is more useful for longer term options, like LEAPs.
f)Vanna is the sensitivity of delta to changes in implied volatility . Vanna is useful for checking the effectiveness of delta-hedged and vega-hedged portfolios.
g)Charm, aka "delta decay", is the instantaneous rate of change of delta over time. Charm is useful for monitoring delta-hedged positions.
h)Vomma measures the sensitivity of vega to changes in implied volatility .
i)Veta measures the rate of change in vega with respect to time.
j)Vera measures the rate of change of rho with respect to implied volatility .
k)Speed measures the rate of change in gamma with respect to changes in the underlying's price. Speed can be used when evaluating delta-hedged and gamma hedged portfolios.
l)Zomma measures the rate of change in gamma with respect to changes in implied volatility . Zomma can be used to evaluate the effectiveness of a gamma-hedged portfolio.
m)Color, aka "gamma decay", measures the rate of change of gamma over time. This can also be used to evaluate the effectiveness of a gamma-hedged portfolio.
n)Ultima measures the rate of change in vomma with respect to implied volatility .
o)Probability of Touch, is not a Greek, but a metric that I included, which tells you the probability of price touching your strike price before expiry.
3) Implied Volatility:
This is the market's forecast of future volatility . Implied volatility is directionless, it cannot be used to forecast future direction. All it tells you is the forecast for future volatility.
How to use this indicator:
1st. Input the strike price of your option. If you input a strike that is more than 3 standard deviations away from the current price, the model will return a value of n/a.
2nd. Input the current risk-free rate.(Including this is optional, because the risk-free rate is so small, you can just leave this number at zero.)
3rd. Input the time until expiry. You can enter this in terms of days, hours, and minutes.
4th.Input the chart time frame you are using in terms of minutes. For example if you're using the 1min time frame input 1, 4 hr time frame input 480, daily time frame input 1440, etc.
5th. Pick what style of option you want data for, European Vanilla or Binary.
6th. Pick what type of option you want data for, Long Call or Long Put.
7th . Finally, pick which Greek you want displayed from the drop-down list.
*Remember the Option price presented, and the Greeks presented, are theoretical in nature, and not based upon actual option prices. Also, remember the Black-Scholes model is just a model based upon various parameters, it is not an actual representation of reality, only a theoretical one.
*Note 1. If you choose binary, only data for Long Binary Calls will be presented. All of the Greeks for Long Binary Calls are available, except for rho and vera because they are negligible.
*Note 2. Unlike vanilla european options, the delta of a binary option cannot be used to approximate the probability of the option expiring in-the-money. For binary options, if you want to approximate the probability of the binary option expiring in-the-money, use the price. The price of a binary option can be used to approximate its probability of expiring in-the-money. So if a binary option has a price of $40, then it has approximately a 40% chance of expiring in-the-money.
*Note 3. As time goes on you will have to update the expiry, this model does not do that automatically. So for example, if you originally have an option with 30 days to expiry, tomorrow you would have to manually update that to 29 days, then the next day manually update the expiry to 28, and so on and so forth.
There are various formulas that you can use to calculate the Greeks. I specifically chose the formulations included in this indicator because the Greeks that it presents are the closest to actual options data. I compared the Greeks given by this indicator to brokerage option data on a variety of asset classes from equity index future options to FX options and more. Because the indicator does not use actual option prices, its Greeks do not match the brokerage data exactly, but are close enough.
I may try to make future updates that include data for Long Binary Puts, American Options, Asian Options, etc.

Black-Scholes Model and Greeks for European OptionsThe Black-Scholes model is a mathematical model used for pricing options. From this model you can derive the theoretical fair value of a European option (an option where you have to wait until expiry to exercise). Additionally, you can derive various risk parameters called Greeks. This indicator includes three types of data: Theoretical Option Price (blue), the Greeks (green), and implied volatility (red); their values are presented in that order.
1) Theoretical Option Price:
This first value gives only the theoretical fair value of an option with a given strike based on the Black-Scholes framework. Remember this is a model and does not reflect actual option prices, just the theoretical price based on the Black-Scholes model and its parameters and assumptions.
2)Greeks (all of the Greeks included in this indicator are listed below):
a)Delta is the rate of change of the theoretical option price with respect to the change in the underlying's price. This can also be used to approximate the probability of your option expiring in the money. For example, if you have an option with a delta of 0.62, then it has about a 62% chance of expiring in-the-money. This number runs from 0 to 1 for Calls, and 0 to -1 for Puts.
b)Gamma is the rate of change of delta with respect to the change in the underlying's price.
c)Theta, aka "time decay", is the rate of change in the theoretical option price with respect to the change in time. Theta tells you how much an option will lose its value day by day.
d)Vega is the rate of change in the theoretical option price with respect to change in implied volatility.
e)Rho is the rate of change in the theoretical option price with respect to change in the risk-free rate. Rho is rarely used because it is the parameter that options are least effected by, it is more useful for longer term options, like LEAPs.
f)Vanna is the sensitivity of delta to changes in implied volatility. Vanna is useful for checking the effectiveness of delta-hedged and vega-hedged portfolios.
g)Charm, aka "delta decay", is the instantaneous rate of change of delta over time. Charm is useful for monitoring delta-hedged positions.
h)Vomma measures the sensitivity of vega to changes in implied volatility.
i)Veta measures the rate of change in vega with respect to time.
j)Vera measures the rate of change of rho with respect to implied volatility.
k)Speed measures the rate of change in gamma with respect to changes in the underlying's price. Speed can be used when evaluating delta-hedged and gamma hedged portfolios.
l)Zomma measures the rate of change in gamma with respect to changes in implied volatility. Zomma can be used to evaluate the effectiveness of a gamma-hedged portfolio.
m)Color, aka "gamma decay", measures the rate of change of gamma over time. This can also be used to evaluate the effectiveness of a gamma-hedged portfolio.
n)Ultima measures the rate of change in vomma with respect to implied volatility.
o)Probability of Touch, is not a Greek, but a metric that I included, which tells you the probability of price touching your strike price before expiry.
3) Implied Volatility:
This is the market's forecast of future volatility. Implied volatility is directionless, it cannot be used to forecast future direction. All it tells you is the forecast for future volatility.
How to use this indicator:
1st. Input the strike price of your option. If you input a strike that is more than 3 standard deviations away from the current price, the model will return a value of n/a.
2nd. Input the current risk-free rate.(Including this is optional, because the risk-free rate is so small, you can just leave this number at zero.)
3rd. Input the time until expiry. You can enter this in terms of days, hours, and minutes.
4th.Input the chart time frame you are using in terms of minutes. For example if you're using the 1min time frame input 1, 4 hr time frame input 480, daily time frame input 1440, etc.
5th. Pick what type of option you want data for, Long Call or Long Put.
6th. Finally, pick which Greek you want displayed from the drop-down list.
*Remember the Option price presented, and the Greeks presented, are theoretical in nature, and not based upon actual option prices. Also, remember the Black-Scholes model is just a model based upon various parameters, it is not an actual representation of reality, only a theoretical one.

Imminence of volatilityWork in progress.
Simple oscillator that takes in implied volatilities at two different timescales for the same security, to determine whether the market expects the next crash to be imminent or "in a few months from now".
Best combined with other IV/VIX-based indicators and visual inspection of the IV charts, but still gives some decent information at a glance.

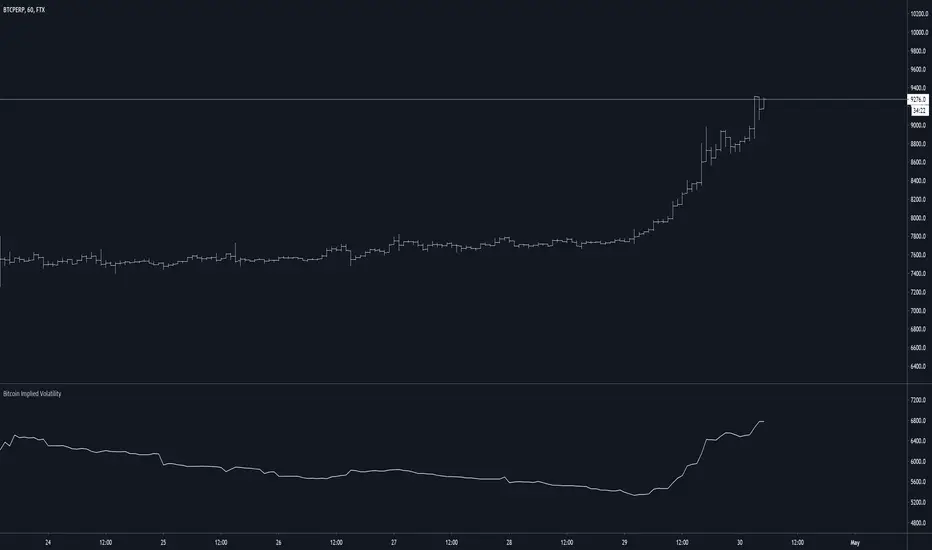
Bitcoin Implied VolatilityThis simple script collects data from FTX:BVOLUSD to plot BTC’s implied volatility as a standalone indicator instead of a chart.
Implied volatility is used to gauge future volatility and often used in options trading.
SPY Expected Move by VIXThis indicator shows 1 and 2 standard deviation price move from the VWAP based on VIX. Implied Volatility (IV) is being used extensively in the Option world to project the Expected Move for the underlying instrument. VIX is used as a proxy for SPY's IV for 30 days.
This indicator is meaningful only for SPY but can be used in any other instrument which has a strong correlation to SPY.

historical volatility by flashThe script is made to help to determine OPTIONS volatility.
The Script is showing the Historical volatility of any stock for its last 1 year data.
Historical volatility is important to know how stock can perform in panic days.
Historical volatility is best used with Implied volatility.
How to Interpret the Script or How to use it?
The Script show 5 parts the lowermost is lowest HV in last year & the highest part shows highest volatility in the past 1 year.
Use this on a DAILY CHART only.
Now Take the IV (implied volatility of stock) and put that figure in between the HV and check in which part current IV resides. based on that you can determine how OPTIONS premium or how much it INFLATED or DEFLATED .

HV/IV Options IndicatorThe Options HV/IV indicator helps in comparing the Scripts Historic Volatility with Implied Volatility (provided by user). The Indicator creates 5 zones, starting from the bottom
Zone 1 - Very Cheap
Zone 2 - Cheap
Zone 3 - Fair
Zone 4 - Expensive
Zone 5 - Very Expensive
The location of the Implied Volatility (Blue line) in the corresponding zone helps in understanding the options pricing as very cheap, cheap, fair, expensive or very expensive. This analysis helps in choosing the correct option strategy when planning options trades.
Use the link below to obtain access to this indicator.
