Derivative Oscillator Cu [ID: AC-P]The "AC-P" version of the Derivative Oscillator is my personal customized version of Constance Brown's Derivative Oscillator (using Everget's implementation of it as the base), with the the following modifications and additions:
VWAP Indication - option to show whether the price input option is above or below the Daily VWAP (red triangles = price input is below vwap, green triangles = price input is above vwap)
Bullish and Bearish phases from shayankm's Waddah Attar Explosion V2 () is included as indication dots (bullish = blue dots, bearish = yellow dots) below/above the Derivative Oscillator histogram
Coral Trend from Lazybear () is included as indication dots (red/green dots below/above the Derivative Oscillator histogram
Input source options for vwap, Waddah components (MACD, Bollinger Upper/Lower)
Centerline option for Coral trend, and Horizontal center option for the Derivative Oscillator with circle indication (optional - provided as option for flexibility in use with overlaying with other indicators)
This indicator is a hybrid, with a combination of leading indicators and lagging trending indicators combined into one. Specifically, a few of the other indicators I use are lacking in the momentum and trend department, and this is one of the indicators I use to address that:
VWAP provides trend information on lower timeframes from a high timeframe interval (D)
Coral Trend provides additional confirmation to VWAP trend wise, and is adjustable
Waddah Attar Explosion provides a third level of confirmation for trending moves, taking into account shorter and longer timeframes (FastEMA and SlowEMA parameters).
Script base for the Derivative Oscillator is credited to Everget () and LazyBear ().
Source attribution to Constance Brown for the Derivative Oscillator formula/indicator:
// Brown, Constance.
// Reference 1: “The Derivative Oscillator: a New Approach to an Old Problem,” Journal of Technical Analysis (Winter-Spring 1994) 45–61.
// Reference 2: Technical Analysis for the Trading Professional. New York, NY: McGraw-Hill, 1999.
Information on the Derivative Oscillator:
www.investopedia.com
Lazybear

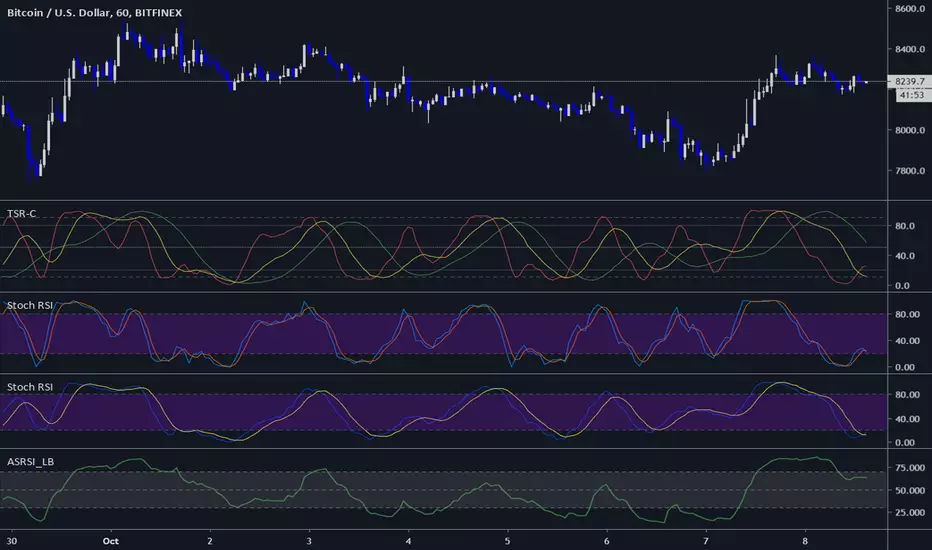
Three StochRSI ComboThree StochRSI with adjustable lengths in one indicator, with no extra bells or whistles. Lazybear's Apirine Slow RSI is used for the RSI formula for the third Stoch.
14-period StochRSI (red) is considered short term.
20-period StochRSI is another short to mid term preset I've seen used in various indicators on different platforms by default, and is included as the yellow stochRSI.
Lazybear's Apirine Slow RSI is used as the base for the third, slower stoch - parameter input adjustment for your specific timeframe and instrument is recommended. The Apirine Slow RSI doesn't have as effective strong divergences during established trends, so the way it would react in when run through a stoch should be more synergistic than not during trending periods for longer term trends.
StochRSI:
StochRSI measures the value of RSI relative to its high/low range over a set number of periods - It's important to note that StochRSI is technically an indicator of an indicator (RSI), which makes it the second derivative of price. This is part of the main contributing factors to how it looks and functions in relation to price.
A move above 80 ---> considered overbought.
A move below 20 ---> considered oversold.
Moves around the midline (50) can also be interpreted as continuation of upward/downwards trend depending on whether the midline is acting more of as a support (uptrend) or a resistance level (downtrend).
Stoch K-line disabled by default/D-line enabled by default.
Stoch K/D lengths are set to 3/3/14/14 (red), 6/6/20/20 (yellow), 12/12 (green) by default.
Midline (50) set to white/silver to make more visible on darkmode charts.
Additional adjustable levels for Overbought/Oversold beyond 20/80 (set at 10/90 by default - see dashed grey line. Dotted line is 20/80.)
Three stochRSI with 3/3/14/14, 6/6/20/20, and 12/12/14/14/6 length are shown below the indicator for reference.
Acknowledgements:
// Aprine Slow RSI - Lazybear
//
// Stockcharts for StochRSI reference
// school.stockcharts.com
Weis Wave Volume (Pinescript 4)Port of LazyBear's Weis Wave Volume indicator to pinescript v4 from v2.

Squeeze [LazyBear] w Murat ColorsOriginal by @LazyBear
Differents:
scolor => white & black
plot histogram => linewidth=5
plot style => circles, linewidth => 4, transp => 0

Waddah Attar Explosion V2 [SHK]Hey everyone
I have modified Waddah Attar Explosion indicator to work in low price markets like crypto as well as any other market. So now the DeadZone line is based on ATR instead of a fixed number. Nothing more changed and all credits goes to it's MT4 developer and LazyBear (Main Script Link) .
Hope you enjoy!
Read the main description below...
- - - - - - - - - - - - - - - - - - - - - - - - - - - - - - - - - - - - - - -
This is a port of a famous MT4 indicator. This indicator uses MACD/BB to track trend direction and strength. Author suggests using this indicator on 30mins.
Explanation from the indicator developer:
"Various components of the indicator are:
Dead Zone Line: Works as a filter for weak signals. Do not trade when the red or green histogram is below it.
Histograms:
- Red histogram shows the current down trend.
- Green histogram shows the current up trend.
- Sienna line shows the explosion in price up or down.
Signal for ENTER_BUY: All the following conditions must be met.
- Green histo is raising.
- Green histo above Explosion line.
- Explosion line raising.
- Both green histo and Explosion line above DeadZone line.
Signal for EXIT_BUY: Exit when green histo crosses below Explosion line.
Signal for ENTER_SELL: All the following conditions must be met.
- Red histo is raising.
- Red histo above Explosion line.
- Explosion line raising.
- Both red histo and Explosion line above DeadZone line.
Signal for EXIT_SELL: Exit when red histo crosses below Explosion line.
All of the parameters are configurable via options page. You may have to tune it for your instrument.

HawkEye Volume [aamonkey]This is an extended version of the HawkEye indicator by LazyBear.
I just added a sma to use as a filter.

Hurst Cycle Channel Clone %BA %B of lazy bears Hurst Cycle Channel Clone
Remember to thank him for his great scripts.
With this you can easily see when the close is above,below or in the short or medium cycle channel.

RSI Bands %BThis is again a lazy bear script that has been lost due to the removal of the "make it mine feature".
please credit
If you see any of his great scripts that are no longer accessible message me and I will see what I can do.

Adaptive Bollinger Bands [jwammo12]This takes Ehler's work that dynamically finds the frequency of market cycles and applies it to the concept of Bollinger Bands.
First the dominant cycle length is found using Ehler's methods, this is then used as the length to the moving average and deviation.
I also ended up using an exponential average rather than a simple average for both the moving average center line and the sum of the squares when finding the deviation.
credit goes to LazyBear for coding Ehler's original ideas in pine, which I then used for this script.

Traders Dynamic Index Pro by YardleyRosetteThis is an excellent indicator thanks to the code author LazyBear!
I have modified to a more appealing colors visually representing market condition.
2 Backgrounds
Uptrend/Sell: Uptrend above Orange line, Sell potential area.
Downtrend/Buy: Downtrend under Orange line, Buy potential area.
I have modified by adding previously unrecognized upper and lower channels of support/resistance zones within Traders Dynamic Index which will be of great use in previously confusing situations.
The Traders Dynamic Index, observes trend direction , market strength , and market volatility .
To be used by the "elite", the Pro accounts.
Multiple Time Frames are ABSOLUTELY required. I'm sorry for those who aren't. I can refer you who don't, to try out KK_Traders Dynamic Index Higher Timeframe (by Kurbelklaus).
Multiple Time Frames are necessary or else technical analysis using this one chart alone will give false reasoning as I have witnessed a few who do attempt to use this time machine, including me when I had not used multiple time frame charts since I did not have the PRO account.
Problems, for example low time frame indicates 'overbought' yet higher time frame indicates it had been oversold. Which are you to agree with? The higher time frame absolutely.
In this condition though an overall retracement will very likely occur in the short-term.
Here is my clever explanation of the rules:
Use of time frames: Traders' choice of combination.
For example, 180, 90, and 45 minute charts may be useful for example with Bitcoin
You can see what may confuse others. Apparently rising as a buy signal for having green line cross up from below orange line, but 90 minute time frame thanks to this support/ resistance channel coded within T.D.I. can be observed as an alerting condition. Then observing 45 minute time frame notice the blue lines ("Bands") are 'squeezing' the other components you can then expect a breakout , and if its in the overbought side, at least above 56, and the 240 time frame can identify current downtrend... you know how to connect the data given by the charts: Ranging Overbought in a downtrend will breakout. 1) Overbought in downtrend: Sell, 2) Ranging to breakout, set entry order according to pattern. With probability on your side, you can set a sell stop under the tricky uptrend line when all others are wondering what will happen, you are ahead.
According to range scalping: Great Scalping
Only if orange (MBL) line steady within upper and lower midlines 40 and 60
Long, when green and red line are under 44 with green crossing over red.
The green line is above the red line
The green line is above the orange line
Short, when green and red line are above 56 with red crossing over green.
The green line is below the red line
The green line is below the orange line
Close when opposite signal is about to occur

Bitcoin Momentum TSIChart based on True Strength Indicator
It was improved to show same information as Squeeze Momentum Indicator by LazyBear,
but it seems to have better and quicker response to changes and was tested on Bitcoin mainly.
Enjoy it!
BITFINEX:BTCUSD
Colored Volume Bars [LazyBear] with overlayDivs and candle alignment a little easier to see - volume/2 to size correctly - could still use some refining
All credits to LazyBear for his color volume bar source code
DiNapoli Preferred Stochastic Oscillator [LazyBear]Copied this from pastebin.com per LazyBear's instructions on a TradingView forum.
Many thanks to LazyBear for figuring this out.
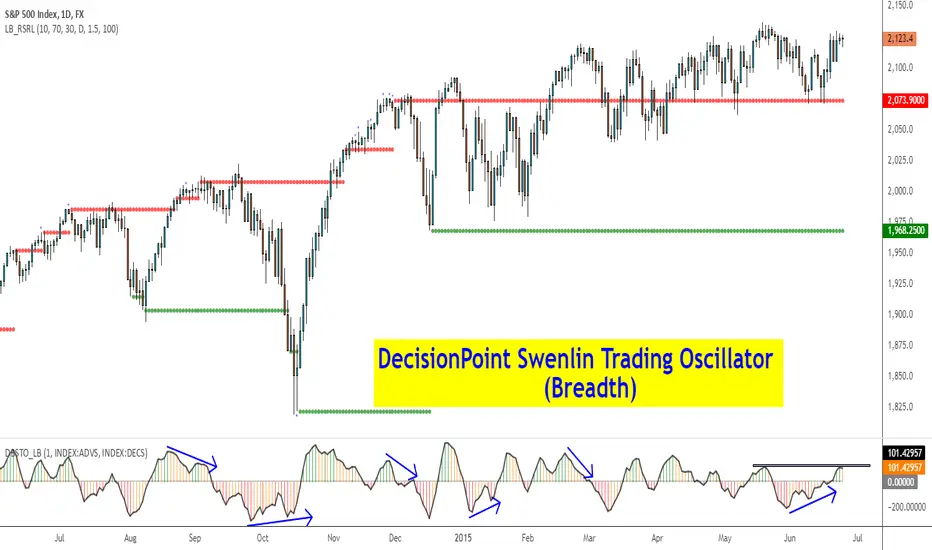
DecisionPoint Volume Swenlin Trading Oscillator [LazyBear]This is the volume version of "DecisionPoint Breadth Swenlin Trading Oscillator"
DecisionPoint Swenlin Trading Oscillator can be used to identify short-term tops and bottoms. You can read about the interpretation of the signals (& gotchas) in the link below.
I have added support for NYSE / NASD / AMEX and also a combined mode. You can specify custom advancing/declining volume symbols too.
More Info:
DBSTO:
Article: stockcharts.com
List of my public indicators: bit.ly
List of my app-store indicators: blog.tradingview.com
Having both Swenlin Breadth and Volume oscillators help spot the divergences quickly:

DecisionPoint Breadth Swenlin Trading Oscillator [LazyBear]DecisionPoint Swenlin Trading Oscillator can be used to identify short-term tops and bottoms. This is a breadth indicator. STO is designed to be calculated using either issues or volume, I will post a follow up indicator that makes use of volume.
You can read about the interpretation of the signals (& gotchas) in the link below.
I have added support for NYSE / NASD / AMEX and also a combined mode. You can specify custom advancing/declining mkt symbols too.
More Info:
stockcharts.com
List of my public indicators: bit.ly
List of my app-store indicators: blog.tradingview.com
DecisionPoint Price Momentum Oscillator [LazyBear]The DecisionPoint Price Momentum Oscillator (PMO) is an oscillator based on a Rate of Change calculation that is smoothed twice with custom exponential moving averages. Because the PMO is normalized, it can also be used as a relative strength tool.
PMO can be used in many ways:
- PMO can be used to determine the OB/OS state. While the +2.5 to -2.5 is the usual range for broad stock market indexes, each price index will have its own “signature” range. You may have to tune this for your instrument.
- PMO triggers buy/sell on signal crossovers and ZERO crossovers.
- Common patterns like BullKiss, BearKiss are useful to track. See the link below for more info.
- Divergences.
- Histo-only mode that can be used similar to MACD-Histo.
I have exposed all params as configurable. Have fun tuning :) Don't forget to share what you found for your instrument.
More Info:
stockcharts.com
List of my public indicators: bit.ly
List of my app-store indicators: blog.tradingview.com
Some Sample Charts:
TWTR:
MSFT:
GOOGL:

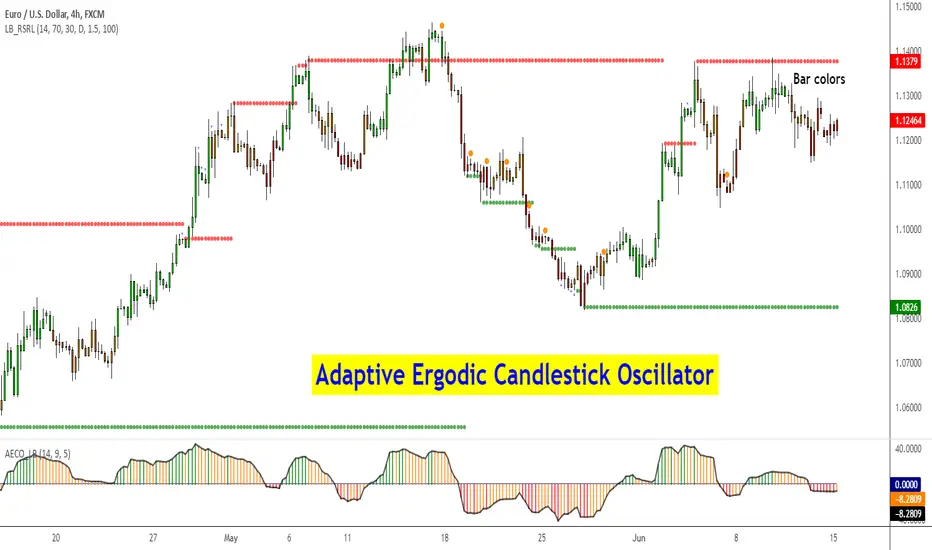
Adaptive Ergodic Candlestick Oscillator [LazyBear]This updates Blau's excellent Candlestick oscillator to be adaptive by using the length of a scaled stochastic indicator and an exponent (for calculating the smoothing coefficient) to obtain the moving average.
Check out the options page for configurable variables.
More info on Ergodic Oscillator:
Book: "Momentum, Direction and Divergence" by William Blau
List of my public indicators: bit.ly
List of my app-store indicators: blog.tradingview.com
Apirine Slow RSI [LazyBear]The slow relative strength index (SRSI) indicator created by Vitali Apirine is a momentum price oscillator similar to RSI in its application and interpretation. Oscillating between 0 and 100, it generates both OB/OS signals and midline (50) cross over signals and divergences.
As author suggests, bullish/bearish divergences generated by SRSI are not as effective during strong trends. To avoid fading an established trend, the system is used in conjunction with a trend confirmation tool like ADX indicator.
You can configure the OB/OS levels, default are 70/30.
More info:
The slow relative strength index, TASC 2015-07
List of my public indicators: bit.ly
List of my app-store indicators: blog.tradingview.com

Ehlers Smoothed Adaptive Momentum [LazyBear]Bored of Ehlers yet? :) I still have plenty of Ehlers in my collection, was thinking of publishing one of his Fishers or Adaptive RVI next, but @ChartArt requested Smoothed Adaptive Momentum (SAM), so here we go...
This is my 200th script (not including the variations and other custom scripts I shared over PM). My complete list of indicators here - bit.ly
Now, about the indicator :)
This smoothed adaptive momentum is straightforward to use (per Ehlers original rules). If it crosses above zero buy the next open, if it crosses below zero sell the next open. Of course, I strongly suggest filtering the signals.
Finally, here's an Ehlers-only chart to help determine where BTC is heading :P
More info:
- Ehlers CG Oscillator:
- Cybernetic Analysis for Stocks and Futures (Ehlers)
List of my public indicators: bit.ly
List of my app-store indicators: blog.tradingview.com
--Updated chart--
Here's the chart with barcolors ON (forgot to turn it on in the published one)

Ehlers Adaptive CG Indicator [LazyBear]Lets go with another adaptive indicator today. BTW, this is my 199th script (1 more and I am planning to work on my other backlogs).
This is the adaptive version of Ehlers' Center Of Gravity (CG) (already published, check "More info" below). Idea behind making something "adaptive" is to calculate it using dynamic cycle period inputs instead of static setting. In adaptive CG, Ehlers uses the dominant cycle period as the length in computation of alpha.
According to Ehlers this should be more responsive than the non-adaptive version. Buy and sell signals should often occur one bar earlier than for the non-adaptive version.
I have the usual options in place. Check out plain CC for comparison.
Here's a quick comparison between CG and Adaptive CG:
More info:
- Ehlers CG Oscillator:
- Cybernetic Analysis for Stocks and Futures (Ehlers)
List of my public indicators: bit.ly
List of my app-store indicators: blog.tradingview.com

Ehlers Adaptive Cyber Cycle Indicator [LazyBear]Another famous Ehlers indicator.
This is the adaptive version of Ehlers' Cyber Cycle (CC) (already published, check "More info" below). Idea behind making something "adaptive" is to calculate it using dynamic cycle period inputs instead of static setting. In adaptive cyber cycle, Ehlers uses the dominant cycle period as the length in computation of alpha.
According to Ehlers this should be more responsive than the non-adaptive version. Buy and sell signals should often occur one bar earlier than for the non-adaptive version.
I have the usual options in place. Check out plain CC for comparison.
More info:
- Cyber Cycle Indicator:
- Cybernetic Analysis for Stocks and Futures (Ehlers)
List of my public indicators: bit.ly
List of my app-store indicators: blog.tradingview.com

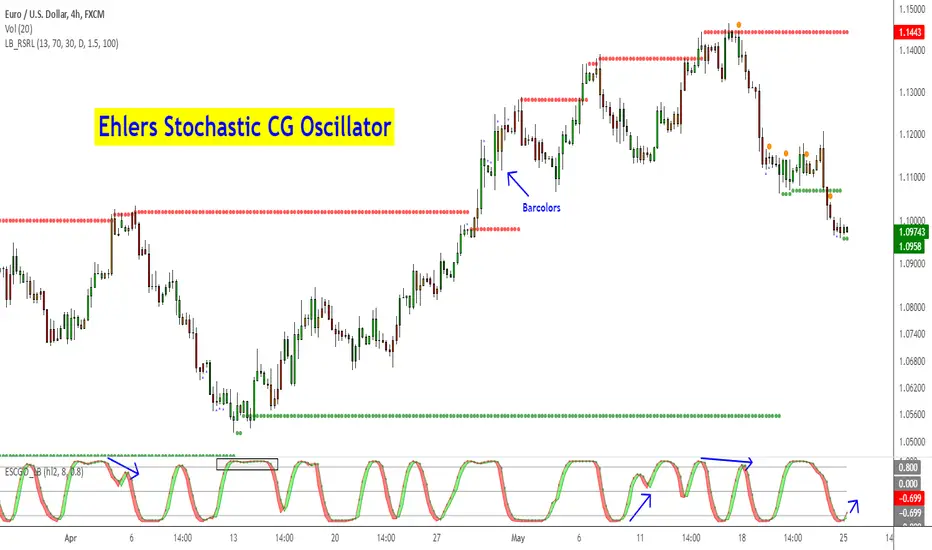
Ehlers Stochastic CG Oscillator [LazyBear]Another one from Ehlers.
Ehlers likes the idea behind StochRSI so much, he dedicated a full chapter in his book (linked below) on how stoch works with his "superlative" (his words, not mine) indicators. This is stoch of his CG oscillator.
Standard stochastic oscillator uses fixed period for calculations and does not adjust to the constantly changing market cycle length. Stochastic CG Oscillator does not have such a drawback.
Use this like normal stochRSI osc (Uncheck "Fill Osc/Trigger" option, sample chart below)
More info:
- CG oscillator:
- Cybernetic Analysis for Stocks and Futures (Ehlers)
List of my public indicators: bit.ly
List of my app-store indicators: blog.tradingview.com
Ehlers MESA Adaptive Moving Average [LazyBear]Another one to add to Ehlers collection.
The MESA Adaptive Moving Average (MAMA) adapts to price movement based on the rate of change of phase as measured by the Hilbert Transform Discriminator. This method features a fast attack average and a slow decay average so that composite average rapidly ratchets behind price changes and holds the average value until the next ratchet occurs. Consider FAMA (Following AMA) as the signal.
Here are some of the options:
Fill MAMA/FAMA region (ribbon mode):
Mark Crossovers:
The above options (along with the bar colors) allow this to be used as a standalone system.
BTW, John Ehlers calls MAMA, "Mother of all Adaptive Moving Averages", lemme know what you think :)
More info:
- MESA Adaptive Moving Average, Stocks and Commodities Magazine, August 2001
- MAMA: www.mesasoftware.com
List of my public indicators: bit.ly
List of my app-store indicators: blog.tradingview.com
