Linear regressionThis is my idea by using Linear regression and some other filters. Great result without repaint :)
Regressione lineare

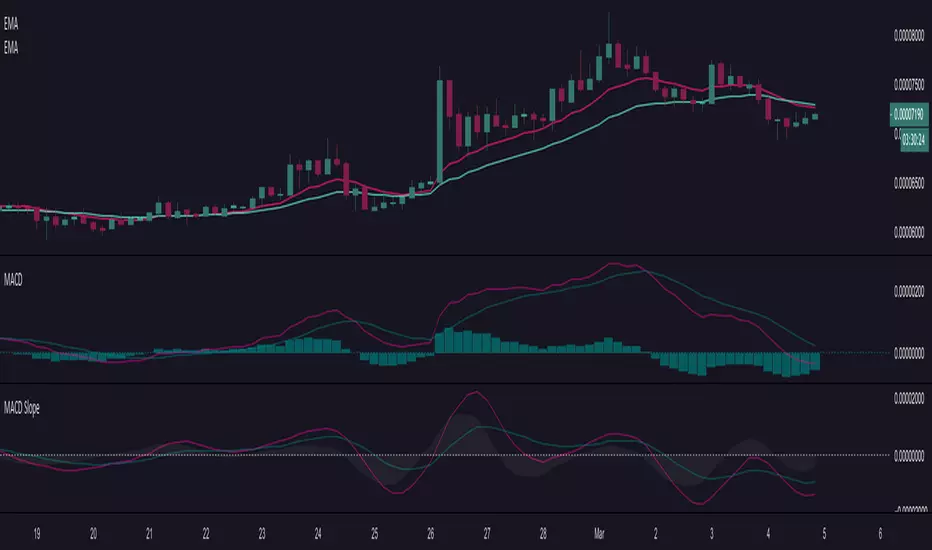
MACD SlopeShows slopes of macd line, signal line and histogram. A negative and rising slope shows improvement within a downtrend. A positive and falling slope shows deterioration within an uptrend.
Linear regression slope as SARThis model calculate the slope of the linear regression and give you the uptrend or the down trend of the slope
red line are downtrend and green line are up trend
using len 1 you can make it longer or shorter (I put it on length of 40 but you can change that to what ever you want )
Similar to SAR it can give us the trends of buy and sell only by doing it by the linear way
try longer length to see if it smooth the signal
4 hour graph

TH_HMA+ HistogramHistogram version of HMA+. This Centered Oscillator show more accurately when trends are reversing thanks to the U-shape reversals and clouds switching Red/Green. Fast MA getting above/under the base implies a establish Bullish/Bearish bias.
There is a flagging circles that will be visible depending how price is under or above the Fast MA which can also provide early indication of trend direction.

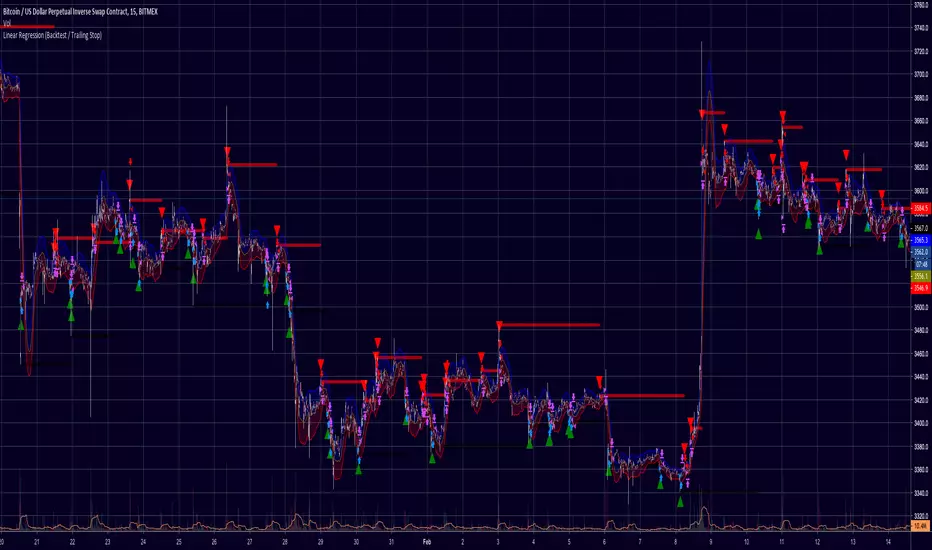
Linear Regression (Backtest / Trailing Stop)A Strategy with Backtest and Trailing Stop for Long/Short
Credits: Study by RafaelZioni - Thanks buddy!
linear regression newSo this is new attempt to plot linear regression ,
I hope TV will make it free so we will not need to break our heads on this important indicator

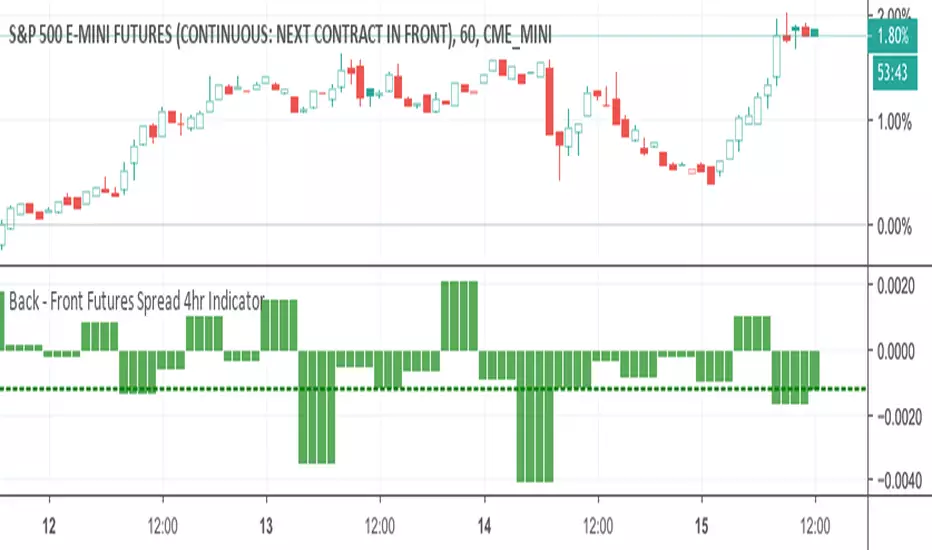
Back - Front Futures Spread 4hr IndicatorThis puts a normalized back - front spread based on the close price.
Linear regression % channelThis channel is based on Linear regression by its % difference from the price
the high and the low are determine by the % from the close price . For the best fit you need to put the TF on the same min of the graph.
I put the channel to be 3 % above and bellow the price .by the same way you can add to the script more % line to make it better
this is good indicator for filtering (if you want your signal to be above or bellow the % channel) or if you want to enter at certain price and exit by the regular TV alerts so it more easy where your target for long or short exist

Dorsey InertiaThis indicator was originally developed by Donald Dorsey (Stocks & Commodities, V.13:9 (September, 1995): "Refining the Relative Volatility Index").
Inertia is based on Relative Volatility Index (RVI) smoothed using linear regression.
In physics, inertia is the tendency of an object to resist to acceleration. Dorsey chose this name because he believes that trend and inertia are related and that it takes more effort and energy to reverse the direction of a stock or market than to keep it in the same direction. He argues that the volatility is the simplest and most accurate measure of inertia.
When the indicator is below 50, it signals bearish market sentiment and when the indicator is above 50 it signals a bullish trend.
Good luck!

Kirshenbaum BandsThis indicator was originally developed by Paul Kirshenbaum, a mathematician with a Ph.D. in economics from New York University.
It uses the standard error of linear regression lines of the closing price to determine band width. This has the effect of measuring volatility around the current trend, rather than measuring volatility for changes in trend.
Good luck!

DSS Strategy V.1This is a strategy which can be used as a Decision Support System (DSS). In this version I use Heikin Ashi chart. This strategy works for Long positions.
How to use:
1- Select the Heikin Ashi chart.
2- The default values of Length and Threshold for BTCUSDT in "1H chart" is 2 and 20 respectively. It can be changed to achieve the best performance for BTCUSDT or other symbols in arbitrary time frames.
3. When the background is green buy, and when the background is red sell.

DSS Indicator V.1This is an indicator which can be used as a Decision Support System (DSS). In this version I use Heikin Ashi chart.
How to use:
1- Select the Heikin Ashi chart.
2- The default values of Length and Threshold for BTCUSDT in "1H chart" is 2 and 20 respectively. It can be changed to achieve the best performance for BTCUSDT or other symbols in arbitrary time frames.
3. When the background is green buy, and when the background is red sell.

Linear Regression of McGinley Dynamic DivergenceThis is a linear regression of McGinley Dynamic Divergence with Long and Short conditions
I've added a Threshold (editable in settings) which goes up and down with the same setting to generate more or less signals to accommodate the chosen ticker and timeframe.
The default settings have been selected to work best on BTCUSD M15 as shown above.
Green = Long Entry zone
Red = Short Entry zone

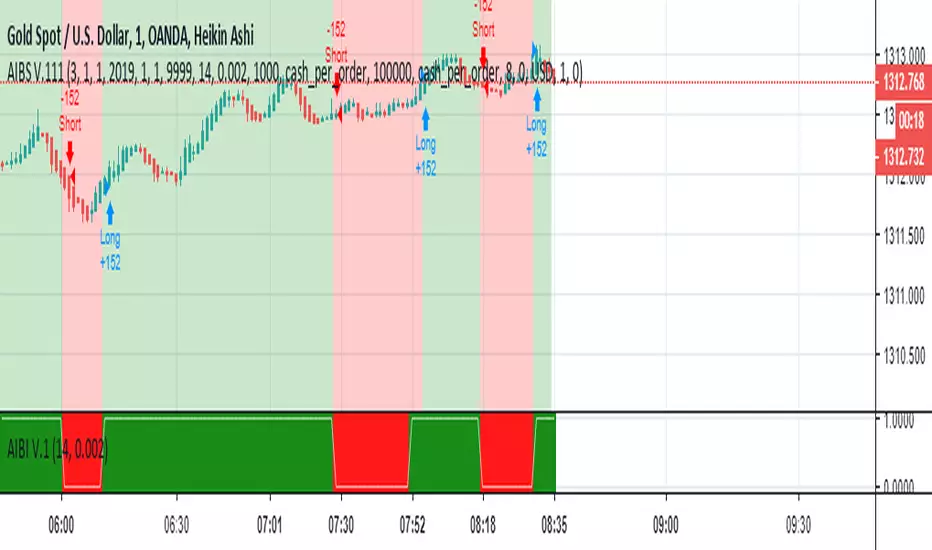
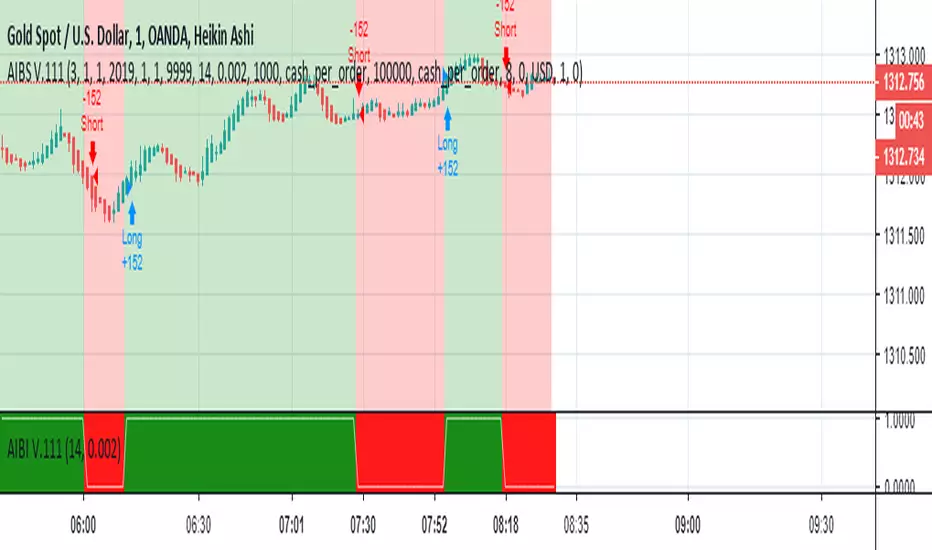
AI-Based Indicator V.1.01This is a Strategy based on Artificial Intelligence (AI) algorithms which can be used as a decision support system. In this version I use Heikin Ashi chart and reduce input parameters.
How to use:
1- Select the Heikin Ashi chart.
2- The default values of T for BTCUSD in "30m chart" is 0.12. It can be changed to achieve the best performance for BTCUSD or other tickers in arbitrary time frames.
3. When the background is green buy, and when the background is red sell.
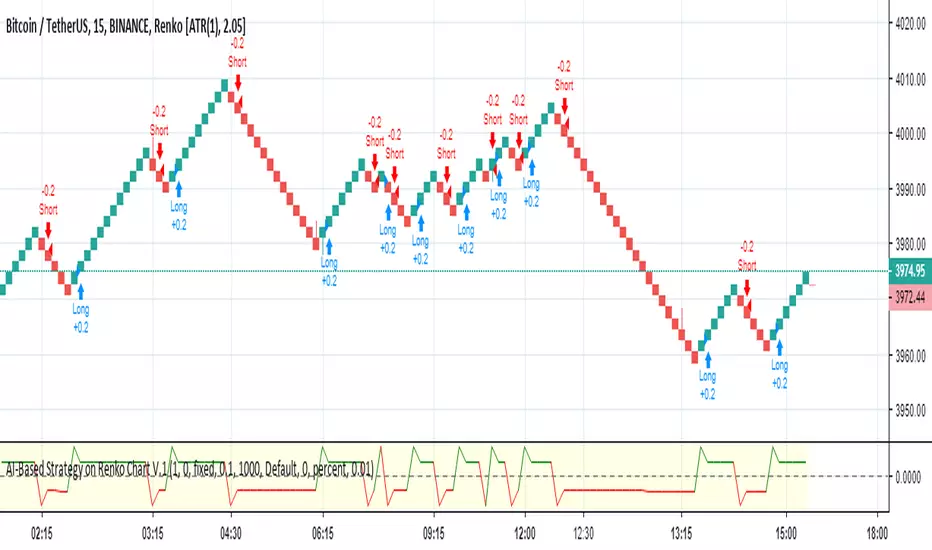
AI-Based Strategy on Renko Chart V.1This is a Strategy based on Artificial Intelligence (AI) algorithms which can be used as a decision support system.
How to use:
1- Select the Renko chart.
2- Set "ATR Length" on settings window to "1". Settings can be seen after right click on the chart.
3- Use arbitrary time frame.
TB!G-Scalp Strategy [Alert]Scalping Crypto Assets Made Easy
TB!G-Scalp is a TradingView based alert and accompanying strategy PineV3 Script.
Backtest vs Realtime
When designing the algorithms for this strategy our focus was primarily on ease of use.This results in a beautiful yet easy to use scalping strategy. As input it takes a chart period and only one extra parameter for fine tuning. The backtest results are an accurate representation of it’s real-time behaviour.
What makes it tick?
Over the last 2 years we collected a lot of market data regarding Bull and Bear behaviours. This previous market behaviour echo’s into the current market trend.
By recognising these echo’s we are able to anticipate an upcoming micro reversal which eventually end up being a scalping strategy.
Interested
Access is provided to a limited amount of people and for the duration that is determined by it’s Alpha Decay Rate.
This ADR is expected to become problematic after 2.3 year of usage on a lot of 150 users.

TB!G-Scalp Strategy [Backtest]Scalping Crypto Assets Made Easy
TB!G-Scalp is a TradingView based alert and accompanying strategy PineV3 Script.
Backtest vs Realtime
When designing the algorithms for this strategy our focus was primarily on ease of use.This results in a beautiful yet easy to use scalping strategy. As input it takes a chart period and only one extra parameter for fine tuning. The backtest results are an accurate representation of it’s real-time behaviour.
What makes it tick?
Over the last 2 years we collected a lot of market data regarding Bull and Bear behaviours. This previous market behaviour echo’s into the current market trend.
By recognising these echo’s we are able to anticipate an upcoming micro reversal which eventually end up being a scalping strategy.
Interested
Access is provided to a limited amount of people and for the duration that is determined by it’s Alpha Decay Rate.
This ADR is expected to become problematic after 2.3 year of usage on a lot of 150 users.

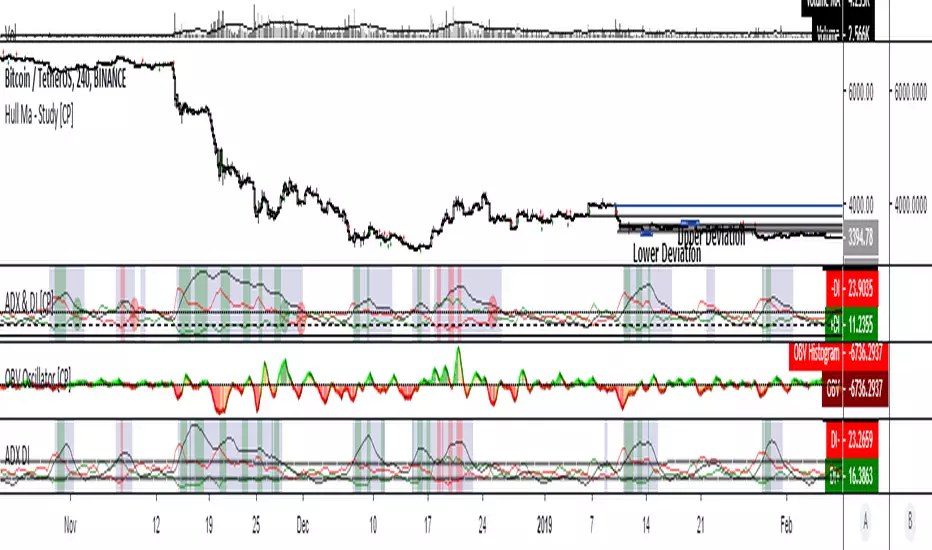
ADX & DI with Long + Short ConditionsMy version of the ADX & DI Indicator with an extra theshold and adjustable long and short conditions.
A green background (long) will appear when the ADX is rising, the DI+ is falling and the DI+ is below the (new) lower threshold.
A red background (short) will appear when the ADX is rising, the DI- is falling and the DI- is below the (new) lower treshold.
You can adjust the tolerance for the lower threshold in the settings of the indicator.
HLC Banded Quadratic RegressionHigh/Low/Close Banded Quadratic Regression is now available through this implementation, free for all to use. It's simple purpose is to plot multiple independent parabolic curvatures using a matrix equation that best fits the non-linear data sets of high, low, and close. Features include an available dark background disabled by default for the overlay chart, adjustable regression period, and a banding lines width adjustment. If you have any comments regarding this indicator, I will consider your thoughts and ideas presented below.

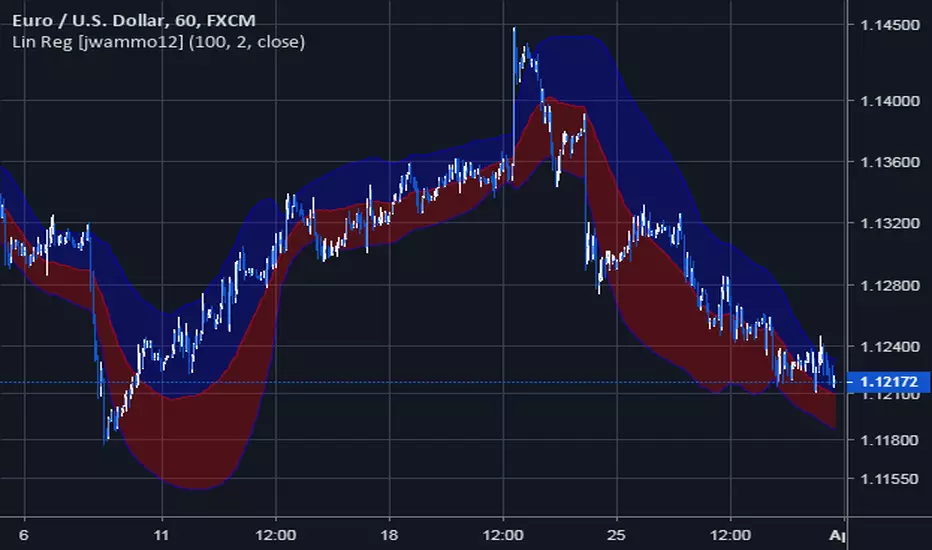
Linear Regression Channel [jwammo12]This is a non-repaint version of the built-in linear regression indicator in pine. It creates moving bands where the current bar matches the built-in Linear Regression indicator exactly (see screenshot). The key to replicating the built-in function is calculating the std deviation across the length of bars away from the current Linear Regression line, as opposed to the linear regression line that would have been calculated at the historic bar.
AI-Based Strategy V.1
This is a Strategy based on Artificial Intelligence (AI) algorithms which can be used (alone or along with other strategies) as a decision support system.
How to use:
1- The default values of Input 1, Input 2, R, and T for ETHUSDT are “Close”, “ohlc4”, 180, and 0.1325 respectively. They can be changed to achieve the best performance for ETHUSDT or other symbols.
2- Use one of the time frames 15 to 3m.
3. When the background is green buy, and when the background is red sell.
linreg-areas (like fib system just more accurate) So this system is a different approach to form a daily fib like system.
Its based on linear regression and its slope , we calculate the slope of the line and we put it in MTF format that is without security and non repainting (int2=1440 min)
As you in graph the coin in this case BTC has cycle from low to high similar to the fibs system.
the lowest level is bellow -0.2 , next level is -0.1 ,0,0.1 and above 0.2 is consider the highest
with this system its easy to find the highs and the lows as the coin go between the levels either up or down like the fibs system.
one can use this together with fibs system in order to make analysis more accurate.
also it easy to set signals once the slope go between levels either up or down . another advantage for this system compare to fibs system is the ability to reduce the MTF to lower frame let say 4 hour or even less and then by the same logic to create system of high and lows to the most smaller frames (but if you do that you need in code to change the levels setting numbers so it fit the best )
follow the direction of the slope and you will find the road that you wish:))

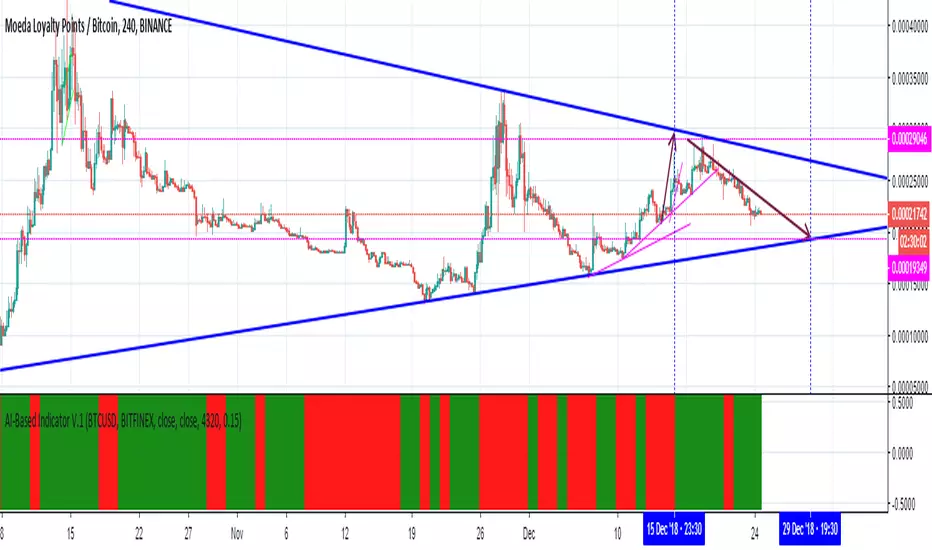
AI-Based Indicator V.1This is an indicator based on Artificial Intelligence (AI) algorithms which can be used (alone or along with other indicators) as a decision support system.
How to use:
1- The default values of Input 1, Input 2, R, and T for BTCUSD are “Close”, “Close”, 4320, and 0.15 respectively. They can be changed to achieve the best performance for BTCUSD or other tickers.
2- Use one of the time frames 4H to 15m.
3. When the background is green buy, and when the background is red sell.