Strongest TrendlineUnleashing the Power of Trendlines with the "Strongest Trendline" Indicator.
Trendlines are an invaluable tool in technical analysis, providing traders with insights into price movements and market trends. The "Strongest Trendline" indicator offers a powerful approach to identifying robust trendlines based on various parameters and technical analysis metrics.
When using the "Strongest Trendline" indicator, it is recommended to utilize a logarithmic scale . This scale accurately represents percentage changes in price, allowing for a more comprehensive visualization of trends. Logarithmic scales highlight the proportional relationship between prices, ensuring that both large and small price movements are given due consideration.
One of the notable advantages of logarithmic scales is their ability to balance price movements on a chart. This prevents larger price changes from dominating the visual representation, providing a more balanced perspective on the overall trend. Logarithmic scales are particularly useful when analyzing assets with significant price fluctuations.
In some cases, traders may need to scroll back on the chart to view the trendlines generated by the "Strongest Trendline" indicator. By scrolling back, traders ensure they have a sufficient historical context to accurately assess the strength and reliability of the trendline. This comprehensive analysis allows for the identification of trendline patterns and correlations between historical price movements and current market conditions.
The "Strongest Trendline" indicator calculates trendlines based on historical data, requiring an adequate number of data points to identify the strongest trend. By scrolling back and considering historical patterns, traders can make more informed trading decisions and identify potential entry or exit points.
When using the "Strongest Trendline" indicator, a higher Pearson's R value signifies a stronger trendline. The closer the Pearson's R value is to 1, the more reliable and robust the trendline is considered to be.
In conclusion, the "Strongest Trendline" indicator offers traders a robust method for identifying trendlines with significant predictive power. By utilizing a logarithmic scale and considering historical data, traders can unleash the full potential of this indicator and gain valuable insights into price trends. Trendlines, when used in conjunction with other technical analysis tools, can help traders make more informed decisions in the dynamic world of financial markets.
Regressione lineare

Volume Profile Regression Channel [LuxAlgo]The Volume Profile Regression Channel calculates a volume profile from an anchored linear regression channel. Users can choose the starting and ending points for the indicator calculation interval.
Like a regular volume profile, a "line" of control (LOC), value area, and a developing LOC are displayed.
🔶 SETTINGS
Sections: The number of sections the linear regression channel is divided into for the calculation of the volume profile.
Width %: Determines the length of the profile within the channel relative to the channel length.
Value Area %: Highlights the sections starting from the POC whose accumulated volume is equal to the user-defined percentage of the total profile sections volume.
🔶 USAGES
Regular volume profiles are often constructed from a horizontal price area, this can allow highlighting price areas where most trading activity takes place.
However, when price is strongly trending a classical volume profile can sometimes be more uniform. This is where using an angled volume profile can be useful.
The line of control allows highlighting the section of the channel with the most accumulated volume, this line can be used as a potential future support/resistance. This is where an angled volume profile might be the most useful.
The developing LOC highlights the LOC location at a specific time within the profile (from left to right) and can sometimes provide an estimate of the underlying trend in the price.
🔶 DETAILS
To be computed the script requires a left and right chart time coordinates. When adding the script to their charts users can determine the left and right time coordinates by clicking on the chart.
The linear regression channel width is determined so that the channel precisely encompasses the whole price.
🔶 LIMITATIONS
Using a very large calculation interval can return timeouts. Users can reduce the calculation interval to fix that issue from occurring.
The amount of drawing objects that can be used is limited, as such using a high calculation interval can display an incomplete profile.
🔶 ACKNOWLEDGEMENTS
If you are interested in these types of scripts, @HeWhoMustNotBeNamed published a similar script where users can use a custom line angle. See his 'Angled Volume Profile' script from March 2023.

Ultimate Trend LineThe "Ultimate Trend Line" indicator, designed for overlay on financial charts, calculates and plots a global trend line. It works by first allowing users to input several parameters such as different lengths for up to 21 groups, a multiplier that defines the deviation from the linear regression line for calculating the upper and lower bands, and a color for the fill.
Using these inputs, it calculates the upper and lower bands for each length group based on a multiple of the standard deviation from the linear regression line. It then averages these bands to define the global trend line, which is plotted on the graph.
Although the code includes commented-out lines for plotting each individual upper and lower band, the indicator as it stands only displays the overall average trend line. The line's color and linewidth can be adjusted according to user preferences.
This indicator can be effectively used on both logarithmic and linear scales. This versatility allows it to be adaptable to various types of financial charts and trading styles, providing a flexible tool for users to assess and visualize trend patterns across different market conditions and time frames. It maintains its accuracy and relevance, regardless of the scale used, thus making it a comprehensive solution for trend line analysis in diverse scenarios.
It's important to note that the "Ultimate Trend Line" indicator requires a substantial amount of historical data to function properly. If insufficient historical data is available, the indicator may not display accurately or at all. This issue is particularly prevalent when using larger time units, such as weekly or monthly charts, where the available data may not stretch back far enough to satisfy the requirements of the indicator. As such, users should ensure they are operating on a time scale and data set that provides adequate historical depth for the reliable operation of this indicator.

TrueLevel BandsTrueLevel Bands is a powerful trading indicator that employs linear regression and standard deviation to create dynamic, envelope-style bands around the price action of a financial instrument. These bands are designed to help traders identify potential support and resistance levels, trend direction, and volatility.
The TrueLevel Bands indicator consists of multiple envelope bands, each constructed using different timeframes or lengths, and a multiple (mult) factor. The multiple factor determines the width of the bands by adjusting the number of standard deviations from the linear regression line.
Key Features of TrueLevel Bands
1. Multi-Timeframe Analysis: Unlike traditional moving average-based indicators, TrueLevel Bands allow traders to incorporate multiple timeframes into their analysis. This helps traders capture both short-term and long-term market dynamics, offering a more comprehensive understanding of price behavior.
2. Customization: The TrueLevel Bands indicator offers a high level of customization, allowing traders to adjust the lengths and multiple factors to suit their trading style and preferences. This flexibility enables traders to fine-tune the indicator to work optimally with various instruments and market conditions.
3. Adaptive Volatility: By incorporating standard deviation, TrueLevel Bands can automatically adjust to changing market volatility. This feature enables the bands to expand during periods of high volatility and contract during periods of low volatility, providing traders with a more accurate representation of market dynamics.
4. Dynamic Support and Resistance Levels: TrueLevel Bands can help traders identify dynamic support and resistance levels, as the bands adjust in real-time according to price action. This can be particularly useful for traders looking to enter or exit positions based on support and resistance levels.
5. The "Global Trend Line" refers to the average of the bands used to indicate the overall trend.
Why TrueLevel Bands are Different from Classic Moving Averages
TrueLevel Bands differ from conventional moving averages in several ways:
1. Linear Regression: While moving averages are based on simple arithmetic means, TrueLevel Bands use linear regression to determine the centerline. This offers a more accurate representation of the trend and helps traders better assess potential entry and exit points.
2. Envelope Style Bands: Unlike moving averages, which are single lines, TrueLevel Bands form envelope-style bands around the price action. This provides traders with a visual representation of potential support and resistance levels, trend direction, and volatility.
3. Multi-Timeframe Analysis: Classic moving averages typically focus on a single timeframe. In contrast, TrueLevel Bands incorporate multiple timeframes, enabling traders to capture a broader understanding of market dynamics.
4. Adaptive Volatility: Traditional moving averages do not account for changing market volatility, whereas TrueLevel Bands automatically adjust to volatility shifts through the use of standard deviation.
The TrueLevel Bands indicator is a powerful, versatile tool that offers traders a unique approach to technical analysis. With its ability to adapt to changing market conditions, provide multi-timeframe analysis, and dynamic support and resistance levels, TrueLevel Bands can serve as an invaluable asset to both novice and experienced traders looking to gain an edge in the markets.

Advanced Trend Detection StrategyThe Advanced Trend Detection Strategy is a sophisticated trading algorithm based on the indicator "Percent Levels From Previous Close".
This strategy is based on calculating the Pearson's correlation coefficient of logarithmic-scale linear regression channels across a range of lengths from 50 to 1000. It then selects the highest value to determine the length for the channel used in the strategy, as well as for the computation of the Simple Moving Average (SMA) that is incorporated into the strategy.
In this methodology, a script is applied to an equity in which multiple length inputs are taken into consideration. For each of these lengths, the slope, average, and intercept are calculated using logarithmic values. Deviation, the Pearson's correlation coefficient, and upper and lower deviations are also computed for each length.
The strategy then selects the length with the highest Pearson's correlation coefficient. This selected length is used in the channel of the strategy and also for the calculation of the SMA. The chosen length is ultimately the one that best fits the logarithmic regression line, as indicated by the highest Pearson's correlation coefficient.
In short, this strategy leverages the power of Pearson's correlation coefficient in a logarithmic scale linear regression framework to identify optimal trend channels across a broad range of lengths, assisting traders in making more informed decisions.
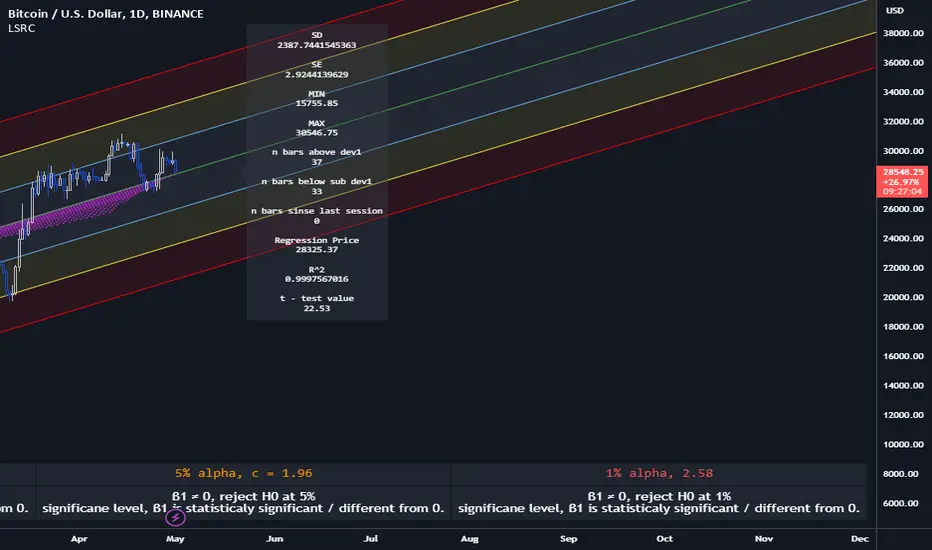
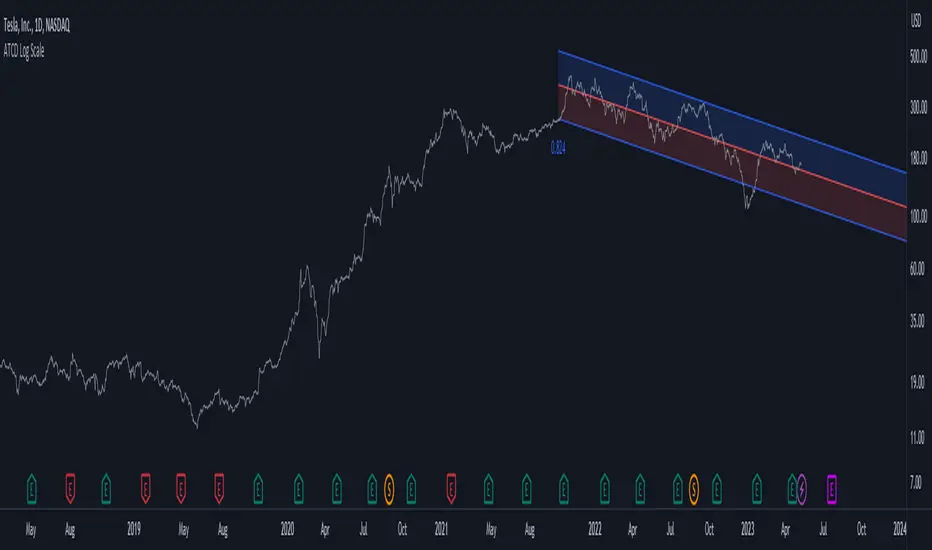
Advanced Trend Channel Detection (Log Scale)The Advanced Trend Channel Detection (Log Scale) indicator is designed to identify the strongest trend channels using logarithmic scaling. It does this by calculating the highest Pearson's R value among all length inputs and then determining which length input to use for the selected slope, average, and intercept. The script then draws the upper and lower deviation lines on the chart based on the selected slope, average, and intercept, and optionally displays the Pearson's R value.
To use this indicator, you will need to switch to logarithmic scale. There are several advantages to using logarithmic scale over regular scale. Firstly, logarithmic scale provides a better visualization of data that spans multiple orders of magnitude by compressing large ranges of values into a smaller space. Secondly, logarithmic scale can help to minimize the impact of outliers, making it easier to identify patterns and trends in the data. Finally, logarithmic scale is often utilized in scientific contexts as it can reveal relationships between variables that may not be visible on a linear scale.
If the trend channel does not appear on the chart, it may be necessary to scroll back to view historical data. The indicator uses past price data to calculate the trend channel, so if there is not enough historical data visible on the chart, the indicator may not be able to identify the trend channel. In this case, the user should adjust the chart's timeframe or zoom out to view more historical data. Additionally, the indicator may need to be recalibrated if there is a significant shift in market conditions or if the selected length input is no longer appropriate.
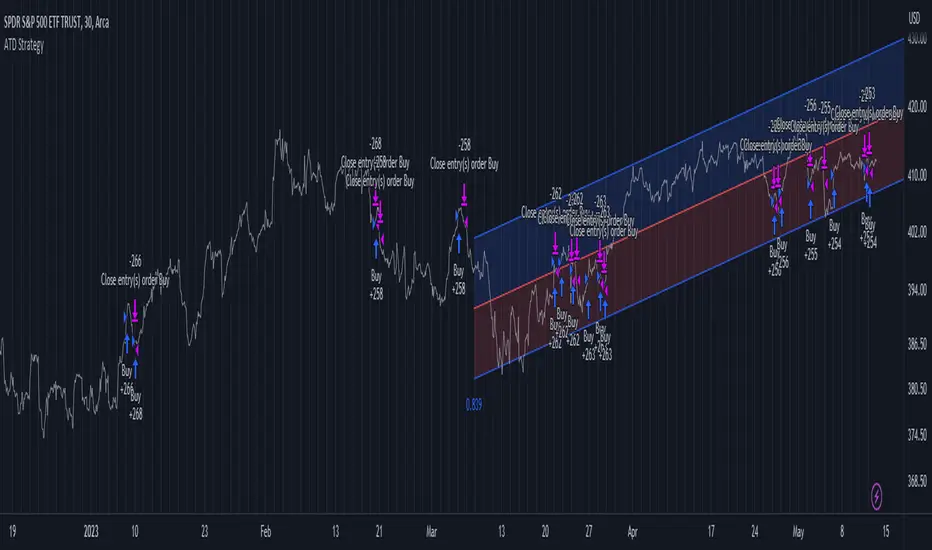
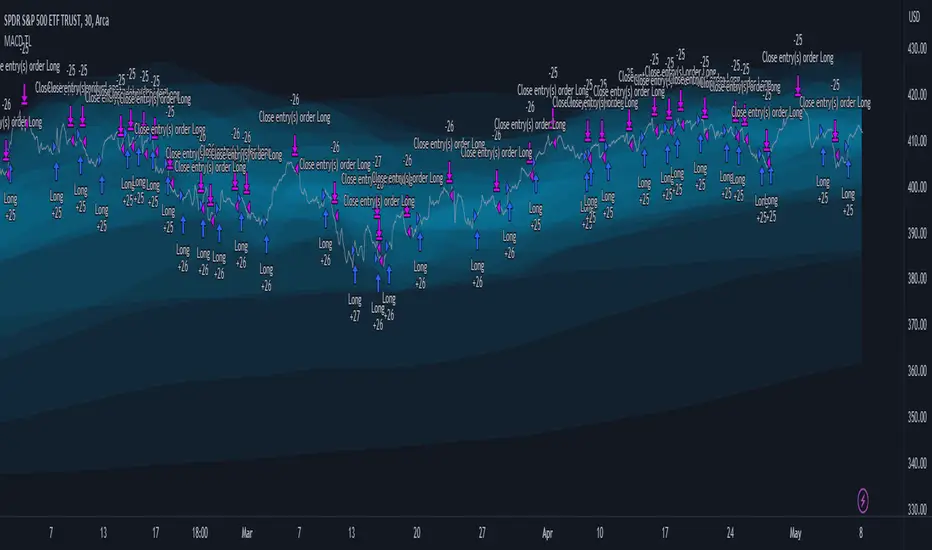
MACD TrueLevel StrategyThis strategy uses the MACD indicator to determine buy and sell signals. In addition, the strategy employs the use of "TrueLevel Bands," which are essentially envelope bands that are calculated based on the linear regression and standard deviation of the price data over various lengths.
The TrueLevel Bands are calculated for 14 different lengths and are plotted on the chart as lines. The bands are filled with a specified color to make them more visible. The highest upper band and lowest lower band values are stored in variables for easy access.
The user can input the lengths for the TrueLevel Bands and adjust the multiplier for the standard deviation. They can also select the bands they want to use for entry and exit, and enable long and short positions.
The entry conditions for a long position are either a crossover of the MACD line over the signal line or a crossover of the price over the selected entry lower band. The entry conditions for a short position are either a crossunder of the MACD line under the signal line or a crossunder of the price under the selected exit upper band.
The exit conditions for both long and short positions are not specified in the code and are left to the user to define.
Overall, the strategy aims to capture trends by entering long or short positions based on the MACD and TrueLevel Bands, and exiting those positions when the trend reverses.
Deming Linear Regression [wbburgin]Deming regression is a type of linear regression used to model the relationship between two variables when there is variability in both variables. Deming regression provides a solution by simultaneously accounting for the variability in both the independent and dependent variables, resulting in a more accurate estimation of the underlying relationship. In the hard-science fields, where measurements are critically important to judging the conclusions drawn from data, Deming regression can be used to account for measurement error.
Tradingview's default linear regression indicator (the ta.linreg() function) uses least squares linear regression, which is similar but different than Deming regression. In least squares regression, the regression function minimizes the sum of the squared vertical distances between the data points and the fitted line. This method assumes that the errors or variability are only present in the y-values (dependent variable), and that the x-values (independent variable) are measured without error.
In time series data used in trading, Deming regression can be more accurate than least squares regression because the ratio of the variances of the x and y variables is large. X is the bar index, which is an incrementally-increasing function that has little variance, while Y is the price data, which has extremely high variance when compared to the bar index. In such situations, least squares regression can be heavily influenced by outliers or extreme points in the data, whereas Deming regression is more resistant to such influence.
Additionally, if your x-axis uses variable widths - such as renko blocks or other types of non-linear widths - Deming regression might be more effective than least-squares linear regression because it accounts for the variability in your x-values as well. Additionally, if you are creating a machine-learning model that uses linear regression to filter or extrapolate data, this regression method may be more accurate than least squares.
In contrast to least squares regression, Deming regression takes into account the variability or errors in both the x- and y-values. It minimizes the sum of the squared perpendicular distances between the data points and the fitted line, accounting for both the x- and y-variability. This makes Deming regression more robust in both variables than least squares regression.

RSI TrueLevel StrategyThis strategy is a momentum-based strategy that uses the Relative Strength Index (RSI) indicator and a TrueLevel envelope to generate trade signals.
The strategy uses user-defined input parameters to calculate TrueLevel envelopes for 14 different lengths. The TrueLevel envelope is a volatility-based technical indicator that consists of upper and lower bands. The upper band is calculated by adding a multiple of the standard deviation to a linear regression line of the price data, while the lower band is calculated by subtracting a multiple of the standard deviation from the same regression line.
The strategy generates long signals when the RSI crosses above the oversold level or when the price crosses above the selected lower band of the TrueLevel envelope. It generates short signals when the RSI crosses below the overbought level or when the price crosses below the selected upper band of the TrueLevel envelope.
The strategy allows for long and short trades and sets the trade size as a percentage of the account equity. The colors of the bands and fills are also customizable through user-defined input parameters.
In this strategy, the 12th TrueLevel band was chosen due to its ability to capture significant price movements while still providing a reasonable level of noise reduction. The strategy utilizes a total of 14 TrueLevel bands, each with varying lengths. The 12th band, with a length of 2646, strikes a balance between sensitivity to market changes and reducing false signals, making it a suitable choice for this strategy.
RSI Parameters:
In this strategy, the RSI overbought and oversold levels are set at 65 and 40, respectively. These values were chosen to filter out more noise in the market and focus on stronger trends. Traditional RSI overbought and oversold levels are set at 70 and 30, respectively. By raising the oversold level and lowering the overbought level, the strategy aims to identify more significant trend reversals and potential trade opportunities.
Of course, the parameters can be adjusted to suit individual preferences.

Know the trend - KTT---------- ENGLISH -----------
This indicator combines the values of four common indicators (MACD, MACD signal, normalized RSI and linear regression) to provide a unified view of the market trend. The indicator calculates the average of the rescaled values of these four indicators and plots it on the chart as a line that changes color based on its position relative to 0. If the line is above 0, it is colored black to indicate a bullish trend. If the line is below 0, it is colored red to indicate a bearish trend. The user can enter a value for the length of the indicator to customize the time period used for calculating the underlying indicators. The indicator works on any time frame.
---------- ITALIANO -----------
Questo indicatore combina i valori di quattro indicatori comuni (MACD, segnale MACD, RSI normalizzato e regressione lineare) per fornire una visione unificata del trend del mercato. L’indicatore calcola la media dei valori riscalati di questi quattro indicatori e la disegna sul grafico come una linea che cambia colore in base alla sua posizione rispetto allo 0. Se la linea è sopra lo 0, viene colorata di nero per indicare un trend rialzista. Se la linea è sotto lo 0, viene colorata di rosso per indicare un trend ribassista. L’utente può inserire un valore per la lunghezza dell’indicatore per personalizzare il periodo di tempo utilizzato per il calcolo degli indicatori sottostanti. L’indicatore funziona su ogni time frame.

Regression Channel Alternative MTF V2█ OVERVIEW
This indicator is a predecessor to Regression Channel Alternative MTF , which is coded based on latest update of type, object and method.
█ IMPORTANT NOTES
This indicator is NOT true Multi Timeframe (MTF) but considered as Alternative MTF which calculate 100 bars for Primary MTF, can be refer from provided line helper.
The timeframe scenarios are defined based on Position, Swing and Intraday Trader.
Suppported Timeframe : W, D, 60, 15, 5 and 1.
Channel drawn based on regression calculation.
Angle channel is NOT supported.
█ INSPIRATIONS
These timeframe scenarios are defined based on Harmonic Trading : Volume Three written by Scott M Carney.
By applying channel on each timeframe, MW or ABCD patterns can be easily identified manually.
This can also be applied on other chart patterns.
█ CREDITS
Scott M Carney, Harmonic Trading : Volume Three (Reaction vs. Reversal)
█ TIMEFRAME EXPLAINED
Higher / Distal : The (next) longer or larger comparative timeframe after primary pattern has been identified.
Primary / Clear : Timeframe that possess the clearest pattern structure.
Lower / Proximate : The (next) shorter timeframe after primary pattern has been identified.
Lowest : Check primary timeframe as main reference.
█ FEATURES
Color is determined by trend or timeframe.
Some color is depends on chart contrast color.
Color is determined by trend or timeframe.
█ EXAMPLE OF USAGE / EXPLAINATION

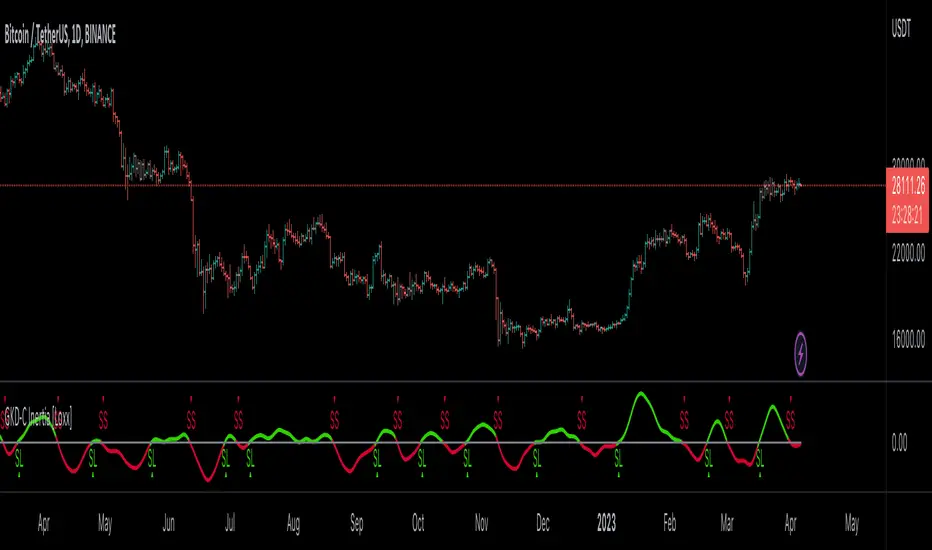
GKD-C Inertia [Loxx]Giga Kaleidoscope GKD-C Inertia is a Confirmation module included in Loxx's "Giga Kaleidoscope Modularized Trading System".
█ Giga Kaleidoscope Modularized Trading System
What is Loxx's "Giga Kaleidoscope Modularized Trading System"?
The Giga Kaleidoscope Modularized Trading System is a trading system built on the philosophy of the NNFX (No Nonsense Forex) algorithmic trading.
What is the NNFX algorithmic trading strategy?
The NNFX (No-Nonsense Forex) trading system is a comprehensive approach to Forex trading that is designed to simplify the process and remove the confusion and complexity that often surrounds trading. The system was developed by a Forex trader who goes by the pseudonym "VP" and has gained a significant following in the Forex community.
The NNFX trading system is based on a set of rules and guidelines that help traders make objective and informed decisions. These rules cover all aspects of trading, including market analysis, trade entry, stop loss placement, and trade management.
Here are the main components of the NNFX trading system:
1. Trading Philosophy: The NNFX trading system is based on the idea that successful trading requires a comprehensive understanding of the market, objective analysis, and strict risk management. The system aims to remove subjective elements from trading and focuses on objective rules and guidelines.
2. Technical Analysis: The NNFX trading system relies heavily on technical analysis and uses a range of indicators to identify high-probability trading opportunities. The system uses a combination of trend-following and mean-reverting strategies to identify trades.
3. Market Structure: The NNFX trading system emphasizes the importance of understanding the market structure, including price action, support and resistance levels, and market cycles. The system uses a range of tools to identify the market structure, including trend lines, channels, and moving averages.
4. Trade Entry: The NNFX trading system has strict rules for trade entry. The system uses a combination of technical indicators to identify high-probability trades, and traders must meet specific criteria to enter a trade.
5. Stop Loss Placement: The NNFX trading system places a significant emphasis on risk management and requires traders to place a stop loss order on every trade. The system uses a combination of technical analysis and market structure to determine the appropriate stop loss level.
6. Trade Management: The NNFX trading system has specific rules for managing open trades. The system aims to minimize risk and maximize profit by using a combination of trailing stops, take profit levels, and position sizing.
Overall, the NNFX trading system is designed to be a straightforward and easy-to-follow approach to Forex trading that can be applied by traders of all skill levels.
Core components of an NNFX algorithmic trading strategy
The NNFX algorithm is built on the principles of trend, momentum, and volatility. There are six core components in the NNFX trading algorithm:
1. Volatility - price volatility; e.g., Average True Range, True Range Double, Close-to-Close, etc.
2. Baseline - a moving average to identify price trend
3. Confirmation 1 - a technical indicator used to identify trends
4. Confirmation 2 - a technical indicator used to identify trends
5. Continuation - a technical indicator used to identify trends
6. Volatility/Volume - a technical indicator used to identify volatility/volume breakouts/breakdown
7. Exit - a technical indicator used to determine when a trend is exhausted
What is Volatility in the NNFX trading system?
In the NNFX (No Nonsense Forex) trading system, ATR (Average True Range) is typically used to measure the volatility of an asset. It is used as a part of the system to help determine the appropriate stop loss and take profit levels for a trade. ATR is calculated by taking the average of the true range values over a specified period.
True range is calculated as the maximum of the following values:
-Current high minus the current low
-Absolute value of the current high minus the previous close
-Absolute value of the current low minus the previous close
ATR is a dynamic indicator that changes with changes in volatility. As volatility increases, the value of ATR increases, and as volatility decreases, the value of ATR decreases. By using ATR in NNFX system, traders can adjust their stop loss and take profit levels according to the volatility of the asset being traded. This helps to ensure that the trade is given enough room to move, while also minimizing potential losses.
Other types of volatility include True Range Double (TRD), Close-to-Close, and Garman-Klass
What is a Baseline indicator?
The baseline is essentially a moving average, and is used to determine the overall direction of the market.
The baseline in the NNFX system is used to filter out trades that are not in line with the long-term trend of the market. The baseline is plotted on the chart along with other indicators, such as the Moving Average (MA), the Relative Strength Index (RSI), and the Average True Range (ATR).
Trades are only taken when the price is in the same direction as the baseline. For example, if the baseline is sloping upwards, only long trades are taken, and if the baseline is sloping downwards, only short trades are taken. This approach helps to ensure that trades are in line with the overall trend of the market, and reduces the risk of entering trades that are likely to fail.
By using a baseline in the NNFX system, traders can have a clear reference point for determining the overall trend of the market, and can make more informed trading decisions. The baseline helps to filter out noise and false signals, and ensures that trades are taken in the direction of the long-term trend.
What is a Confirmation indicator?
Confirmation indicators are technical indicators that are used to confirm the signals generated by primary indicators. Primary indicators are the core indicators used in the NNFX system, such as the Average True Range (ATR), the Moving Average (MA), and the Relative Strength Index (RSI).
The purpose of the confirmation indicators is to reduce false signals and improve the accuracy of the trading system. They are designed to confirm the signals generated by the primary indicators by providing additional information about the strength and direction of the trend.
Some examples of confirmation indicators that may be used in the NNFX system include the Bollinger Bands, the MACD (Moving Average Convergence Divergence), and the MACD Oscillator. These indicators can provide information about the volatility, momentum, and trend strength of the market, and can be used to confirm the signals generated by the primary indicators.
In the NNFX system, confirmation indicators are used in combination with primary indicators and other filters to create a trading system that is robust and reliable. By using multiple indicators to confirm trading signals, the system aims to reduce the risk of false signals and improve the overall profitability of the trades.
What is a Continuation indicator?
In the NNFX (No Nonsense Forex) trading system, a continuation indicator is a technical indicator that is used to confirm a current trend and predict that the trend is likely to continue in the same direction. A continuation indicator is typically used in conjunction with other indicators in the system, such as a baseline indicator, to provide a comprehensive trading strategy.
What is a Volatility/Volume indicator?
Volume indicators, such as the On Balance Volume (OBV), the Chaikin Money Flow (CMF), or the Volume Price Trend (VPT), are used to measure the amount of buying and selling activity in a market. They are based on the trading volume of the market, and can provide information about the strength of the trend. In the NNFX system, volume indicators are used to confirm trading signals generated by the Moving Average and the Relative Strength Index. Volatility indicators include Average Direction Index, Waddah Attar, and Volatility Ratio. In the NNFX trading system, volatility is a proxy for volume and vice versa.
By using volume indicators as confirmation tools, the NNFX trading system aims to reduce the risk of false signals and improve the overall profitability of trades. These indicators can provide additional information about the market that is not captured by the primary indicators, and can help traders to make more informed trading decisions. In addition, volume indicators can be used to identify potential changes in market trends and to confirm the strength of price movements.
What is an Exit indicator?
The exit indicator is used in conjunction with other indicators in the system, such as the Moving Average (MA), the Relative Strength Index (RSI), and the Average True Range (ATR), to provide a comprehensive trading strategy.
The exit indicator in the NNFX system can be any technical indicator that is deemed effective at identifying optimal exit points. Examples of exit indicators that are commonly used include the Parabolic SAR, the Average Directional Index (ADX), and the Chandelier Exit.
The purpose of the exit indicator is to identify when a trend is likely to reverse or when the market conditions have changed, signaling the need to exit a trade. By using an exit indicator, traders can manage their risk and prevent significant losses.
In the NNFX system, the exit indicator is used in conjunction with a stop loss and a take profit order to maximize profits and minimize losses. The stop loss order is used to limit the amount of loss that can be incurred if the trade goes against the trader, while the take profit order is used to lock in profits when the trade is moving in the trader's favor.
Overall, the use of an exit indicator in the NNFX trading system is an important component of a comprehensive trading strategy. It allows traders to manage their risk effectively and improve the profitability of their trades by exiting at the right time.
How does Loxx's GKD (Giga Kaleidoscope Modularized Trading System) implement the NNFX algorithm outlined above?
Loxx's GKD v1.0 system has five types of modules (indicators/strategies). These modules are:
1. GKD-BT - Backtesting module (Volatility, Number 1 in the NNFX algorithm)
2. GKD-B - Baseline module (Baseline and Volatility/Volume, Numbers 1 and 2 in the NNFX algorithm)
3. GKD-C - Confirmation 1/2 and Continuation module (Confirmation 1/2 and Continuation, Numbers 3, 4, and 5 in the NNFX algorithm)
4. GKD-V - Volatility/Volume module (Confirmation 1/2, Number 6 in the NNFX algorithm)
5. GKD-E - Exit module (Exit, Number 7 in the NNFX algorithm)
(additional module types will added in future releases)
Each module interacts with every module by passing data between modules. Data is passed between each module as described below:
GKD-B => GKD-V => GKD-C(1) => GKD-C(2) => GKD-C(Continuation) => GKD-E => GKD-BT
That is, the Baseline indicator passes its data to Volatility/Volume. The Volatility/Volume indicator passes its values to the Confirmation 1 indicator. The Confirmation 1 indicator passes its values to the Confirmation 2 indicator. The Confirmation 2 indicator passes its values to the Continuation indicator. The Continuation indicator passes its values to the Exit indicator, and finally, the Exit indicator passes its values to the Backtest strategy.
This chaining of indicators requires that each module conform to Loxx's GKD protocol, therefore allowing for the testing of every possible combination of technical indicators that make up the six components of the NNFX algorithm.
What does the application of the GKD trading system look like?
Example trading system:
Backtest: Strategy with 1-3 take profits, trailing stop loss, multiple types of PnL volatility, and 2 backtesting styles
Baseline: Hull Moving Average
Volatility/Volume: Hurst Exponent
Confirmation 1: Inertia as shown on the chart above
Confirmation 2: Williams Percent Range
Continuation: Fisher Transform
Exit: Rex Oscillator
Each GKD indicator is denoted with a module identifier of either: GKD-BT, GKD-B, GKD-C, GKD-V, or GKD-E. This allows traders to understand to which module each indicator belongs and where each indicator fits into the GKD protocol chain.
Giga Kaleidoscope Modularized Trading System Signals (based on the NNFX algorithm)
Standard Entry
1. GKD-C Confirmation 1 Signal
2. GKD-B Baseline agrees
3. Price is within a range of 0.2x Volatility and 1.0x Volatility of the Goldie Locks Mean
4. GKD-C Confirmation 2 agrees
5. GKD-V Volatility/Volume agrees
Baseline Entry
1. GKD-B Baseline signal
2. GKD-C Confirmation 1 agrees
3. Price is within a range of 0.2x Volatility and 1.0x Volatility of the Goldie Locks Mean
4. GKD-C Confirmation 2 agrees
5. GKD-V Volatility/Volume agrees
6. GKD-C Confirmation 1 signal was less than 7 candles prior
Continuation Entry
1. Standard Entry, Baseline Entry, or Pullback; entry triggered previously
2. GKD-B Baseline hasn't crossed since entry signal trigger
3. GKD-C Confirmation Continuation Indicator signals
4. GKD-C Confirmation 1 agrees
5. GKD-B Baseline agrees
6. GKD-C Confirmation 2 agrees
1-Candle Rule Standard Entry
1. GKD-C Confirmation 1 signal
2. GKD-B Baseline agrees
3. Price is within a range of 0.2x Volatility and 1.0x Volatility of the Goldie Locks Mean
Next Candle:
1. Price retraced (Long: close < close or Short: close > close )
2. GKD-B Baseline agrees
3. GKD-C Confirmation 1 agrees
4. GKD-C Confirmation 2 agrees
5. GKD-V Volatility/Volume agrees
1-Candle Rule Baseline Entry
1. GKD-B Baseline signal
2. GKD-C Confirmation 1 agrees
3. Price is within a range of 0.2x Volatility and 1.0x Volatility of the Goldie Locks Mean
4. GKD-C Confirmation 1 signal was less than 7 candles prior
Next Candle:
1. Price retraced (Long: close < close or Short: close > close )
2. GKD-B Baseline agrees
3. GKD-C Confirmation 1 agrees
4. GKD-C Confirmation 2 agrees
5. GKD-V Volatility/Volume Agrees
PullBack Entry
1. GKD-B Baseline signal
2. GKD-C Confirmation 1 agrees
3. Price is beyond 1.0x Volatility of Baseline
Next Candle:
1. Price is within a range of 0.2x Volatility and 1.0x Volatility of the Goldie Locks Mean
3. GKD-C Confirmation 1 agrees
4. GKD-C Confirmation 2 agrees
5. GKD-V Volatility/Volume Agrees
█ GKD-C Inertia
What is the Relative Vigor Index?
The Relative Vigor Index (RVI) is a technical analysis indicator used to measure the strength of a trend in financial markets. It was developed by John Ehlers and first introduced in his book "Cybernetic Analysis for Stocks and Futures" in 2004.
The RVI indicator is based on the concept that the strength of a trend can be measured by comparing the closing price of an asset to its opening price, and then smoothing out the resulting data with an exponential moving average (EMA). The indicator is calculated using the following steps:
Calculate the difference between the closing price and the opening price for a given period.
Calculate the high-low range for the same period.
Divide the difference in step 1 by the high-low range in step 2.
Calculate an EMA of the result obtained in step 3, usually using a period of 10.
The resulting RVI value oscillates around a centerline of 0. If the RVI value is positive, it indicates that the closing price is higher than the opening price and that the bullish momentum is increasing. If the RVI value is negative, it indicates that the closing price is lower than the opening price and that the bearish momentum is increasing.
Traders use the RVI indicator to identify changes in the momentum of a trend. When the RVI crosses above the centerline, it indicates that bullish momentum is increasing, and traders may look for opportunities to buy the asset. Conversely, when the RVI crosses below the centerline, it indicates that bearish momentum is increasing, and traders may look for opportunities to sell the asset.
It is important to note that the RVI is not a standalone indicator, and traders usually use it in conjunction with other technical analysis tools to confirm signals and make trading decisions.
What is The Least Squares Moving Average (LSMA)
The Least Squares Moving Average (LSMA) is a technical analysis indicator used to identify trends and momentum in financial markets. It is based on the concept of linear regression analysis, which is a statistical method used to estimate the relationship between two variables.
The LSMA indicator is calculated by fitting a linear regression line to the closing prices over a specified period of time. The slope of the regression line represents the trend, and the intercept represents the moving average. The LSMA indicator is a moving average of the regression line's intercept, and it is designed to be more responsive to changes in price than traditional moving averages.
The LSMA indicator is calculated using the following steps:
Determine the length of the moving average. This is the number of periods that will be used to calculate the LSMA.
Calculate the slope and intercept of the linear regression line for the closing prices over the specified period of time.
Calculate the LSMA using the intercept of the regression line and the length of the moving average.
Traders use the LSMA indicator to identify trends and momentum in financial markets. When the LSMA is moving upward, it indicates an uptrend, and traders may look for opportunities to buy the asset. Conversely, when the LSMA is moving downward, it indicates a downtrend, and traders may look for opportunities to sell the asset.
It is important to note that the LSMA is not a standalone indicator, and traders usually use it in conjunction with other technical analysis tools to confirm signals and make trading decisions. Additionally, the LSMA indicator can be subject to false signals during periods of market volatility, so traders should use caution when interpreting its signals.
What is Inertia?
Inertia applies Jurik Smoothing halfway through the calculation process to filter out noise thereby producing a cleaner output signal.
What is Inertia?
This indicator is the LSMA of RVI. This is one of various types of inertia used primarily in Forex trading but can be used for any time series financial data.
Requirements
Inputs
Confirmation 1 and Solo Confirmation: GKD-V Volatility / Volume indicator
Confirmation 2: GKD-C Confirmation indicator
Outputs
Confirmation 2 and Solo Confirmation Complex: GKD-E Exit indicator
Confirmation 1: GKD-C Confirmation indicator
Continuation: GKD-E Exit indicator
Solo Confirmation Simple: GKD-BT Backtest strategy
Additional features will be added in future releases.
Autoregressive Covariance Oscillator by TenozenWell to be honest I don't know what to name this indicator lol. But anyway, here is my another original work! Gonna give some background of why I create this indicator, it's all pretty much a coincidence when I'm learning about time series analysis.
_ _ _ _ _ _ _ _ _ _ _ _ _ _ _ _ _ _ _ _ _ _ _ _ _ _ _ _ _ _ _ _ _ _ _ _ _
Well, the formula of Auto-covariance is:
E{(X(t)-(t) * (X(t-s)-(t-s))}= Y_s
But I don't multiply both values but rather subtract them:
E{(X(t)-(t) - (X(t-s)-(t-s))}= Y_s?
_ _ _ _ _ _ _ _ _ _ _ _ _ _ _ _ _ _ _ _ _ _ _ _ _ _ _ _ _ _ _ _ _ _ _ _ _
For arm_vald, the equation is as follows:
arm_vald = val_mu + mu_plus_lsm + et
val_mu --> mean of time series
mu_plus_lsm --> val_mu + LSM
et --> error term
As you can see, val_mu^2. I did this so the oscillator is much smoother.
_ _ _ _ _ _ _ _ _ _ _ _ _ _ _ _ _ _ _ _ _ _ _ _ _ _ _ _ _ _ _ _ _ _ _ _ _
After I get the value, I normalize them:
aco = Y_s? / arm_vald
So by this calculation, I get something like an oscillator!
(more details in the code)
_ _ _ _ _ _ _ _ _ _ _ _ _ _ _ _ _ _ _ _ _ _ _ _ _ _ _ _ _ _ _ _ _ _ _ _ _
So how to use this indicator? It's so easy! If the value is above 0, we gonna expect a bullish response, if the value is below 0, we gonna expect a bearish response; that simple. Be aware that you should wait for the price to be closed before executing a trade.
Well, try it out! So far this is the most powerful indicator that I've created, hope it's useful. Ciao.
(more updates for the indicator if needed)

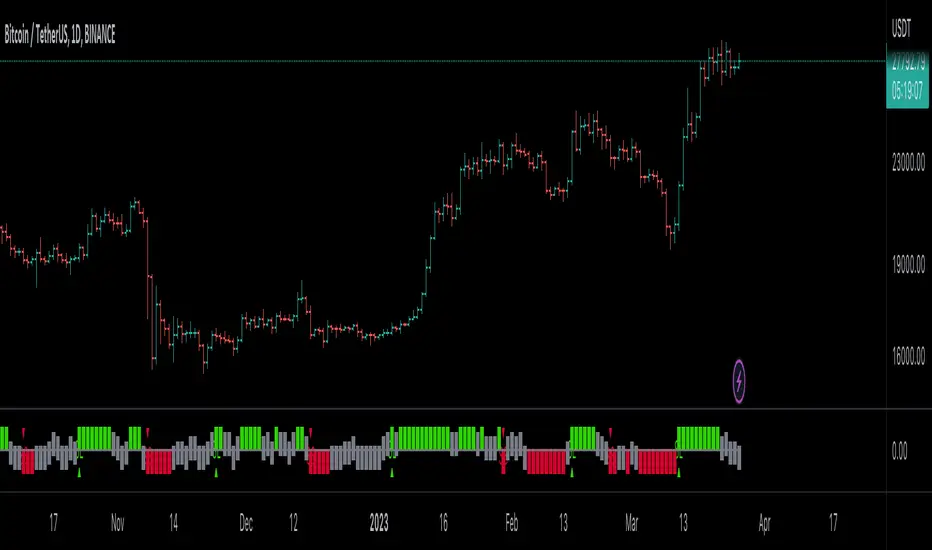
GKD-C Multi LSMA Slopes [Loxx]Giga Kaleidoscope GKD-C Multi LSMA Slopes is a Confirmation module included in Loxx's "Giga Kaleidoscope Modularized Trading System".
█ Giga Kaleidoscope Modularized Trading System
What is Loxx's "Giga Kaleidoscope Modularized Trading System"?
The Giga Kaleidoscope Modularized Trading System is a trading system built on the philosophy of the NNFX (No Nonsense Forex) algorithmic trading.
What is the NNFX algorithmic trading strategy?
The NNFX (No-Nonsense Forex) trading system is a comprehensive approach to Forex trading that is designed to simplify the process and remove the confusion and complexity that often surrounds trading. The system was developed by a Forex trader who goes by the pseudonym "VP" and has gained a significant following in the Forex community.
The NNFX trading system is based on a set of rules and guidelines that help traders make objective and informed decisions. These rules cover all aspects of trading, including market analysis, trade entry, stop loss placement, and trade management.
Here are the main components of the NNFX trading system:
1. Trading Philosophy: The NNFX trading system is based on the idea that successful trading requires a comprehensive understanding of the market, objective analysis, and strict risk management. The system aims to remove subjective elements from trading and focuses on objective rules and guidelines.
2. Technical Analysis: The NNFX trading system relies heavily on technical analysis and uses a range of indicators to identify high-probability trading opportunities. The system uses a combination of trend-following and mean-reverting strategies to identify trades.
3. Market Structure: The NNFX trading system emphasizes the importance of understanding the market structure, including price action, support and resistance levels, and market cycles. The system uses a range of tools to identify the market structure, including trend lines, channels, and moving averages.
4. Trade Entry: The NNFX trading system has strict rules for trade entry. The system uses a combination of technical indicators to identify high-probability trades, and traders must meet specific criteria to enter a trade.
5. Stop Loss Placement: The NNFX trading system places a significant emphasis on risk management and requires traders to place a stop loss order on every trade. The system uses a combination of technical analysis and market structure to determine the appropriate stop loss level.
6. Trade Management: The NNFX trading system has specific rules for managing open trades. The system aims to minimize risk and maximize profit by using a combination of trailing stops, take profit levels, and position sizing.
Overall, the NNFX trading system is designed to be a straightforward and easy-to-follow approach to Forex trading that can be applied by traders of all skill levels.
Core components of an NNFX algorithmic trading strategy
The NNFX algorithm is built on the principles of trend, momentum, and volatility. There are six core components in the NNFX trading algorithm:
1. Volatility - price volatility; e.g., Average True Range, True Range Double, Close-to-Close, etc.
2. Baseline - a moving average to identify price trend
3. Confirmation 1 - a technical indicator used to identify trends
4. Confirmation 2 - a technical indicator used to identify trends
5. Continuation - a technical indicator used to identify trends
6. Volatility/Volume - a technical indicator used to identify volatility/volume breakouts/breakdown
7. Exit - a technical indicator used to determine when a trend is exhausted
What is Volatility in the NNFX trading system?
In the NNFX (No Nonsense Forex) trading system, ATR (Average True Range) is typically used to measure the volatility of an asset. It is used as a part of the system to help determine the appropriate stop loss and take profit levels for a trade. ATR is calculated by taking the average of the true range values over a specified period.
True range is calculated as the maximum of the following values:
-Current high minus the current low
-Absolute value of the current high minus the previous close
-Absolute value of the current low minus the previous close
ATR is a dynamic indicator that changes with changes in volatility. As volatility increases, the value of ATR increases, and as volatility decreases, the value of ATR decreases. By using ATR in NNFX system, traders can adjust their stop loss and take profit levels according to the volatility of the asset being traded. This helps to ensure that the trade is given enough room to move, while also minimizing potential losses.
Other types of volatility include True Range Double (TRD), Close-to-Close, and Garman-Klass
What is a Baseline indicator?
The baseline is essentially a moving average, and is used to determine the overall direction of the market.
The baseline in the NNFX system is used to filter out trades that are not in line with the long-term trend of the market. The baseline is plotted on the chart along with other indicators, such as the Moving Average (MA), the Relative Strength Index (RSI), and the Average True Range (ATR).
Trades are only taken when the price is in the same direction as the baseline. For example, if the baseline is sloping upwards, only long trades are taken, and if the baseline is sloping downwards, only short trades are taken. This approach helps to ensure that trades are in line with the overall trend of the market, and reduces the risk of entering trades that are likely to fail.
By using a baseline in the NNFX system, traders can have a clear reference point for determining the overall trend of the market, and can make more informed trading decisions. The baseline helps to filter out noise and false signals, and ensures that trades are taken in the direction of the long-term trend.
What is a Confirmation indicator?
Confirmation indicators are technical indicators that are used to confirm the signals generated by primary indicators. Primary indicators are the core indicators used in the NNFX system, such as the Average True Range (ATR), the Moving Average (MA), and the Relative Strength Index (RSI).
The purpose of the confirmation indicators is to reduce false signals and improve the accuracy of the trading system. They are designed to confirm the signals generated by the primary indicators by providing additional information about the strength and direction of the trend.
Some examples of confirmation indicators that may be used in the NNFX system include the Bollinger Bands, the MACD (Moving Average Convergence Divergence), and the Stochastic Oscillator. These indicators can provide information about the volatility, momentum, and trend strength of the market, and can be used to confirm the signals generated by the primary indicators.
In the NNFX system, confirmation indicators are used in combination with primary indicators and other filters to create a trading system that is robust and reliable. By using multiple indicators to confirm trading signals, the system aims to reduce the risk of false signals and improve the overall profitability of the trades.
What is a Continuation indicator?
In the NNFX (No Nonsense Forex) trading system, a continuation indicator is a technical indicator that is used to confirm a current trend and predict that the trend is likely to continue in the same direction. A continuation indicator is typically used in conjunction with other indicators in the system, such as a baseline indicator, to provide a comprehensive trading strategy.
What is a Volatility/Volume indicator?
Volume indicators, such as the On Balance Volume (OBV), the Chaikin Money Flow (CMF), or the Volume Price Trend (VPT), are used to measure the amount of buying and selling activity in a market. They are based on the trading volume of the market, and can provide information about the strength of the trend. In the NNFX system, volume indicators are used to confirm trading signals generated by the Moving Average and the Relative Strength Index. Volatility indicators include Average Direction Index, Waddah Attar, and Volatility Ratio. In the NNFX trading system, volatility is a proxy for volume and vice versa.
By using volume indicators as confirmation tools, the NNFX trading system aims to reduce the risk of false signals and improve the overall profitability of trades. These indicators can provide additional information about the market that is not captured by the primary indicators, and can help traders to make more informed trading decisions. In addition, volume indicators can be used to identify potential changes in market trends and to confirm the strength of price movements.
What is an Exit indicator?
The exit indicator is used in conjunction with other indicators in the system, such as the Moving Average (MA), the Relative Strength Index (RSI), and the Average True Range (ATR), to provide a comprehensive trading strategy.
The exit indicator in the NNFX system can be any technical indicator that is deemed effective at identifying optimal exit points. Examples of exit indicators that are commonly used include the Parabolic SAR, the Average Directional Index (ADX), and the Chandelier Exit.
The purpose of the exit indicator is to identify when a trend is likely to reverse or when the market conditions have changed, signaling the need to exit a trade. By using an exit indicator, traders can manage their risk and prevent significant losses.
In the NNFX system, the exit indicator is used in conjunction with a stop loss and a take profit order to maximize profits and minimize losses. The stop loss order is used to limit the amount of loss that can be incurred if the trade goes against the trader, while the take profit order is used to lock in profits when the trade is moving in the trader's favor.
Overall, the use of an exit indicator in the NNFX trading system is an important component of a comprehensive trading strategy. It allows traders to manage their risk effectively and improve the profitability of their trades by exiting at the right time.
How does Loxx's GKD (Giga Kaleidoscope Modularized Trading System) implement the NNFX algorithm outlined above?
Loxx's GKD v1.0 system has five types of modules (indicators/strategies). These modules are:
1. GKD-BT - Backtesting module (Volatility, Number 1 in the NNFX algorithm)
2. GKD-B - Baseline module (Baseline and Volatility/Volume, Numbers 1 and 2 in the NNFX algorithm)
3. GKD-C - Confirmation 1/2 and Continuation module (Confirmation 1/2 and Continuation, Numbers 3, 4, and 5 in the NNFX algorithm)
4. GKD-V - Volatility/Volume module (Confirmation 1/2, Number 6 in the NNFX algorithm)
5. GKD-E - Exit module (Exit, Number 7 in the NNFX algorithm)
(additional module types will added in future releases)
Each module interacts with every module by passing data between modules. Data is passed between each module as described below:
GKD-B => GKD-V => GKD-C(1) => GKD-C(2) => GKD-C(Continuation) => GKD-E => GKD-BT
That is, the Baseline indicator passes its data to Volatility/Volume. The Volatility/Volume indicator passes its values to the Confirmation 1 indicator. The Confirmation 1 indicator passes its values to the Confirmation 2 indicator. The Confirmation 2 indicator passes its values to the Continuation indicator. The Continuation indicator passes its values to the Exit indicator, and finally, the Exit indicator passes its values to the Backtest strategy.
This chaining of indicators requires that each module conform to Loxx's GKD protocol, therefore allowing for the testing of every possible combination of technical indicators that make up the six components of the NNFX algorithm.
What does the application of the GKD trading system look like?
Example trading system:
Backtest: Strategy with 1-3 take profits, trailing stop loss, multiple types of PnL volatility, and 2 backtesting styles
Baseline: Hull Moving Average
Volatility/Volume: Hurst Exponent
Confirmation 1: Multi LSMA Slopes as shown on the chart above
Confirmation 2: Williams Percent Range
Continuation: Fisher Transform
Exit: Rex Oscillator
Each GKD indicator is denoted with a module identifier of either: GKD-BT, GKD-B, GKD-C, GKD-V, or GKD-E. This allows traders to understand to which module each indicator belongs and where each indicator fits into the GKD protocol chain.
Giga Kaleidoscope Modularized Trading System Signals (based on the NNFX algorithm)
Standard Entry
1. GKD-C Confirmation 1 Signal
2. GKD-B Baseline agrees
3. Price is within a range of 0.2x Volatility and 1.0x Volatility of the Goldie Locks Mean
4. GKD-C Confirmation 2 agrees
5. GKD-V Volatility/Volume agrees
Baseline Entry
1. GKD-B Baseline signal
2. GKD-C Confirmation 1 agrees
3. Price is within a range of 0.2x Volatility and 1.0x Volatility of the Goldie Locks Mean
4. GKD-C Confirmation 2 agrees
5. GKD-V Volatility/Volume agrees
6. GKD-C Confirmation 1 signal was less than 7 candles prior
Continuation Entry
1. Standard Entry, Baseline Entry, or Pullback; entry triggered previously
2. GKD-B Baseline hasn't crossed since entry signal trigger
3. GKD-C Confirmation Continuation Indicator signals
4. GKD-C Confirmation 1 agrees
5. GKD-B Baseline agrees
6. GKD-C Confirmation 2 agrees
1-Candle Rule Standard Entry
1. GKD-C Confirmation 1 signal
2. GKD-B Baseline agrees
3. Price is within a range of 0.2x Volatility and 1.0x Volatility of the Goldie Locks Mean
Next Candle:
1. Price retraced (Long: close < close or Short: close > close )
2. GKD-B Baseline agrees
3. GKD-C Confirmation 1 agrees
4. GKD-C Confirmation 2 agrees
5. GKD-V Volatility/Volume agrees
1-Candle Rule Baseline Entry
1. GKD-B Baseline signal
2. GKD-C Confirmation 1 agrees
3. Price is within a range of 0.2x Volatility and 1.0x Volatility of the Goldie Locks Mean
4. GKD-C Confirmation 1 signal was less than 7 candles prior
Next Candle:
1. Price retraced (Long: close < close or Short: close > close )
2. GKD-B Baseline agrees
3. GKD-C Confirmation 1 agrees
4. GKD-C Confirmation 2 agrees
5. GKD-V Volatility/Volume Agrees
PullBack Entry
1. GKD-B Baseline signal
2. GKD-C Confirmation 1 agrees
3. Price is beyond 1.0x Volatility of Baseline
Next Candle:
1. Price is within a range of 0.2x Volatility and 1.0x Volatility of the Goldie Locks Mean
3. GKD-C Confirmation 1 agrees
4. GKD-C Confirmation 2 agrees
5. GKD-V Volatility/Volume Agrees
█ GKD-C Multi LSMA Slopes
What is Multi LSMA Slopes?
Multi LSMA Slopes is an indicator that checks slopes of 5 (different period) Hull Moving Averages and adds them up to show overall trend. To us this, check for color changes from red to green where there is no red if green is larger than red and there is no red when red is larger than green. When red and green both show up, its a sign of chop. Gray means chop.
Requirements
Inputs
Confirmation 1 and Solo Confirmation: GKD-V Volatility / Volume indicator
Confirmation 2: GKD-C Confirmation indicator
Outputs
Confirmation 2 and Solo Confirmation Complex: GKD-E Exit indicator
Confirmation 1: GKD-C Confirmation indicator
Continuation: GKD-E Exit indicator
Solo Confirmation Simple: GKD-BT Backtest strategy
Additional features will be added in future releases.
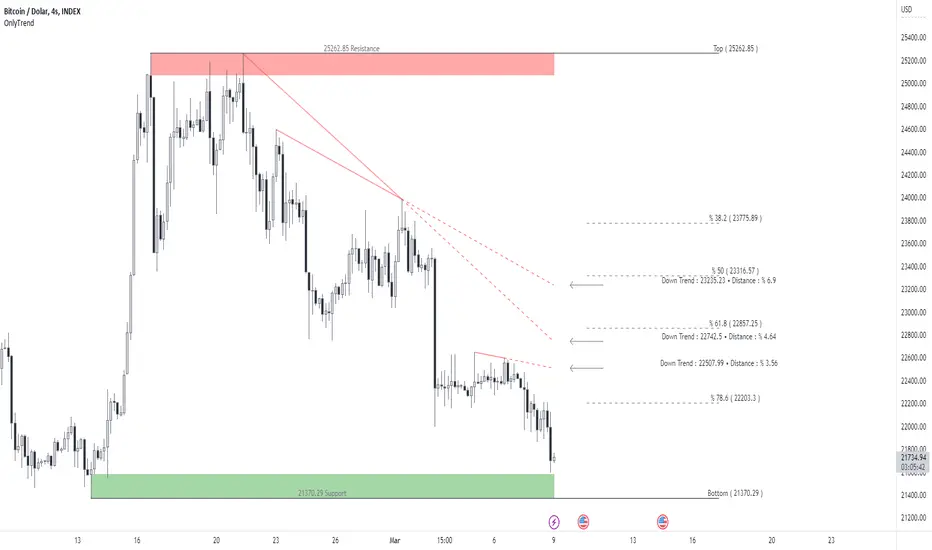
Trendlines, Support, Resistance and Fibonacci With AlertsHello Traders :)
I am Only Fibonacci.
I would like to give you detailed information about this indicator that I have prepared.
Within this indicator, you can see falling trends, rising trends, support and resistance, as well as Fibonacci levels.
I've prepared a few extra nice things for you. With this indicator, you can see the instant values of the active trend lines and their distance from the price. In my opinion, one of the best aspects of this indicator is that it can set alarms for automatically drawn trends. You can add alarms for both downtrend and uptrend.
The alarm is triggered at the break of the trend closest to the price.
Note: I do not recommend adding an alarm without thoroughly using the indicator.
We are now ready to introduce.
You can use this indicator in two languages. English and Turkish. The choice is yours.
When we enter the indicator settings, there is a group under the TREND heading. With the settings in this group, you can determine the sensitivity of the trends to be plotted. The lower the sensitivity, the less reliable the plotted trends will be. I am sure you will find the middle ground.
Trends are calculated by relationships between all detected peaks.
If you check the Show Data box, you can see the value of the active ( unbroken ) trends in the current candle. Sometimes it can create visual pollution. So you can remove it. Below will be a version view where the values of the trendlines are not visible.
If you don't want to see the trends on the chart at all, uncheck the Show Trends box.
One of our subtitles is Fibonacci.
When you enter the number of bars that need to be checked backwards, it finds the highest and lowest levels in the past bars, and automatically draws fibonacci levels on the screen with a beautiful visual.
If you don't want to see Fibonacci on your chart, you can uncheck the Fibonacci Show box.
Our last topic is support and resistances.
We need a certain sensitivity setting to see support and resistance on the chart. The sensitivity setting will provide you with more realistic data. I am sure that you can adjust the correct settings in this regard as well. If you don't want to see any or both support or resistance on the chart, you can uncheck the Show Resistance or Show Support boxes.
Alarm
Active downtrends and rising trends are kept on the chart. If you want to be notified on the falling trend break closest to the price, you should choose DownTrend Breakdown.
If you want to be notified on the breakout of the rising trend closest to the price, you should choose UpTrend Breakdown.
Visuality
Downtrends are covered by a filled line between the two points. It continues with a dashed line from the second peak to the active candle. When the trend is broken, it disappears. It is red in color.
Uptrends are covered by a filled line between the two points. It continues with a dashed line from the second bottom to the active candle. When the trend is broken, it disappears. It is green in color.
The resistances are determined to cover the entire wick from the starting point to the active candle. It is red in color. It disappears when the resistance is broken.
Supports are determined to cover the entire wick from the starting point to the active candle. It is green in color. It disappears when the support is broken.
Use the link below to access this indicator.
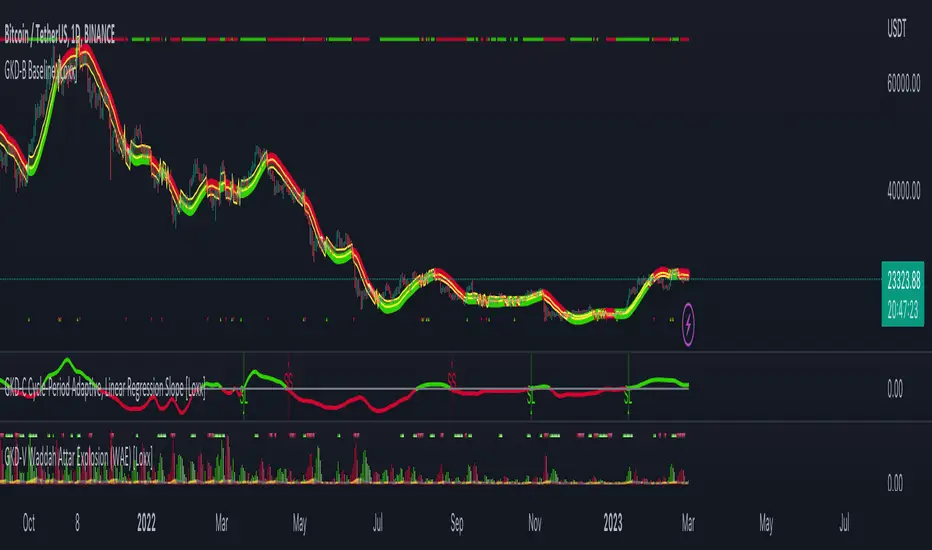
GKD-C Cycle-Period Adaptive, Linear Regression Slope [Loxx]Giga Kaleidoscope Cycle-Period Adaptive, Linear Regression Slope Oscillator is a Confirmation module included in Loxx's "Giga Kaleidoscope Modularized Trading System".
█ Giga Kaleidoscope Modularized Trading System
What is Loxx's "Giga Kaleidoscope Modularized Trading System"?
The Giga Kaleidoscope Modularized Trading System is a trading system built on the philosophy of the NNFX (No Nonsense Forex) algorithmic trading.
What is an NNFX algorithmic trading strategy?
The NNFX algorithm is built on the principles of trend, momentum, and volatility. There are six core components in the NNFX trading algorithm:
1. Volatility - price volatility; e.g., Average True Range, True Range Double, Close-to-Close, etc.
2. Baseline - a moving average to identify price trend
3. Confirmation 1 - a technical indicator used to identify trends
4. Confirmation 2 - a technical indicator used to identify trends
5. Continuation - a technical indicator used to identify trends
6. Volatility/Volume - a technical indicator used to identify volatility/volume breakouts/breakdown
7. Exit - a technical indicator used to determine when a trend is exhausted
How does Loxx's GKD (Giga Kaleidoscope Modularized Trading System) implement the NNFX algorithm outlined above?
Loxx's GKD v1.0 system has five types of modules (indicators/strategies). These modules are:
1. GKD-BT - Backtesting module (Volatility, Number 1 in the NNFX algorithm)
2. GKD-B - Baseline module (Baseline and Volatility/Volume, Numbers 1 and 2 in the NNFX algorithm)
3. GKD-C - Confirmation 1/2 and Continuation module (Confirmation 1/2 and Continuation, Numbers 3, 4, and 5 in the NNFX algorithm)
4. GKD-V - Volatility/Volume module (Confirmation 1/2, Number 6 in the NNFX algorithm)
5. GKD-E - Exit module (Exit, Number 7 in the NNFX algorithm)
(additional module types will added in future releases)
Each module interacts with every module by passing data between modules. Data is passed between each module as described below:
GKD-B => GKD-V => GKD-C(1) => GKD-C(2) => GKD-C(Continuation) => GKD-E => GKD-BT
That is, the Baseline indicator passes its data to Volatility/Volume. The Volatility/Volume indicator passes its values to the Confirmation 1 indicator. The Confirmation 1 indicator passes its values to the Confirmation 2 indicator. The Confirmation 2 indicator passes its values to the Continuation indicator. The Continuation indicator passes its values to the Exit indicator, and finally, the Exit indicator passes its values to the Backtest strategy.
This chaining of indicators requires that each module conform to Loxx's GKD protocol, therefore allowing for the testing of every possible combination of technical indicators that make up the six components of the NNFX algorithm.
What does the application of the GKD trading system look like?
Example trading system:
Backtest: Strategy with 1-3 take profits, trailing stop loss, multiple types of PnL volatility, and 2 backtesting styles
Baseline: Hull Moving Average as shown on chart
Volatility/Volume: Waddah Attar as shown on chart
Confirmation 1: Cycle-Period Adaptive, Linear Regression Slope Oscillator as shown on the chart above
Confirmation 2: Williams Percent Range
Continuation: Fisher Transform
Exit: Rex Oscillator
Each GKD indicator is denoted with a module identifier of either: GKD-BT, GKD-B, GKD-C, GKD-V, or GKD-E. This allows traders to understand to which module each indicator belongs and where each indicator fits into the GKD protocol chain.
Giga Kaleidoscope Modularized Trading System Signals (based on the NNFX algorithm)
Standard Entry
1. GKD-C Confirmation 1 Signal
2. GKD-B Baseline agrees
3. Price is within a range of 0.2x Volatility and 1.0x Volatility of the Goldie Locks Mean
4. GKD-C Confirmation 2 agrees
5. GKD-V Volatility/Volume agrees
Baseline Entry
1. GKD-B Baseline signal
2. GKD-C Confirmation 1 agrees
3. Price is within a range of 0.2x Volatility and 1.0x Volatility of the Goldie Locks Mean
4. GKD-C Confirmation 2 agrees
5. GKD-V Volatility/Volume agrees
6. GKD-C Confirmation 1 signal was less than 7 candles prior
Continuation Entry
1. Standard Entry, Baseline Entry, or Pullback; entry triggered previously
2. GKD-B Baseline hasn't crossed since entry signal trigger
3. GKD-C Confirmation Continuation Indicator signals
4. GKD-C Confirmation 1 agrees
5. GKD-B Baseline agrees
6. GKD-C Confirmation 2 agrees
1-Candle Rule Standard Entry
1. GKD-C Confirmation 1 signal
2. GKD-B Baseline agrees
3. Price is within a range of 0.2x Volatility and 1.0x Volatility of the Goldie Locks Mean
Next Candle:
1. Price retraced (Long: close < close or Short: close > close )
2. GKD-B Baseline agrees
3. GKD-C Confirmation 1 agrees
4. GKD-C Confirmation 2 agrees
5. GKD-V Volatility/Volume agrees
1-Candle Rule Baseline Entry
1. GKD-B Baseline signal
2. GKD-C Confirmation 1 agrees
3. Price is within a range of 0.2x Volatility and 1.0x Volatility of the Goldie Locks Mean
4. GKD-C Confirmation 1 signal was less than 7 candles prior
Next Candle:
1. Price retraced (Long: close < close or Short: close > close )
2. GKD-B Baseline agrees
3. GKD-C Confirmation 1 agrees
4. GKD-C Confirmation 2 agrees
5. GKD-V Volatility/Volume Agrees
PullBack Entry
1. GKD-B Baseline signal
2. GKD-C Confirmation 1 agrees
3. Price is beyond 1.0x Volatility of Baseline
Next Candle:
1. Price is within a range of 0.2x Volatility and 1.0x Volatility of the Goldie Locks Mean
3. GKD-C Confirmation 1 agrees
4. GKD-C Confirmation 2 agrees
5. GKD-V Volatility/Volume Agrees
█ Cycle-Period Adaptive, Linear Regression Slope Oscillator
What is Cycle-Period Adaptive, Linear Regression Slope Oscillator?
Cycle-Period Adaptive, Linear Regression Slope Oscillator is an oscillator that solves for the Linear Regression slope and turns it into an oscillator. This is a very simple calculation and uses one of Ehler's first implementations of his cycle period calculations. The output slope value is smoothed after calculation and before being drawn. This is a sort of momentum indicator and has a rich history with Forex traders around the world.
What is the Cycle Period?
The spectral content of the data are measured in a bank of contiguous filters as described in "Measuring Cycle Periods" in the March 2008 issue of Stocks & Commodities Magazine. The filter having the strongest output is selected as the current dominant cycle period. The cycle period is measured as the number of bars contained in one full cycle period.
What is Linear Regression?
In statistics, linear regression is a linear approach for modeling the relationship between a scalar response and one or more explanatory variables. The case of one explanatory variable is called simple linear regression ; for more than one, the process is called multiple linear regression.
Requirements
Inputs
Confirmation 1 and Solo Confirmation: GKD-V Volatility / Volume indicator
Confirmation 2: GKD-C Confirmation indicator
Outputs
Confirmation 2 and Solo Confirmation: GKD-E Exit indicator
Confirmation 1: GKD-C Confirmation indicator
Continuation: GKD-E Exit indicator
Additional features will be added in future releases.
Dynamic Linear Regression Oscillator | AdulariDescription:
This dynamic linear regression oscillator visualizes the general price trend of specific ranges in the chart based on the linear regression calculation, it automatically determines these ranges with pivot detection. The central line of the indicator is the baseline of the linear regression itself. This is a good tool to use to determine when a price is unusually far away from its baseline. The lines above or below it are overbought and oversold zones. These zones are based on the high or low of the range, in combination with the set multipliers.
The overbought and oversold lines indicate support and resistance; when the prices stay outside these levels for a significant period of time, a reversal can be expected soon. When the oscillator's value crosses above the signal or smoothed line the trend may become bullish. When it crosses below, the trend may become bearish.
This indicator is quite special, as it first determines price ranges using pivot detection. It then uses the middle of the range to determine how far the current price is from the baseline. This value is then rescaled compared to a set amount of bars back, putting it into relevant proportions with the current price action.
How do I use it?
Never use this indicator as standalone trading signal, it should be used as confluence.
When the value crosses above the signal this indicates the current bearish trend is getting weak and may reverse upwards.
When the value crosses below the signal this indicates the current bullish trend is getting weak and may reverse downwards.
When the value is above the middle line this shows the bullish trend is strong.
When the value is below the middle line this shows the bearish trend is strong.
When the value crosses above the upper line this indicates the trend may reverse downwards.
When the value crosses below the lower line this indicates the trend may reverse upwards.
Features:
Oscillator value indicating how far the price has currently deviated from the middle of the range. Proportioned to data from a set amount of bars ago.
Signal value to indicate whether or not the price is abnormally far from the middle of the range.
Horizontal lines such as oversold, overbought and middle lines, indicating possible reversal zones.
Automatic range detection using pivots.
Built-in rescaling functionality to ensure values are proportionate with the latest data.
How does it work? (simplified)
1 — Calculate the middle of the range.
2 — Define whether the current price is above the middle of the range or below.
3 — If above the middle of the range, calculate the difference of the current high and the middle line. If below, calculate the difference of the current low and the middle line.
4 — Smooth the value using a set moving average type.
5 — Rescale the value to proportionate it with the latest data.

Dynamic Linear Regression ChannelsPlots new linear regression channels from points where a previous channel is broken thus keeping the length of bars in the trend dynamic. Regression channels are useful in detecting trend changes, support and resistance levels and to trade mean reversions.
Note: Setting higher values of upper and lower deviation may result in error if the price never breaks the channel and the script references too many bars than supported.

Linear Regression AngleThere are several Linear Regression indicator in the Public Library, but I don't think there is one that converts the Linear Regression (LR) curve into angle in degrees, relative to a set reference frame. Due to the large price range between tickers, creating this indicator isn't as straight forward as I originally thought. For example, given the same time period, a stock that fluctuate in the 10's will have a true linear regression angle dramatically different from a penny stock. Even changing the scale on your chart will affect the "apparent" angle you see on the chart. Hence, this indicator DOES NOT provide the true linear regression angle, but only a relative one based on a defined number of historical bars.
Originality and usefulness
This indicator provides Linear Regression (LR) Angle in degree that may be more easily interpreted by some traders as we are more accustomed to line angles in degree and know how to visualize them.
This script also provides the option to overlay up to four LR curves of different periods, as well as an average curve of the enabled curves. This allows traders to analysis short to long term trends.
Furthermore, slope (rate of change) of each LR curves can be toggled. The slope plot can help traders visualize accelerations and decelerations of the LR curves which may help in spotting trend reversals.
Data table provides real time data for each curve.
Example of using slope plot with a 30 bars Linear Regression Angle:

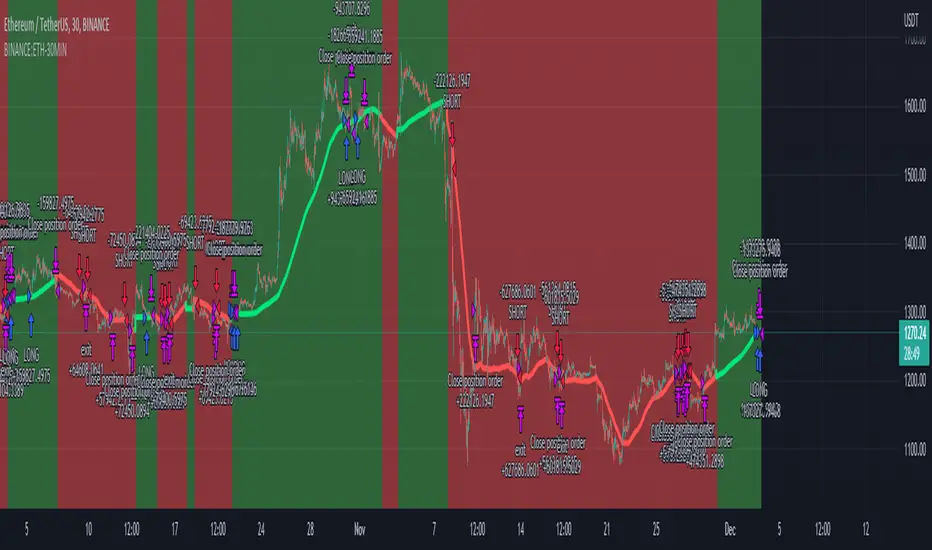
ETHUSDT Long-Short using EMA,OBV,ADX,LinearReg,DXY(No repaint)This script strategy is used to follow the trending EMA with a delta difference (Price-EMA) to know when to enter and with 5 variables mentioned below, stop loss is below EMA line all the time in long and above EMA line in short, is like a trailing stop after candle is closed. Hard stop is also placed to prevent big candles movements, also correlation between VIX and ETH when the correlation is <-0.2 the position can be opened.
Indicators used:
EMA , OBV , ADX , Linear regression and Dollar Index trending, Leverage is available for Long and Short positions.
LONG
When Price is above EMA and price-ema difference is smaller than "Long delta Price/MA"
OBV(4hrs) is above OBV-EMA(110)
Linear regression is strong
ADX is strong >50
DXY is trending down
SHORT
When Price is below EMA and ema-price difference is smaller than "Long delta Price/MA"
OBV(4hrs) is below OBV-EMA(110)
Linear regression is weak
ADX is weak <50
DXY is trending up
BINANCE:ETHUSDT 30 minutes Timeframe
The Systems Lab: PRX StrategyLike the PRX Indicator (which is also available) this PRX Strategy includes all the elements necessary to run the PRX Trading System or to incorporate any of its elements into your own analysis. But since this is a strategy it also includes all of the system entry and exit orders which allows them to be displayed on the charts and backtested in different configurations to see how specific configurations of the system could have performed in the past.
The primary concept is the identification of trends by way of a customized PSAR (Parabolic Stop and Reverse) calculation that uses linear regression to reduce market noise and highlight trends for longer using a method pioneered by Dr Ken Long. This means that price can penetrate the PSAR dots without causing a trend reversal to occur (flipping the dots over to the opposing side) which would normally occur with the traditional PSAR idea.
The intent is to help identify and stick with trends longer, adapt to changes in volatility by using linear regression as a noise filter and potentially capture large outlier moves. A linear regression curve is plotted as well in order to help identify when a change in trend will occur by it crossing the PSAR dots.
In order to make the trend as clear as possible the bars can be colored as either up-trend or down-trend with user selectable colors.
A moving average filter is also included as a longer term market condition filter in order to avoid periods when the market is against this average which is an inherent part of the system.
The strategy is currently long only (though we’re working on the short side) and includes standard entries along with a trailing stop using the customized PSAR. It also includes multiple options to re-enter with an existing trend if the trailing stop is hit but the trend remains in place.
Multiple parameters are available for customisation including the Linear Regression length, the Moving Average Filter lookback, enabling of the re-entry and continuation entry signals as well as a date range filter for more specific and repeatable backtesting over different markets and timeframes.
Risk Management is at the core of our system design principles and as such we set and limit the loss for every trade (which is also configurable as a parameter that defaults to $100/trade) and also trail the stop to both reduce risk and capture profit. The position size is calculated automatically and is volatility adjusted based on the initial stop.
Finally, there is a custom dashboard which shows all the relevant details for the current trade at a glance on the chart such as entry, initial stop (size and price), current trailing stop level and P/L in units of R-multiples (’R’ being the initial risk on the trade).

The Systems Lab: PRX IndicatorThis PRX Indicator includes all the elements necessary to run the PRX Trading System or to incorporate any of its elements into your own analysis and we’ve made it available here for those that want to use the same tools that we use ourselves.
The primary concept is the identification of trends by way of a customized PSAR (Parabolic Stop and Reverse) calculation that uses linear regression to reduce market noise and highlight trends for longer using a method pioneered by Dr Ken Long. This means that price can penetrate the PSAR dots without causing a trend reversal to occur (flipping the dots over to the opposing side) which would normally occur with the traditional PSAR idea.
The intent is to help identify and stick with trends longer, adapt to changes in volatility by using linear regression as a noise filter and potentially capture large outlier moves. A linear regression curve is plotted as well in order to help identify when a change in trend will occur by it crossing the PSAR dots.
In order to make the trend as clear as possible the bars can be colored as either up-trend or down-trend with user selectable colors.
A moving average filter is also included as a longer term market condition filter in order to avoid periods when the market is against this average which is an inherent part of the system.
Please note that we also have a PRX Strategy version available which includes everything in this indicator as well as all the system entry and exit orders which allows them to be displayed on the charts and backtested in different configurations to see how specific configurations of the system could have performed in the past.

Lagging Session Regression ChannelHello Traders !
Note :
This is my very first published script on trading view & from brainstorming an idea to developing to the finched product it was imperative to me for the indiactor and every one of its features to be of some meaningfull use. If you like the idea of statsitics being able to predict future prices in the market then this indicator may be usefull in your trading arsenal.
Introduction :
Lagging Session Regression Channel (LSRC) is a statistical trend analysis indicator that "laggs" the market by the user defined session, by defualt a day, by doing so the indicator leverges the ability of simple linear regression to predict future asset price.(This can be used on any asset in any market in any time frame)
Options & inputs :
- Bar regression lookback :
The value of bars back from the lats session change, if the seesion time is equivelnt to the the chart timefrmae then the regression line will not lag price, i.e it will act as a stantdard lineer regression channel chnaging on evrey last confimred bar.
- Standard Deviation lookback :
The value of bars from the last session change to cacluate the unbiased standard deviation, The lookback can be set to > or < the regression lookback to cauture > or < less asset volatility. (note this is the same as the residual standard deviation)
- Predicted price at nth bar :
if you whant to know the predicted close price value at any given point in the regression and to the RHS of the regression.
- Regression Line colors group :
Changes the colors of each plotted line.
- OLS Line color : is only changeable when trend color is set to false / unticked.
- Visable deviations group :
Plots the lines that you want on chart, e.g if "Show DEV1" and "Sow DEV SUB1" are the only inputs ticked then they will be the only lines ploted along with the simple linear regression line.
- Regression Line Dynamics group :
All inputs in this group change the regressions calculations given the bar lookback is constant / the same.
- Trend color : if set too true, when the close of the proceding real time bar is greater than the simple linear regression line from the last confimred session the line will be colored green, if otherwise the close is below the simple linear regression line the line will be colored red.
- Extend regression line :
This is the same chart image as seen on the publication chart image but with Extend regression line set to true, this allows the trader to test the valdity of the regression and how well it predicts future price, as seen on the M15 chart of BTCUSD above the indicator was pritty good at doing this.
- Standard deviation channel source :
Source for standard deviation to be calculated on. note if this is set to a varible other than the close then this will no longer be the resdiaul standard deviation, as of now "LSRC 1.0" the regression uses only the close for y / predicted values.
- Time elasped unitl next regression calculation :
The session time until the next LSRC will be calculated and plotted
Label LSRC stats :
- STAN DEV : the standard deviation used to cacluateed the deviation channels
- MIN : The lowest price across the regression
- MAX : The highest price across the regression
- n bars above dev 1 : The number of bars that closed above the first standard deviation channel across the entire regression calculation
- n bars below sub dev1 : The number of bars that closed below the first standard deviation channel.
- Regression Price : The output of "Predicted price at nth bar" input.
Hope you find this usefull !
I will continue too try improve this script and update it accordingly.