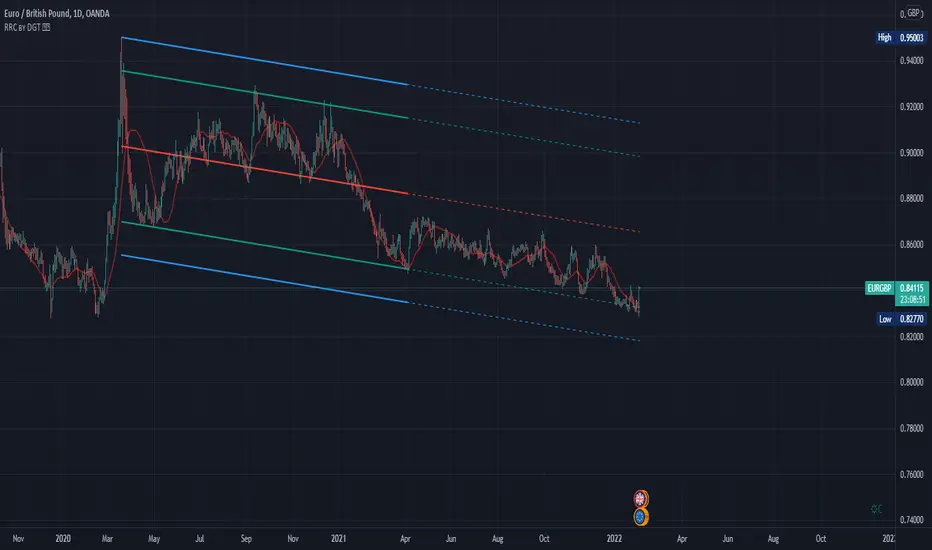
Raff Regression Channel by DGTRᴀꜰꜰ Rᴇɢʀᴇꜱꜱɪᴏɴ Cʜᴀɴɴᴇʟ (RRC)
This study aims to automate Raff Regression Channel drawing either based on ZigZag Indicator or optionally User Preference
The Raff Regression Channel , developed by Gilbert Raff, is based on a linear regression, which is the least-squares line-of-best-fit for a price series, with evenly spaced trend lines above and below . The width of the channel is set by determining the high or low that is the furthest from the linear regression.
Because the channel distance is based off the largest pullback or highest peak within a trend, for effectively drawing and using a Raff Regression Channel it is recommend/required that a Raff Regression Channel is applied to “mature” trends. Knowing this requirement, for better automated drawing results this study benefits from the Zig Zag Indicator, where the Zig Zag indicator is used to help identify price trends and changes in price trends. Option to manually adjust lengths for drawing a Raff Regression Channel is also made available.
Using a Raff Regression Channel
Once The Raff Regression Channel is drawn, covering an existing trend, Exᴛᴇɴꜱɪᴏɴ Lɪɴᴇꜱ are drawn to identify ᴛʜᴇ ꜱᴜᴘᴘᴏʀᴛ﹐ʀᴇꜱɪꜱᴛᴀɴᴄᴇ ᴏʀ ʀᴇᴠᴇʀꜱᴀʟ ᴘᴏɪɴᴛꜱ
The trend is up as long as prices rise within this channel. An uptrend may be reversing (not always, but likely) when price breaks below the channel extension . The trend is down as long as prices decline within the channel. Similarly, a downtrend may be reversing (not always, but likely) when price breaks above the channel extension . Moves outside the channel extensions can be indication of a reversal or can denote overbought or oversold conditions
For further details please refer to education post Raff Regression Channel
█ FEATURES
- AUTO or MANUALLY adjusted Raff Regression Channel and Channel Extentions drawing
- ALERTs, for Linear Regression Line, Raff Regression Upper and Lower Channel Extentions
- LSMA , Least Squares Moving Average, in other words Linear Regression Curve
█ SETTINGS
Setting Loopback and Number of Bars are the most important part for The Raff Regression Channel, where ;
- Lookback, defines where the Raff Regression Channel is starting, it is recommended to set to a trend begining
- Number of Bars, defines how many bars to be assumed for calculation, or simply stated the end of the Raff Regression Channel drawing (not extentions but the main channel, extentions by default will be drawn till the last bar)
Setting of Loopback and Number of Bars is performed eigher automatically based on Zig Zag indicator or users may prefer to set them manually. If selected automatically then
- Deviation and Depth values of Zig Zag indicator are used for calculations (enabling visually plotting of ZigZag Lines will help to identify better visually the points), where ;
Deviation, is a multiplier that affects how much the price should deviate from the previous pivot in order for the bar to become a new pivot.
Depth, affects the minimum number of bars that will be taken into account when building
Short-term traders may wish to apply the channel to small waves of a trend so they can reduce the value of the Deviation and Depth
█ OTHER CHANNEL CONSEPTS
Linear Regression Channels, , what linear regression channels are? and linear regression channel/curve/slope study
Fibonacci Channels, how to apply fibonacci channels and automated fibonacci channels study
Andrews’ Pitchfork, how to apply pitchfork and automated pitchfork study
Special Thanks to @Kiss66000 for his kind suggestion, je vous remercie beaucoup @Kiss66000
Disclaimer :
Trading success is all about following your trading strategy and the indicators should fit within your trading strategy, and not to be traded upon solely
The script is for informational and educational purposes only. Use of the script does not constitute professional and/or financial advice. You alone have the sole responsibility of evaluating the script output and risks associated with the use of the script. In exchange for using the script, you agree not to hold dgtrd TradingView user liable for any possible claim for damages arising from any decision you make based on use of the script
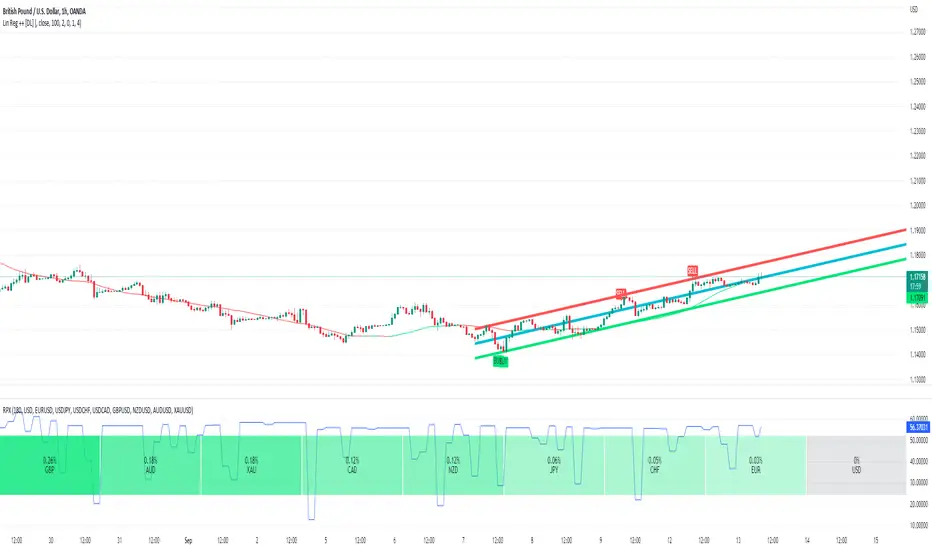
Linreg
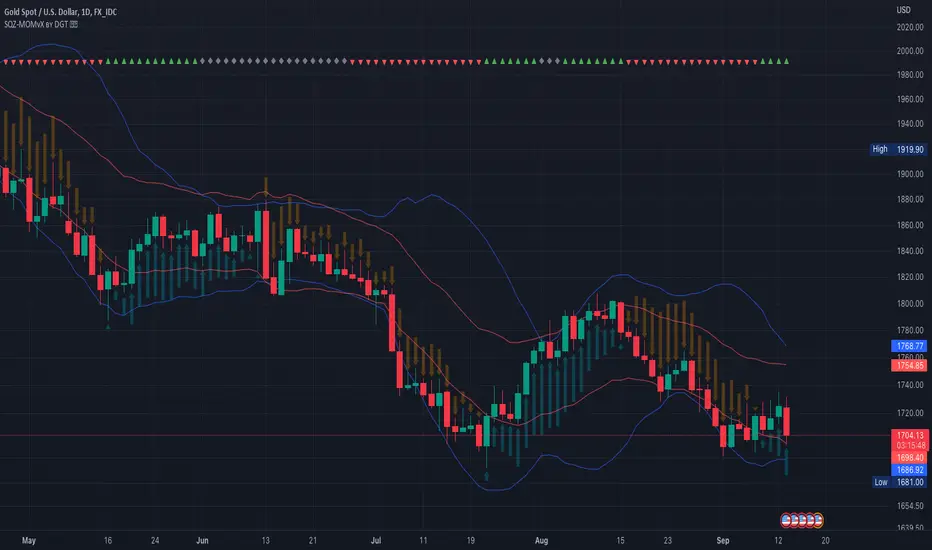
Squeeze Momentum Indicator [LazyBear] vX by DGTModified version of Squeeze Momentum Indicator visualizing on Price Chart
author: LazyBear, modified by KıvançÖZBİLGİÇ
USDJPY 30 MIN STRATEGYThis strategy uses a combination linear regression moving averages and ATR, fine-tuned to the USD/JPY 30 minute chart. Without going into too much detail, the long/short signals are based upon linear regression moving average crosses and slope with ATR confirmation.
All code is based on one time frame with no security functions so zero repaint. Backtest is based upon compounding 100% of your capital using zero leverage.
PM me for access to the strategy. Alert indicator for this available for donation via BTC.
I'm not a professional coder, but the backtests speak for themselves. As with anything on Tradingview, your results may vary and use at your own risk. Past performance is no indication of future performance.
- Hoffdaddy

Linear Regression ++Due to public demand
Linear Regression Formula
Scraped Calculation With Alerts
Here is the Linear Regression Script For traders Who love rich features
Features
++ Multi time frame -> Source Regression from a different Chart
++ Customized Colors -> This includes the pine lines
++ Smoothing -> Allow Filtered Regression; Note: Using 1 Defaults to the original line. The default is 1
++ Alerts On Channel/Range Crossing
Usage
++ Use this for BreakOuts and Reversals
++ This Script is not to be used Independently
Risks
Please note, this script is the likes of Bollinger bands and poses a risk of falling in a trend range.
Signals may Keep running on the same direction while the market is reversing.
Requests
If you have any feature requests, comment below or dm me. I will answer when i can.
Feel free to utilize this on your chart and share your ideas
For developers who want to use this on their chart, Please use this script
The original formula for calculation is posted there
❤❤❤ I hope you love this. From my heart! ❤❤❤
Lnear Regression ++Here is another amazing script for you guys
Target Audience
++ Programmers
++ Linear Regression Enthusiasts
Please Use this Indicator If you understand the risk posed by linear regression; ill explain some below
Features
++ Raw Formulae for the linear regression
--I understand that tradingview explanation on how the linreg function works is not clear to many of you and therefore i included this for developers
--Yes its much simpler than you thought, Do Enjoy
++ Alerts
--You can get alerts when the lower band is crossed/touched based on your settings
--These alerts are not repainting at all.
Linear Regression Limits
As you traders know, the market changes from time and new levels will get drawn
The alerts are based on these new levels and once we have new ones, we keep updating
Risk
This script is similar to Bollinger Bands style of alerts, If the market moves continuously to one direction after the break of a band, The levels change and you may receive a new signal confirmation
Cheers!! Enjoy!! Feel free to ask me for any improvements
Minkowski Distance Period Linear Regression BandsHello, this script was created by using Linear Regression Bands Function with variable Function Minkowski Distance Adaptive Period.
Function Linear Regression Bands :
Minkowski Distance Function Original Script by RicardoSantos :
Functions saved from overloads . And suitable for mutable variable periods.
Regards.
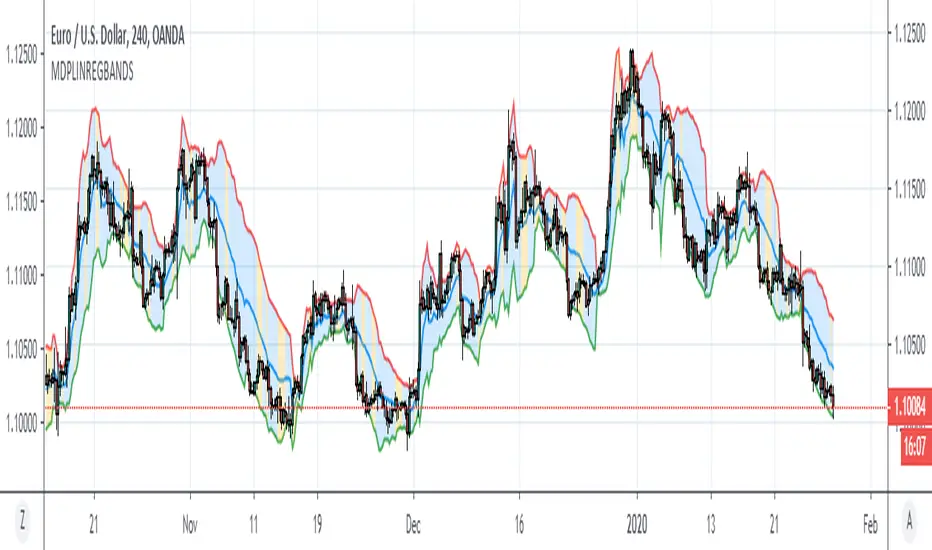
Function : Linear Regression Bands
Used with Pearson Correlation. It can be used to make sense of the trends. Very successful results can be obtained with a MACD style indicator and volume indicator that gives Buy and Sell orders.Open for adaptive and mutable variable periods of moving averages. Best regards!

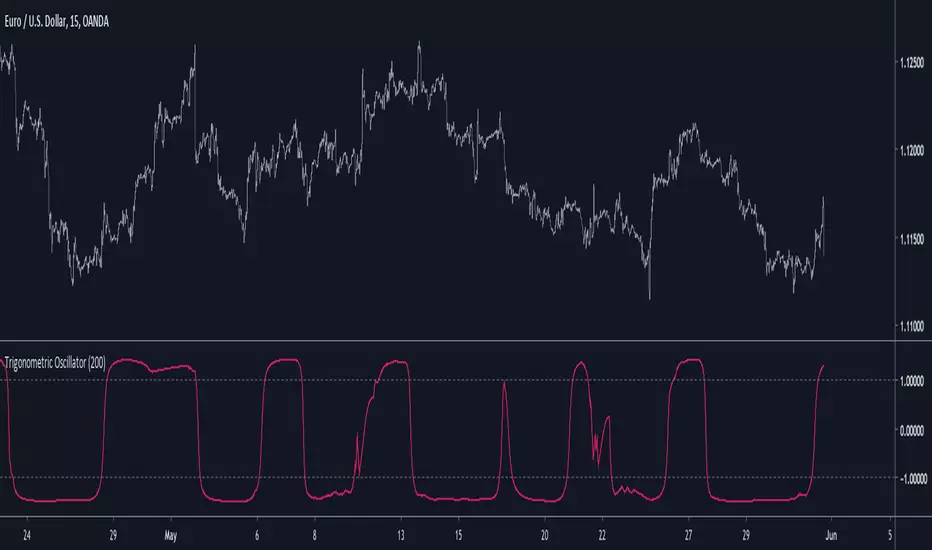
Trigonometric OscillatorIts a pretty old script and i have absolutely no idea how i did it, the code kinda look like the phase wrapping/unwrapping formula. This indicator is an oscillator, sometimes its reactivity is impressive so i think its a good idea to post it, feel free to experiment with it.
Fractal Regression Channel V0.1Port of @RicardoSantos' Fractal Regression Channel V0 from pinescript 2 to pinescript 3.
// Source:
// Original Author: @RicardoSantos

BB Forecast PrototypeExperiment to try apply @atrader2's MA Forecast () to bollinger bands - didn't exactly work out how I expected it to, especially with the Upper/Lower forecast projections.

Function for Least Squares Moving AverageThank you to alexgrover for putting me wide to this, after putting up with long conversations and stupid questions. Follow him and behold: www.tradingview.com
What is this?
This is simply the function for a Least Squares Moving Average. You can render this on the chart by using the linreg() function in Pine.
Personally I like to use the slope of the LSMA to help determine what direction to take a trade in, but I'm sure there are other, more exotic ways of using it and, if you know how to get your fingers dirty with Pine, you can create more exotic versions of it by modifying the function provided.
Want to learn?
If you'd like the opportunity to learn Pine but you have difficulty finding resources to guide you, take a look at this rudimentary list: docs.google.com
The list will be updated in the future as more people share the resources that have helped, or continue to help, them. Follow me on Twitter to keep up-to-date with the growing list of resources.
Suggestions or Questions?
Don't even kinda hesitate to forward them to me. My (metaphorical) door is always open.

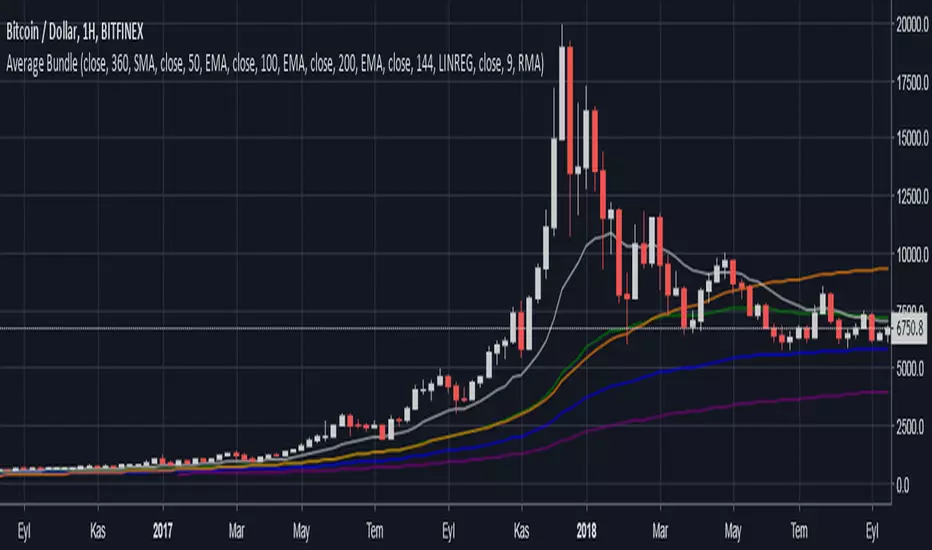
Average BundleSix (6) average indicators in single package.
All averages have adjustable source, length and type individually
Every average can be enabled or disabled individually.
Color, thickness and other style parameters are adjustable on Style section.
Supported types are:
EMA - Exponential Moving Average
SMA - Simple Moving Average
RMA - Running Moving Average
WMA - Weighted Moving Average
LINREG - Linear Regression
Investopedia is a good source to learn about moving average types.
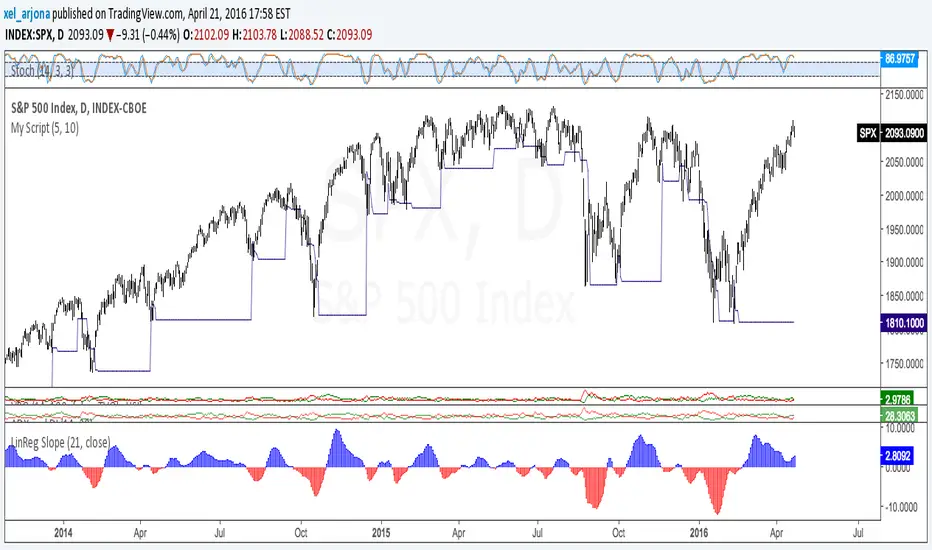
ORDINARY LEAST SQUARES Slope by @XeL_ArjonaORDINARY LEAST SQUARES Slope by @XeL_Arjona
Ver. 1 by Ricardo M Arjona @XeL_Arjona
DISCLAIMER:
The Following indicator/code IS NOT intended to be a formal investment advice or recommendation by the author, nor should be construed as such. Users will be fully responsible by their use regarding their own trading vehicles/assets.
The embedded code and ideas within this work are FREELY AND PUBLICLY available on the Web for NON LUCRATIVE ACTIVITIES and must remain as is.
WHAT'S THIS?
This is a REAL mathematically approach of an ORDINARY LEAST SQUARES LINE FITTING SLOPE as TradingView currently don't have a native one embedded, neither as a pine function. Other "Sope" indicators from this linear regression model I found on public library are currently based on "momentum" rather tan slope.
Any modifications or additions are quite welcome!
Cheers!
@XeL_Arjona
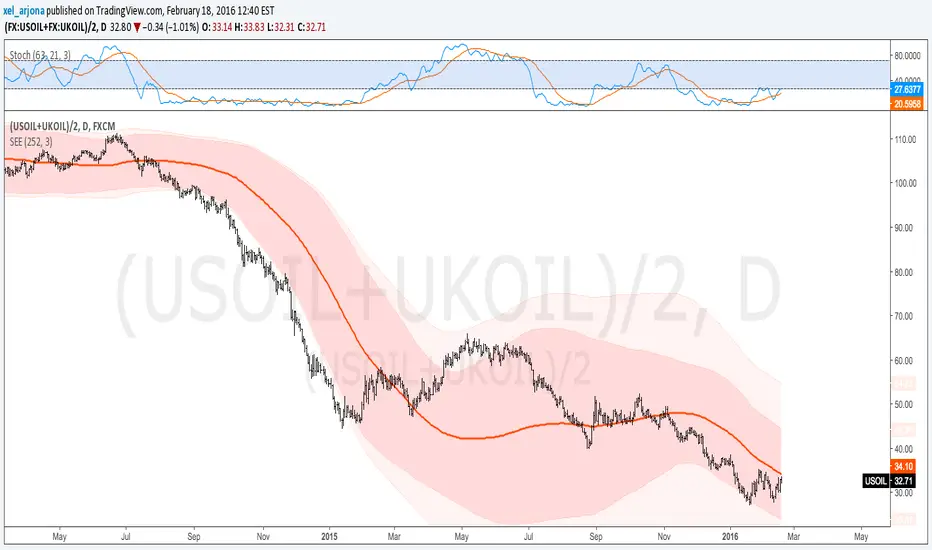
Standard Error of the Estimate -Composite Bands-Standard Error of the Estimate - Code and adaptation by @glaz & @XeL_arjona
Ver. 2.00.a
Original implementation idea of bands by:
Traders issue: Stocks & Commodities V. 14:9 (375-379):
Standard Error Bands by Jon Andersen
This code is a former update to previous "Standard Error Bands" that was wrongly applied given that previous version in reality use the Standard Error OF THE MEAN, not THE ESTIMATE as it should be used by Jon Andersen original idea and corrected in this version.
As always I am very Thankfully with the support at the Pine Script Editor chat room, with special mention to user @glaz in order to help me adequate the alpha-beta (y-y') algorithm, as well to give him full credit to implement the "wide" version of the former bands.
For a quick and publicly open explanation of this truly statistical (regression analysis) indicator, you can refer at Here!
Extract from the former URL:
Standard Error Bands are quite different than Bollinger's. First, they are bands constructed around a linear regression curve. Second, the bands are based on two standard errors above and below this regression line. The error bands measure the standard error of the estimate around the linear regression line. Therefore, as a price series follows the course of the regression line the bands will narrow, showing little error in the estimate. As the market gets noisy and random, the error will be greater resulting in wider bands.
[STRATEGY] Follow the Janet YellenIn the era of central bank's helicopter money, the market will always be skyrocketing up and up given enough time.
What's the strategy to profit from indices?
Only short the market when its in a state of euphoria /irrational exuberance bubble, or sell when it is confirmed (20% drawdown). Otherwise, you really have no reason not to long at every chance.
Conclusion:
Follow the printing press like a sheep.
